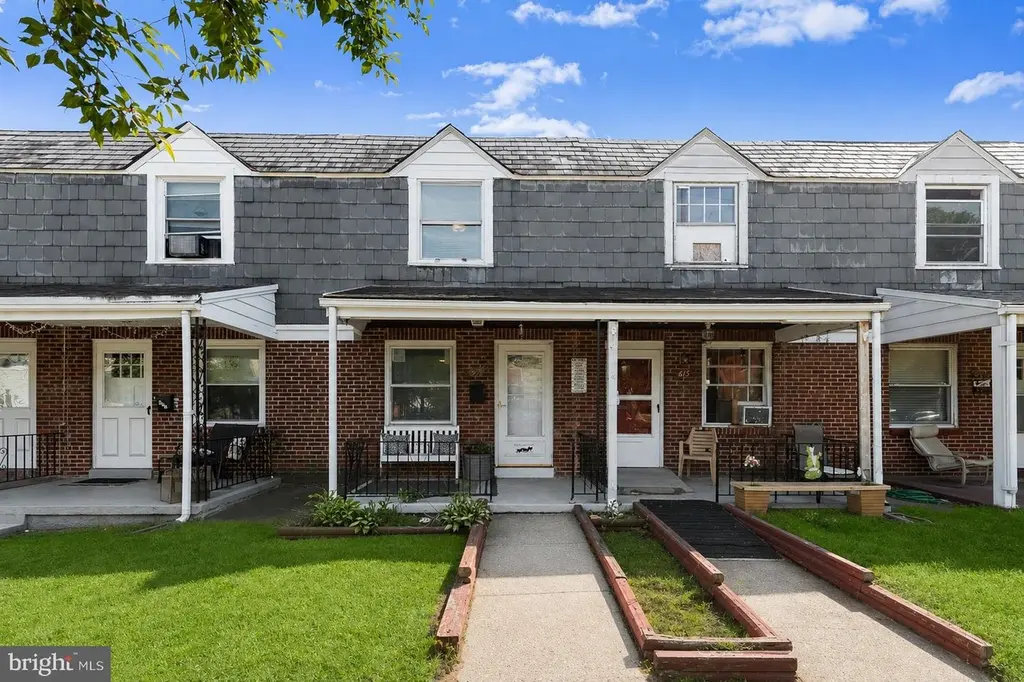
617 Annabel Ave · Baltimore, MD
Flood risk 1/10 · Minimal
- FEMA flood zone
- X (unshaded)
- Chance of flooding over 30 yrs
- 0.0%
- Est. flood insurance / yr
- $473 – $860
Fire risk 1/10 · Minimal
- Est. fire insurance / yr
- $755 – $1,403
Heat risk 8/10 · Major
- Hot days now (above 102°F)
- 7 days/yr
- Hot days in 30 yrs
- 15 days/yr
Wind risk 6/10 · Moderate
- Chance of severe wind over 30 yrs
- 27.0%
Air-quality risk 4/10 · Minor
- Unhealthy air days now
- 5 days/yr
- Unhealthy air days in 30 yrs
- 7 days/yr
Risk factors via First Street. Map © Google.
Why this score? — see what drove the D grade
The composite is a weighted blend of 9 inputs, each scored 0–100. Each bar is that input's sub-score; the figure is the points it added to the 100-point composite (weight × sub-score).
- Cash flow +20.4/30.0
- DSCR +6.5/10.0
- 1% rule +4.6/10.0
- Livability +3.8/5.0
- Rent growth +3.5/5.0
- Condition / age +2.5/5.0
- Schools +1.0/10.0
- ARV discount +0.0/15.0
- Appreciation +0.0/10.0
$170,000
🖨 Deal sheet 📄 Offer letter ✓ Due diligence
Key facts
- Built 1942
- Listed 22 days
Property features AI
Finance
- Other: Fee simple ownership; Below-grade area partially finished (434 below-grade area); Above-grade finished area recorded at 967 (assessor)
Exterior
- Parking: Alley access; On-street parking
- Utilities: Public water; Public sewer; Electric cooling fuel; Natural gas for heating and hot water
- Home design: Interior townhouse / rowhouse; Main entrance faces northeast
- Construction: Brick construction; Shingle roof; Foundation: other
- Exterior features: Porch(es); Exterior lighting; Sidewalks; Rear fencing; Landscaped lot
Interior
- Kitchen: Dishwasher; Gas range / oven; Refrigerator; Freezer; Icemaker; Water dispenser; Stainless steel appliances; Single oven
- Bedrooms: Two bedrooms on the first upper level (Master Bedroom, Bedroom 2)
- Flooring: Ceramic tile; Laminate plank; Luxury vinyl plank
- Bathrooms: One full bathroom (on upper level)
- Heating & cooling: Forced air heating (natural gas); Central air conditioning; Ceiling fans; Hot water heated by natural gas
- Interior features: Ceiling fans; Traditional floor plan; Tub with shower; Drywall walls and ceilings; Partially finished basement with improved, heated space, interior access, walkout stairs, windows and rear/outside entrance; connecting stairway
- Laundry & utility: Washer and dryer (laundry located on lower floor); Water heater
Neighborhood map
What this means for you Summary
Snapshot
- This is a 2-bed/1.0-bath townhouse listed at $170k.
Deal economics
- At list price, monthly cash flow is $222 ($3k/yr) — positive.
- The deal already cash-flows at list — no discount required.
- To meet the 1% rule (rent ≥ 1% of price), the offer needs to be $164k (3.8% below list).
- Recommended offer: $164k (3.8% below list) — sets the bar for 1% rule.
- Cap rate 7.9% vs local median 6.0% in Baltimore — top-decile yield for the area; either an underpriced asset or a hidden risk that comps aren't pricing in. Stress-test before assuming the spread holds.
Location & tenants
- Location reads 76/100 on livability (#90 in MD, #3,396 nationally) — a middle-class / working-renter tenant base. Strengths: amenities A+, commute A+, housing A+; Watch: schools D, crime F.
- Baltimore City Public Schools (urban): math 7% / reading 16% proficiency, ranked #24 of 24 in MD (top 100%) — low school quality limits family demand, transient renter base, plan for 1-2y turnover; 79% free/reduced lunch — lower-income household profile, screen leases tightly.
- Market conditions: Rents rising fast (+4.1%/yr); 165 active listings in the ZIP; 26 comparable units currently listed for rent nearby; rentals at typical pace (median 24d on market — plan ~3-4 weeks tenant-placement turnaround); 1,273 units permitted in Baltimore city in 2024 (1,104 in 5+ unit buildings).
- This rent runs 36% of the median local income ($54k/yr) — at the standard rent-burdened threshold; future hikes will face affordability resistance.
Forward outlook
- Local home prices are declining (-3.0%/yr); year-one equity from $1k of loan paydown is wiped out by about $5k of value loss. Plan a longer hold.
- Baltimore County population projected to shrink 4% by 2050 — rents likely to lag national; underwrite the cash flow, not the appreciation.
Negotiation context
- It's been on market 22 days — a 2% lower offer ($167k) is reasonable based on typical stale-listing flexibility.
- 3 sale attempts with the ask held roughly flat each time — persistent listings suggest the price (not the market) is what's stuck; bring a comps-based counter.
- Current owner paid $96k; list at $170k implies a 78% gain — meaningful room to come down on a strong offer.
Risks & watch-outs
- Watch-outs: built in 1942 — expect roof / HVAC / electrical / plumbing capex.
- Climate carrying-cost: major wind risk, 27% chance of damaging wind over 30y; extreme-heat days projected 7→15/yr by 2055 (HVAC capex compounding) — expect insurance premiums to compound above CPI over the hold.
Questions for the listing agent
- Built in 1942 — when were the roof, HVAC, electrical panel, plumbing, and water heater last replaced?
- Is there a deadline driving the sale (1031 exchange, divorce, estate, relocation)? That informs how much negotiation room exists.
- Schools are D-rated, which usually means shorter tenancies and higher turnover. Who's the typical renter profile here, and what's been the actual vacancy rate?
- Crime grade is F in this area — have there been break-ins, vandalism, or insurance claims at this property in the last 3 years? What carrier currently insures it and at what premium?
- The area grade is low — what's the realistic commute time and amenity access for the typical tenant pool here? Any planned neighborhood developments (good or bad) we should know about?
- What's the average days-on-market for RENTAL listings here right now (not sales)? A rising rental-DOM trend means longer vacancies and softer asking-rent achievability than the comps imply.
- What's the recent tenant-quality profile in this submarket — average credit score on applications, eviction rate, late-payment / NSF rate, and stable-employment percentage? A property-management company in the area should have these aggregated.
- How much new for-sale + rental construction is in the pipeline within 1–3 miles? Heavy new supply typically softens prices + rents 12–24 months out; constrained supply supports both.
Investment metrics
- 1% rule
- 0.96% ✗
- Cap rate
- 7.86%
- Cash-on-cash
- 5.60%
- DSCR
- 1.25
- GRM
- 8.7
CMA / ARV
- ARV (median comp)
- $134,355
- List price
- $170,000
- Delta
- 26.53%
- Verdict
- OVERPRICED
- Comps
- 20 within 1.0 mi
Show comp detail 12 sales within ~0.75 mi
| Address | Dist | Beds/Ba | Sqft | Sold | Price | $/sf | Match |
|---|---|---|---|---|---|---|---|
| 415 Cambria St | 0.21mi | 3/1.0 (+1) | 968 (+0%) | 3mo | $76,000 | $79 | 83 |
| 3731 10th St | 0.39mi | 2/1.0 | 1,041 (+8%) | 3mo | $125,000 | $120 | 67 |
| 3712 8th St | 0.22mi | 2/1.5 | 1,088 (+12%) | 0mo | $60,000 | $55 | 66 |
| 3507 4th St | 0.22mi | 2/1.0 | 1,102 (+14%) | 2mo | $50,000 | $45 | 65 |
| 3571 Horton Ave | 0.26mi | 2/1.0 | 826 (-15%) | 1mo | $25,000 | $30 | 63 |
| 4132 Doris Ave | 0.54mi | 3/1.5 (+1) | 992 (+3%) | 1mo | $215,000 | $217 | 62 |
| 3547 5th St | 0.12mi | 3/2.5 (+1) | 1,092 (+13%) | 3mo | $205,000 | $188 | 59 |
| 4144 Townsend Ave | 0.60mi | 3/1.5 (+1) | 992 (+3%) | 3mo | $90,100 | $91 | 59 |
| 3948 Brooklyn Ave | 0.41mi | 3/1.5 (+1) | 1,080 (+12%) | 0mo | $90,000 | $83 | 54 |
| 3916 2nd St | 0.54mi | 3/2.0 (+1) | 1,024 (+6%) | 2mo | $247,000 | $241 | 54 |
| 1347 Cambria St | 0.62mi | 3/2.5 (+1) | 986 (+2%) | 3mo | $177,000 | $180 | 54 |
| 4009 8th St | 0.38mi | 2/2.5 | 1,088 (+12%) | 2mo | $223,000 | $205 | 54 |
Match score weights: distance 35% · size 25% · config 20% · recency 20%. Top-matched comps best support the ARV.
Projected returns pro-forma
-3.0% appreciation · 4.08% rent growth · sell at horizon
- IRR
- -6.5%
- Equity multiple
- 0.76×
- Total profit
- $-11,635
- Equity at exit
- $25,348
- IRR
- 4.3%
- Equity multiple
- 1.33×
- Total profit
- $15,470
- Equity at exit
- $14,698
Cash invested: $47,600 (down + closing). Projections, not guarantees.
Landlord ↔ Tenant lean methodology
- Overall (CITY)
- 12 Strongly Tenant-Friendly
- State Maryland
- 27 Tenant-Leaning · D+14
- County
- — inherits STATE
- City Baltimore
- 12 Strongly Tenant-Friendly · D+58
ZIP-level market 21225
- Home prices YoY
- -31.9%
- Rents YoY
- 4.1%
- Active inventory
- 165
- Price-to-rent
- 8.7×
Monthly cashflow live
- Estimated rent
- $1,636 high interval (Pro) →
- Mortgage (P&I)
- −$891
- Tax from tax record
- −$107 /mo · $1,289/yr
- Insurance
- −$71
- HOA
- −$0
- Vacancy / Maint / Mgmt
- −$343
- Net cashflow
- $222
Break-even live
UW: 25.0% down · 7.5% · 30yr · 1.5% tax · 5.0% vac · 8.0% maint · 8.0% mgmt
Financing live
Cash to close
- Down payment
- $42,500
- Closing costs
- $5,100
- Reserves months
- —
- Total cash needed
- —
Loan-product check · same deal, 3 products live
Conventional
25% down · 7.5% · 30yr
- Down + closing
- —
- Monthly P&I
- —
- Monthly cashflow
- —
- DSCR
- —
- Eligible?
- —
Personal DTI + credit; lowest rate.
DSCR
20% down · 8.5% · 30yr
- Down + closing
- —
- Monthly P&I
- —
- Monthly cashflow
- —
- DSCR
- —
- Eligible?
- —
No personal income docs; deal must DSCR.
Hard money
10% down · 12.0% · 12mo
- Down + closing
- —
- Monthly P&I
- —
- Monthly cashflow
- —
- DSCR
- —
- Eligible?
- —
Short-term bridge; refi at stabilization.
Rent comps 26 comps
| Address | Beds | Baths | Sqft | Rent | $/sqft | DOM | Units | Dist |
|---|---|---|---|---|---|---|---|---|
| 3528 6th St Brooklyn, MD | 2.0 | 2.5 | 1060 | $1,500 | $1.42 | 17d | 1 | 0.07mi |
| 520 Baltic Ave Unit B Baltimore, MD | 1.0 | 1.0 | 800 | $1,050 | $1.31 | 43d | 1 | 0.21mi |
| 507 Washburn Ave Brooklyn, MD | 3.0 | 1.5 | 1024 | $2,500 | $2.44 | 20d | 1 | 0.25mi |
| 507 Washburn Ave Brooklyn, MD | 3.0 | 1.5 | 1024 | $2,500 | $2.44 | 4d | 1 | 0.25mi |
| 507 Washburn Ave Brooklyn, MD | 3.0 | 1.5 | 1024 | $2,500 | $2.44 | 23d | 1 | 0.25mi |
| 3513 Horton Ave Brooklyn, MD | 3.0 | 1.0 | 1020 | $1,600 | $1.57 | 17d | 1 | 0.27mi |
| 3840 8th St Brooklyn, MD | 3.0 | 1.5 | 1088 | $1,606 | $1.48 | 4d | 1 | 0.30mi |
| 837 E Jeffrey St Apt 1 Baltimore, MD | 1.0 | 1.0 | 1116 | $900 | $0.81 | 17d | 1 | 0.36mi |
| 837 E Jeffrey St Unit 2 Baltimore, MD | 1.0 | 1.0 | 1116 | $900 | $0.81 | 43d | 1 | 0.36mi |
| 3826 10th St Unit Entire House Baltimore, MD | 3.0 | 2.0 | 1110 | $2,400 | $2.16 | 23d | 1 | 0.41mi |
| 1049 E Patapsco Ave Unit a Baltimore, MD | 2.0 | 1.0 | 748 | $1,257 | $1.68 | 43d | 1 | 0.42mi |
| 807 Stoll St Unit 1 Baltimore, MD | 1.0 | 1.0 | 658 | $1,000 | $1.52 | 43d | 1 | 0.43mi |
| 4206 Audrey Ave Brooklyn, MD | 3.0 | 3.0 | 1104 | $1,950 | $1.77 | 23d | 1 | 0.56mi |
| 4206 Audrey Ave Brooklyn, MD | 2.0 | 2.0 | 1104 | $1,275 | $1.15 | 43d | 1 | 0.56mi |
| 1305 E Patapsco Ave Brooklyn, MD | 3.0 | 1.5 | 930 | $1,650 | $1.77 | 4d | 1 | 0.56mi |
| 1353 Cambria St Brooklyn, MD | 3.0 | 2.0 | 986 | $1,600 | $1.62 | 17d | 1 | 0.63mi |
| 4207 3rd St Unit 3 Brooklyn, MD | 2.0 | 1.0 | 850 | $1,595 | $1.88 | 4d | 1 | 0.63mi |
| 4400 4th St Unit BASEMENT Baltimore, MD | 2.0 | 1.0 | 925 | $1,350 | $1.46 | 43d | 1 | 0.65mi |
| 217 W Edgevale Rd Brooklyn, MD | 3.0 | 1.5 | 992 | $1,800 | $1.81 | 23d | 1 | 0.86mi |
| 205 Arundel Rd W Brooklyn, MD | 1.0 | 1.0 | 608 | $1,200 | $1.97 | 43d | 1 | 0.87mi |
| 5215 Wasena Ave Brooklyn, MD | 3.0 | 1.0 | 1030 | $1,650 | $1.60 | 43d | 1 | 0.89mi |
| 1628 Plum St Apt B (CB) Baltimore, MD | 1.0 | 1.0 | 800 | $850 | $1.06 | 23d | 1 | 0.93mi |
| 5227 Patrick Henry Dr Brooklyn, MD | 2.0 | 1.0 | 736 | $1,326 | $1.80 | 21d | 1 | 0.96mi |
| 1 Ballman Ct Unit 2 Baltimore, MD | 2.0 | 1.0 | 700 | $1,250 | $1.79 | 43d | 1 | 0.96mi |
| 511 Seagull Ave Brooklyn, MD | 2.0 | 1.0 | 756 | $1,550 | $2.05 | 23d | 1 | 1.18mi |
| 2868 Potee St Baltimore, MD | 1.0–3.0 | 1.0 | 720 | $1,392 | $1.93 | 2d | 22 | 1.42mi |
Listing history 12 events
-
2026-04-30$170,000 Active 1149-char remark
-
2026-04-24historical $170,000 1149-char remark
-
2026-03-31historical
-
2026-02-14price $179,900
-
2025-12-03$189,500 Active
-
2025-10-16historical
-
2025-09-26price $190,500
-
2025-09-15price $195,000
-
2025-08-04$200,000 Active
-
2025-07-09historical
-
2008-07-24soldstatus $95,716
-
1990-08-22soldstatus $58,000
ⓘ Source: listings_history table (triggers on properties + properties_extension) + one-shot
backfill from property_details.listing_events for pre-trigger history.
Tax reassessment forecast MD · Partial reset (capped growth)
- Current annual tax
- $1,289 · $107/mo
- Projected year-2 tax
- $1,571 · $131/mo
- Expected delta
- +$282/yr (+$23/mo · 21.9%)
ⓘ Screening estimate from a state-policy table — verify with the county assessor before closing.
Climate risk First Street
- Flood 1/10 Low FEMA zone X (unshaded) · 0% chance over 30 yrs
- Wildfire 1/10 Low
- Heat 8/10 Severe 7 d/yr ≥102°F today · 15 d/yr by 30 yrs out
- Wind 6/10 Major 27% chance of damaging wind over 30 yrs
- Air quality 4/10 Moderate 5 unhealthy d/yr today · 7 by 30 yrs out
Nearby sold comps map
Loading sold comps map…
Walkable amenities ~0.75 mi
Loading nearby amenities…
Taxation est. · year 1
- Rental income
- $19,626
- − Mortgage interest
- −$9,523
- − Property taxes
- −$1,289
- − Insurance
- −$850
- − Repairs & maintenance
- −$1,570
- − Management
- −$1,570
- − Depreciation
- −$4,945
- Taxable loss
- −$122
- Est. tax savings @ 24.0%
- +$29
- After-tax cash flow
- $2,696/yr
For passive investors: Depreciation is non-cash, so a rental often shows a tax loss while cash-flowing — sheltering income. Rental losses are passive: they offset passive income freely, and up to $25,000/yr can offset ordinary (W-2) income if you actively participate and your MAGI is under $100k (phasing out to $0 by $150k); unused losses carry forward. On sale, claimed depreciation is recaptured at up to 25%, and gains may owe capital-gains tax (a 1031 exchange can defer both). Figures are a year-1 estimate at your 24.0% rate — not tax advice; consult a CPA.
Schools (NCES district)
- District
- Baltimore City Public Schools
- NCES district ID
- 2400090
- Math proficiency
- 7% ▼ -9.00%
- Reading proficiency
- 16% ▼ -5.00%
- Median HH income
- $42,108
- Composite
- 10.08/100
- National rank
- #9805
- State rank
- #24 of 24 in MD
Livability — Baltimore
- Score
- 76/100
- State rank
- #90
- US rank
- #3396
Category grades
Schools grade is shown separately in the Schools card above.
Census & demographics
- Census place
- Baltimore, MD
- County
- Anne Arundel County · 535,653 people
- City population
- 588,727
- Metro
- Baltimore-Columbia-Towson, MD
- Population (ZIP)
- 34,062
- Household income
- $54,020
- Rent vs Own
- Severe rent burden
- 1440.0
Population outlook (Baltimore County) Hauer SSP2
- Today (2025)
- 624,249 people
- By 2030
- 621,541 · -0.4%
- By 2040
- 609,756 · -2.3%
- By 2050
- 597,249 · -4.3%
- By 2075
- 552,236 · -11.5%
- By 2100
- 513,934 · -17.7%
Race, ethnicity, and origin ACS 2023
- Neighborhood character
- Diverse neighborhood (Simpson 0.68)
- Race & ethnicity
- Black 42% White 32% Hispanic / Latino 20% Two or more races 8% Native American 3% Asian 2%
- Hispanic origin (detail)
- Mexican 5% Puerto Rican 1%
- Common ancestry
- Romanian 2% Lithuanian 1% Iranian 1%
- Foreign-born
- 12% · Canada, China
- Languages at home
- 81% English-only · Spanish 16% Other Indo-European 1% French/Haitian/Cajun 1%
Political lean MEDSL · Baltimore
- 2024 margin
- Solid D (+73.0) · D 85.2% · R 12.2% · Other 2.6%
- 2008→2024 swing
- -2.5pp toward R · 2008: 75.5pp · 2024: 73.0pp
- All cycles
- 2024: D+73.0 2020: D+76.6 2016: D+74.6 2012: D+76.4 2008: D+75.5
Not yet ingested
- Civics
- —
Market trends
- HPI YoY
- ▼ -119.44%
- Current HPI
- 254.5089
- Rent YoY
- ▲ 4.08%
- Metro
- Baltimore-Columbia-Towson, MD
- State GDP YoY
- ▲ 2.97%
- F500 in state
- 12
Industry mix (Fortune 500 HQ in MD)
| Industry | F500 HQs | Revenue |
|---|---|---|
| Aerospace / Defense | 1 | $71B |
|
||
| Utilities | 1 | $25B |
|
||
| Hotels | 1 | $24B |
|
||
| Consumer Goods | 1 | $7B |
|
||
| Real Estate | 1 | $6B |
|
||
| Chemicals | 1 | $2B |
|
||
Price history
+193.1% since first listed13 events — show timeline
- 2026-05-22 Pending — BRIGHT MLS
- 2026-04-30 Listed $170,000 BRIGHT MLS
- 2026-04-24 Coming Soon $170,000 BRIGHT MLS
- 2026-03-31 Listing Removed — BRIGHT MLS
- 2026-02-14 Price Changed $179,900 BRIGHT MLS
- 2025-12-03 Listed $189,500 BRIGHT MLS
- 2025-10-16 Listing Removed — BRIGHT MLS
- 2025-09-26 Price Changed $190,500 BRIGHT MLS
- 2025-09-15 Price Changed $195,000 BRIGHT MLS
- 2025-08-04 Listed $200,000 BRIGHT MLS
- 2025-07-09 Coming Soon — BRIGHT MLS
- 2008-07-24 Sold (Public Records) $95,716 Public Records
- 1990-08-22 Sold (Public Records) $58,000 Public Records
Property tax history
-1.0%/yrLatest (2025): $1,289 · +11.2% YoY. Source: county tax records.
Cash-flow waterfall
monthlySold comps — $/sqft
last 12 mo · ≤1 miLoading sold comps…