76 E US Highway 6 #92 · Chesterton, IN
Flood risk 1/10 · Minimal
- FEMA flood zone
- X (unshaded)
- Chance of flooding over 30 yrs
- 0.0%
- Est. flood insurance / yr
- $507 – $1,088
Fire risk 4/10 · Minor
- Est. fire insurance / yr
- $717 – $1,331
Heat risk 2/10 · Minimal
- Hot days now (above 100°F)
- 7 days/yr
- Hot days in 30 yrs
- 15 days/yr
Wind risk 2/10 · Minimal
- Chance of severe wind over 30 yrs
- —
Air-quality risk 2/10 · Minimal
- Unhealthy air days now
- 1 days/yr
- Unhealthy air days in 30 yrs
- 2 days/yr
Risk factors via First Street. Map © Google.
Why this score? — see what drove the B grade
The composite is a weighted blend of 9 inputs, each scored 0–100. Each bar is that input's sub-score; the figure is the points it added to the 100-point composite (weight × sub-score).
- Cash flow +30.0/30.0
- 1% rule +10.0/10.0
- DSCR +10.0/10.0
- ARV discount +7.5/15.0
- Schools +4.7/10.0
- Livability +3.9/5.0
- Condition / age +3.8/5.0
- Rent growth +3.4/5.0
- Appreciation +0.0/10.0
$39,900
🖨 Deal sheet 📄 Offer letter ✓ Due diligence
Listing remarks MLS
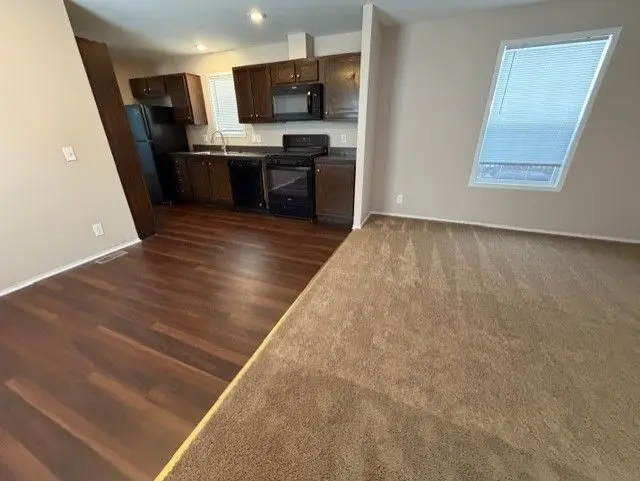
A well-maintained three-bedroom, two-bath manufactured home offering a functional layout and comfortable living space. The home features an open living area, a practical kitchen with ample storage, and a primary bedroom with attached bath. Additional bedrooms provide flexibility for a variety of uses. Outdoor space allows for relaxation or everyday activities. Conveniently located with access to nearby services, shopping, and transportation.
Key facts
- Open living area
- Practical kitchen
- Shopping
Tags
Neighborhood map
What this means for you Summary
Snapshot
- This is a 3-bed/2.0-bath manufactured listed at $40k. Condition is rated good.
Deal economics
- At list price, monthly cash flow is $930 ($11k/yr) — positive.
- The deal already cash-flows at list — no discount required.
- Meets the 1% rule at list price ($2k rent vs $40k).
- Recommended offer: $35k (12.0% below list) — sets the bar for market timing.
- Cap rate 34.3% vs local median 2.6% in Chesterton — top-decile yield for the area; either an underpriced asset or a hidden risk that comps aren't pricing in. Stress-test before assuming the spread holds.
Location & tenants
- Location reads 77/100 on livability (#43 in IN, #3,223 nationally) — a middle-class / working-renter tenant base. Strengths: crime A+, cost of living A+, housing A+; Watch: amenities F, commute F.
- Duneland School Corporation (suburban): math 53% / reading 53% proficiency, ranked #30 of 301 in IN (top 10%) — acceptable for families but not a draw, mixed tenant base, ~2y average lease.
- Market conditions: Rents rising (+3.5%/yr); 257 active listings in the ZIP; 1 comparable units currently listed for rent nearby; solid renter incomes; 542 units permitted in Porter County in 2024 (0 in 5+ unit buildings).
Forward outlook
- Local home prices are declining (-3.0%/yr); year-one equity from $276 of loan paydown is wiped out by about $1k of value loss. Plan a longer hold.
- Porter County population projected at +6% by 2050 — modest demand growth; plan on rents tracking national, not racing it.
- At projected returns (-3.0% appreciation + 3.5% rent growth), your $11k cash investment doubles in ~2 years — after that, you're playing with house money.
Negotiation context
- It's been on market 160 days — a 12% lower offer ($35k) is reasonable based on typical stale-listing flexibility.
- 2 sale attempts; this cycle's ask is 2925% above the opening price — seller raised mid-cycle; expect resistance to lowballs.
Questions for the listing agent
- It's been on market 160 days. Have you received any prior offers? Is the seller open to a 12% concession, seller financing, or rate buy-down credit?
- Why hasn't it sold? Are there any deal-killer items the seller is aware of (foundation, flood, title, zoning, code violations)?
- Is there a deadline driving the sale (1031 exchange, divorce, estate, relocation)? That informs how much negotiation room exists.
- Schools are B-rated — typically a magnet for longer-tenancy family renters. What's the average tenant stay here, and is there a school-zone premium baked into asking?
- What's the average days-on-market for RENTAL listings here right now (not sales)? A rising rental-DOM trend means longer vacancies and softer asking-rent achievability than the comps imply.
- What's the recent tenant-quality profile in this submarket — average credit score on applications, eviction rate, late-payment / NSF rate, and stable-employment percentage? A property-management company in the area should have these aggregated.
- How much new for-sale + rental construction is in the pipeline within 1–3 miles? Heavy new supply typically softens prices + rents 12–24 months out; constrained supply supports both.
Investment metrics
- 1% rule
- 3.82% ✓
- Cap rate
- 34.25%
- Cash-on-cash
- 99.85%
- DSCR
- 5.44
- GRM
- 2.2
CMA / ARV
No comps found within radius.
Projected returns pro-forma
-3.0% appreciation · 3.52% rent growth · sell at horizon
- IRR
- —
- Equity multiple
- 5.79×
- Total profit
- $53,569
- Equity at exit
- $5,949
- IRR
- —
- Equity multiple
- 12.31×
- Total profit
- $126,310
- Equity at exit
- $3,450
Cash invested: $11,172 (down + closing). Projections, not guarantees.
Landlord ↔ Tenant lean methodology
- Overall (STATE)
- 90 Strongly Landlord-Friendly
- State Indiana
- 90 Strongly Landlord-Friendly · R+11
- County
- — inherits STATE
- City
- — inherits STATE
ZIP-level market 46383
- Rents YoY
- 3.5%
- Active inventory
- 257
- Price-to-rent
- 2.2×
Monthly cashflow live
- Estimated rent
- $1,526 medium interval (Pro) →
- Mortgage (P&I)
- −$209
- Tax est. 1.5%
- −$50 /mo · $598/yr
- Insurance
- −$17
- HOA
- −$0
- Vacancy / Maint / Mgmt
- −$320
- Net cashflow
- $930
Break-even live
UW: 25.0% down · 7.5% · 30yr · 1.5% tax · 5.0% vac · 8.0% maint · 8.0% mgmt
Financing live
Cash to close
- Down payment
- $9,975
- Closing costs
- $1,197
- Reserves months
- —
- Total cash needed
- —
Loan-product check · same deal, 3 products live
Conventional
25% down · 7.5% · 30yr
- Down + closing
- —
- Monthly P&I
- —
- Monthly cashflow
- —
- DSCR
- —
- Eligible?
- —
Personal DTI + credit; lowest rate.
DSCR
20% down · 8.5% · 30yr
- Down + closing
- —
- Monthly P&I
- —
- Monthly cashflow
- —
- DSCR
- —
- Eligible?
- —
No personal income docs; deal must DSCR.
Hard money
10% down · 12.0% · 12mo
- Down + closing
- —
- Monthly P&I
- —
- Monthly cashflow
- —
- DSCR
- —
- Eligible?
- —
Short-term bridge; refi at stabilization.
Rent comps 1 comps
| Address | Beds | Baths | Sqft | Rent | $/sqft | DOM | Units | Dist |
|---|---|---|---|---|---|---|---|---|
| 810 Elmwood Park Dr Valparaiso, IN | 1.0–2.0 | 1.0–2.0 | 816 | $1,250 | $1.53 | 1d | 1 | 0.95mi |
Listing history 17 events
-
2026-06-18days on market $39,900 Active 160 DOM
-
2026-06-17days on market $39,900 Active 159 DOM
-
2026-06-16days on market $39,900 Active 158 DOM
-
2026-06-15days on market $39,900 Active 157 DOM
-
2026-06-13days on market $39,900 Active 155 DOM
-
2026-06-13days on market $39,900 Active 154 DOM
-
2026-06-09days on market $39,900 Active 151 DOM
-
2026-06-08days on market $39,900 Active 150 DOM
-
2026-06-07days on market $39,900 Active 149 DOM
-
2026-06-04days on market $39,900 Active 146 DOM
-
2026-06-03days on market $39,900 Active 145 DOM
-
2026-06-02days on market $39,900 Active 144 DOM
-
2026-06-01days on market $39,900 Active 143 DOM
-
2026-05-31days on market $39,900 Active 142 DOM
-
2026-03-29historical $1,319
-
2026-01-10$1,319
Show marketing remark (445 chars)
A well-maintained three-bedroom, two-bath manufactured home offering a functional layout and comfortable living space. The home features an open living area, a practical kitchen with ample storage, and a primary bedroom with attached bath. Additional bedrooms provide flexibility for a variety of uses. Outdoor space allows for relaxation or everyday activities. Conveniently located with access to nearby services, shopping, and transportation.
-
2026-01-10$39,900 Active 445-char remark
Show marketing remark (445 chars)
A well-maintained three-bedroom, two-bath manufactured home offering a functional layout and comfortable living space. The home features an open living area, a practical kitchen with ample storage, and a primary bedroom with attached bath. Additional bedrooms provide flexibility for a variety of uses. Outdoor space allows for relaxation or everyday activities. Conveniently located with access to nearby services, shopping, and transportation.
ⓘ Source: listings_history table (triggers on properties + properties_extension) + one-shot
backfill from property_details.listing_events for pre-trigger history.
Climate risk First Street
- Flood 1/10 Low FEMA zone X (unshaded) · 0% chance over 30 yrs
- Wildfire 4/10 Moderate
- Heat 2/10 Low 7 d/yr ≥100°F today · 15 d/yr by 30 yrs out
- Wind 2/10 Low
- Air quality 2/10 Low 1 unhealthy d/yr today · 2 by 30 yrs out
Nearby sold comps map
Loading sold comps map…
Walkable amenities ~0.75 mi
Loading nearby amenities…
Taxation est. · year 1
- Rental income
- $18,310
- − Mortgage interest
- −$2,235
- − Property taxes
- −$598
- − Insurance
- −$200
- − Repairs & maintenance
- −$1,465
- − Management
- −$1,465
- − Depreciation
- −$1,161
- Taxable income
- $11,186
- Est. tax owed @ 24.0%
- −$2,685
- After-tax cash flow
- $8,471/yr
For passive investors: Depreciation is non-cash, so a rental often shows a tax loss while cash-flowing — sheltering income. Rental losses are passive: they offset passive income freely, and up to $25,000/yr can offset ordinary (W-2) income if you actively participate and your MAGI is under $100k (phasing out to $0 by $150k); unused losses carry forward. On sale, claimed depreciation is recaptured at up to 25%, and gains may owe capital-gains tax (a 1031 exchange can defer both). Figures are a year-1 estimate at your 24.0% rate — not tax advice; consult a CPA.
Condition & rehab AI · 12 photos
This well-maintained three-bedroom, two-bath manufactured home offers a functional layout and comfortable living space. It is ready for minor cosmetic upgrades to enhance its resale and rental value.
Value-add opportunities
- Both Paint interior walls — Fresh paint can enhance the home's curb appeal and interior aesthetics.
- Both Replace carpets with hardwood flooring — Hardwood flooring is more durable and can increase the home's value for both resale and rental.
- Both Upgrade kitchen appliances — Modern appliances can attract more buyers and renters, increasing the home's value.
- Both Install new windows — New windows can improve energy efficiency and increase the home's value for both resale and rental.
Renovation cost estimate screening
Value-add ROI direction
- Both Paint interior walls — Fresh paint can enhance the home's curb appeal and interior aesthetics. ↑
- Both Replace carpets with hardwood flooring — Hardwood flooring is more durable and can increase the home's value for both resale and rental. ↑
- Both Upgrade kitchen appliances — Modern appliances can attract more buyers and renters, increasing the home's value. ↑
- Both Install new windows — New windows can improve energy efficiency and increase the home's value for both resale and rental. ↑
ⓘ Cost ranges are severity-bucket heuristics (US national rule-of-thumb). Get contractor quotes + a written scope before underwriting a rehab budget.
Schools (NCES district)
- District
- Duneland School Corporation
- NCES district ID
- 1802800
- Math proficiency
- 53% ▼ -4.00%
- Reading proficiency
- 53% ▼ -1.00%
- Median HH income
- $70,498
- Composite
- 47.24/100
- National rank
- #2310
- State rank
- #30 of 301 in IN
Livability — Chesterton
- Score
- 77/100
- State rank
- #43
- US rank
- #3223
Category grades
Schools grade is shown separately in the Schools card above.
Census & demographics
- County
- Porter County · 151,647 people
- City population
- 28,307
- Metro
- Chicago-Naperville-Elgin, IL-IN-WI
- Population (ZIP)
- 42,183
- Household income
- $76,224
- Rent vs Own
- Severe rent burden
- 1478.0
Population outlook (Porter County) Hauer SSP2
- Today (2025)
- 177,804 people
- By 2030
- 181,552 · +2.1%
- By 2040
- 185,830 · +4.5%
- By 2050
- 187,498 · +5.5%
- By 2075
- 189,585 · +6.6%
- By 2100
- 183,722 · +3.3%
Race, ethnicity, and origin ACS 2023
- Neighborhood character
- Predominantly White (84%)
- Race & ethnicity
- White 84% Hispanic / Latino 9% Two or more races 6% Black 2% Asian 1%
- Hispanic origin (detail)
- Mexican 6%
- Common ancestry
- Romanian 9% Lithuanian 3% Slovak 3%
- Foreign-born
- 4% · Canada
- Languages at home
- 95% English-only · Spanish 3%
Political lean MEDSL · Porter
- 2024 margin
- R (+10.5) · D 43.8% · R 54.3% · Other 1.8%
- 2008→2024 swing
- -17.7pp toward R · 2008: 7.2pp · 2024: -10.5pp
- All cycles
- 2024: R+10.5 2020: R+6.1 2016: R+6.8 2012: D+3.8 2008: D+7.2
Not yet ingested
- Civics
- —
Market trends
- HPI YoY
- ▼ -151.84%
- Current HPI
- 197.9925
- Rent YoY
- ▲ 3.52%
- Metro
- Chicago-Naperville-Elgin, IL-IN-WI
- State GDP YoY
- ▲ 2.90%
- F500 in state
- 18
Industry mix (Fortune 500 HQ in IN)
| Industry | F500 HQs | Revenue |
|---|---|---|
| Industrial Machinery | 2 | $37B |
|
||
| Healthcare | 1 | $177B |
|
||
| Pharmaceuticals | 1 | $45B |
|
||
| Metals / Steel | 1 | $18B |
|
||
| Agriculture | 1 | $17B |
|
||
| Packaging | 1 | $12B |
|
||
Price history
-96.7% since first listed3 events — show timeline
- 2026-03-29 Rental Removed $1,319 ZUMPER1
- 2026-01-10 Listed for Rent $1,319 ZUMPER1
- 2026-01-10 Listed $39,900 Zillow
Cash-flow waterfall
monthlySold comps — $/sqft
last 12 mo · ≤1 miLoading sold comps…