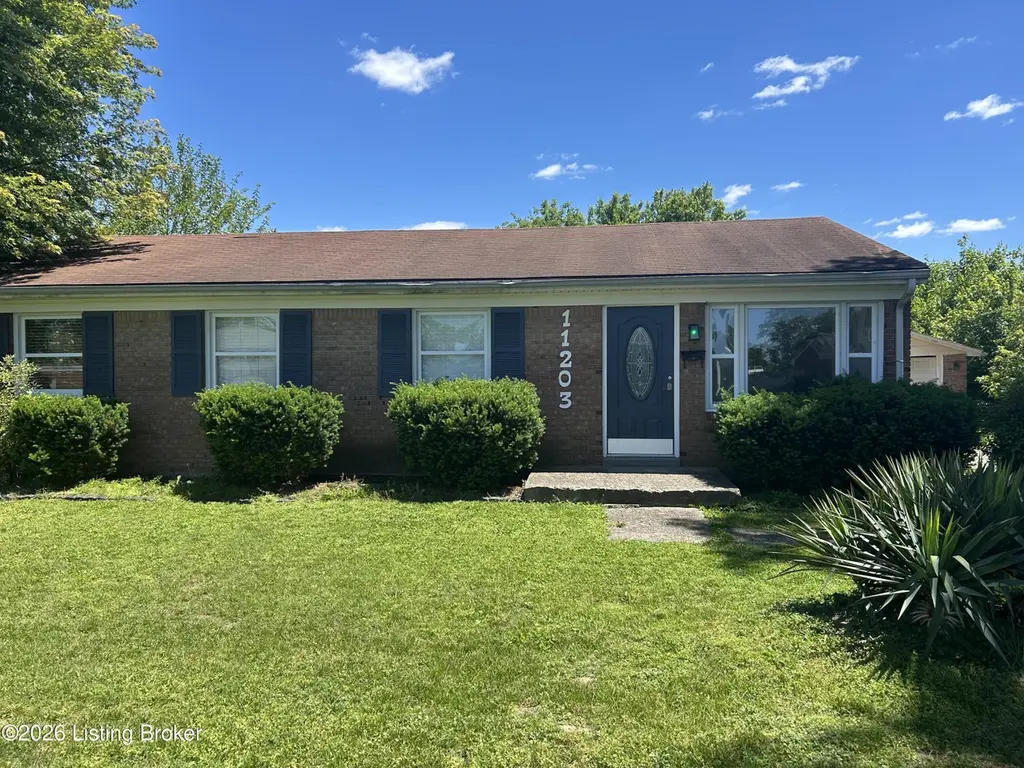
11203 Thunder Dr · Louisville/Jefferson County metro government (balance), KY
Flood risk 1/10 · Minimal
- FEMA flood zone
- X (shaded)
- Chance of flooding over 30 yrs
- 0.0%
- Est. flood insurance / yr
- $507 – $1,088
Fire risk 2/10 · Minimal
- Est. fire insurance / yr
- $839 – $1,559
Heat risk 5/10 · Moderate
- Hot days now (above 104°F)
- 7 days/yr
- Hot days in 30 yrs
- 19 days/yr
Wind risk 2/10 · Minimal
- Chance of severe wind over 30 yrs
- 3.0%
Air-quality risk 3/10 · Minor
- Unhealthy air days now
- 2 days/yr
- Unhealthy air days in 30 yrs
- 3 days/yr
Risk factors via First Street. Map © Google.
Why this score? — see what drove the C grade
The composite is a weighted blend of 9 inputs, each scored 0–100. Each bar is that input's sub-score; the figure is the points it added to the 100-point composite (weight × sub-score).
- Cash flow +21.2/30.0
- ARV discount +15.0/15.0
- DSCR +6.8/10.0
- 1% rule +5.0/10.0
- Rent growth +3.0/5.0
- Livability +2.5/5.0
- Condition / age +2.5/5.0
- Schools +2.3/10.0
- Appreciation +0.0/10.0
$159,900
🖨 Deal sheet 📄 Offer letter ✓ Due diligence
Listing remarks MLS
Great opportunity to add some sweat equity to your home. This 4 bedroom 1.5 bath ranch needs some work but the payoff will be worth it. House has replacement windows and full bathroom has been updated since ownership. Hvac is newer and the water heater is 2 years old. There's a 2 car detached garage out back. Yard is fully fenced. Call with any questions.
Key facts
- Brick ranch home
- 9,309 sq ft lot
- 2 garage spots
Tags
Property features AI
Finance
- Other: Subdivision: THUNDERBIRD MANOR
- HOA & community: No association fee; no monthly maintenance
Exterior
- Parking: Detached garage (2 car) and driveway parking
- Utilities: Electricity connected; Natural gas
- Home design: Single-family ranch-style home; One story
- Construction: Built in 1971; Wood frame and brick construction; Shingle roof; Crawl space foundation
- Exterior features: Level lot; Chain link fencing
Interior
- Kitchen: Kitchen located on the first floor
- Bedrooms: Four bedrooms, all on the first floor; Primary bedroom on the first floor
- Bathrooms: One full bathroom on the first floor; One half bathroom on the first floor
- Heating & cooling: Forced air heating (natural gas); Central air conditioning
- Interior features: Seven total rooms; Living room on the first floor; No basement
- Laundry & utility: First-floor laundry
Neighborhood map
What this means for you Summary
Snapshot
- This is a 4-bed/1.5-bath single-family listed at $160k.
Deal economics
- At list price, monthly cash flow is $231 ($3k/yr) — positive.
- The deal already cash-flows at list — no discount required.
- Meets the 1% rule at list price ($2k rent vs $160k).
- Cap rate 8.0% vs local median 4.0% in Louisville/Jefferson County metro government (balance) — top-decile yield for the area; either an underpriced asset or a hidden risk that comps aren't pricing in. Stress-test before assuming the spread holds.
Location & tenants
- Location reads: area grade C — affects rentability + tenant quality, not the cash-flow math above.
- Jefferson County (urban): math 19% / reading 35% proficiency, ranked #121 of 165 in KY (top 73%) — low school quality limits family demand, transient renter base, plan for 1-2y turnover.
- Market conditions: Rents rising (+2.1%/yr); 218 active listings in the ZIP; 11 comparable units currently listed for rent nearby; rentals at typical pace (median 16d on market — plan ~3-4 weeks tenant-placement turnaround); 2,836 units permitted in Jefferson County in 2024 (1,558 in 5+ unit buildings).
Forward outlook
- Local home prices are declining (-3.0%/yr); year-one equity from $1k of loan paydown is wiped out by about $5k of value loss. Plan a longer hold.
- Jefferson County population projected at +13% by 2050 — modest demand growth; plan on rents tracking national, not racing it.
Negotiation context
- Only 2 days on market — expect competitive offers; lowballing is unlikely to land.
- 2 sale attempts since 6y ago with the ask held roughly flat each time — persistent listings suggest the price (not the market) is what's stuck; bring a comps-based counter.
- Current owner paid $100k; list at $160k implies a 60% gain — meaningful room to come down on a strong offer.
Risks & watch-outs
- Climate carrying-cost: extreme-heat days projected 7→19/yr by 2055 (HVAC capex compounding) — expect insurance premiums to compound above CPI over the hold.
Questions for the listing agent
- Built in 1971 — when were the roof, HVAC, electrical panel, plumbing, and water heater last replaced?
- Is there a deadline driving the sale (1031 exchange, divorce, estate, relocation)? That informs how much negotiation room exists.
- What's the average days-on-market for RENTAL listings here right now (not sales)? A rising rental-DOM trend means longer vacancies and softer asking-rent achievability than the comps imply.
- What's the recent tenant-quality profile in this submarket — average credit score on applications, eviction rate, late-payment / NSF rate, and stable-employment percentage? A property-management company in the area should have these aggregated.
- How much new for-sale + rental construction is in the pipeline within 1–3 miles? Heavy new supply typically softens prices + rents 12–24 months out; constrained supply supports both.
Investment metrics
- 1% rule
- 1.00% ✓
- Cap rate
- 8.02%
- Cash-on-cash
- 6.18%
- DSCR
- 1.28
- GRM
- 8.3
CMA / ARV
- ARV (on-the-fly)
- $215,250
- Comps found
- 12
Show comp detail 12 sales within ~0.75 mi
| Address | Dist | Beds/Ba | Sqft | Sold | Price | $/sf | Match |
|---|---|---|---|---|---|---|---|
| 11203 Thunder Dr | 0.00mi | 4/1.5 | 1,050 (0%) | 0mo | $155,000 | $148 | 100 |
| 11108 Albion Dr | 0.10mi | 3/1.0 (-1) | 1,000 (-5%) | 12mo | $210,000 | $210 | 70 |
| 5409 Chestnutwood Way | 0.58mi | 3/1.0 (-1) | 1,050 (0%) | 2mo | $214,000 | $204 | 64 |
| 5413 Alicante Ln | 0.53mi | 3/1.0 (-1) | 1,025 (-2%) | 2mo | $203,000 | $198 | 62 |
| 5402 Anatahan Ct | 0.70mi | 3/1.0 (-1) | 1,050 (0%) | 3mo | $142,000 | $135 | 58 |
| 11100 Albion Dr | 0.14mi | 3/1.0 (-1) | 925 (-12%) | 11mo | $215,000 | $232 | 58 |
| 9614 Blaze Way | 0.71mi | 3/1.0 (-1) | 1,025 (-2%) | 2mo | $210,000 | $205 | 54 |
| 11003 Thunder Dr | 0.30mi | 3/1.0 (-1) | 1,187 (+13%) | 10mo | $175,000 | $147 | 49 |
| 5500 Deering Heights Dr | 0.39mi | 3/1.0 (-1) | 1,161 (+11%) | 10mo | $195,000 | $168 | 48 |
| 5713 Chestnutwood Way | 0.48mi | 3/1.0 (-1) | 950 (-10%) | 9mo | $210,000 | $221 | 47 |
| 10812 Milwaukee Way | 0.66mi | 3/1.0 (-1) | 956 (-9%) | 5mo | $208,000 | $218 | 43 |
| 11806 Mondamon Dr | 0.75mi | 3/1.0 (-1) | 925 (-12%) | 6mo | $200,000 | $216 | 33 |
Match score weights: distance 35% · size 25% · config 20% · recency 20%. Top-matched comps best support the ARV.
Projected returns pro-forma
-3.0% appreciation · 2.07% rent growth · sell at horizon
- IRR
- -7.8%
- Equity multiple
- 0.72×
- Total profit
- $-12,725
- Equity at exit
- $23,842
- IRR
- 0.6%
- Equity multiple
- 1.04×
- Total profit
- $1,776
- Equity at exit
- $13,825
Cash invested: $44,772 (down + closing). Projections, not guarantees.
Landlord ↔ Tenant lean methodology
- Overall (STATE)
- 83 Strongly Landlord-Friendly
- State Kentucky
- 83 Strongly Landlord-Friendly · R+16
- County
- — inherits STATE
- City
- — inherits STATE
ZIP-level market 40272
- Rents YoY
- 2.1%
- Active inventory
- 218
- Price-to-rent
- 8.3×
Monthly cashflow live
- Estimated rent
- $1,603 high interval (Pro) →
- Mortgage (P&I)
- −$839
- Tax from tax record
- −$131 /mo · $1,568/yr
- Insurance
- −$67
- HOA
- −$0
- Vacancy / Maint / Mgmt
- −$337
- Net cashflow
- $231
Break-even live
UW: 25.0% down · 7.5% · 30yr · 1.5% tax · 5.0% vac · 8.0% maint · 8.0% mgmt
Financing live
Cash to close
- Down payment
- $39,975
- Closing costs
- $4,797
- Reserves months
- —
- Total cash needed
- —
Loan-product check · same deal, 3 products live
Conventional
25% down · 7.5% · 30yr
- Down + closing
- —
- Monthly P&I
- —
- Monthly cashflow
- —
- DSCR
- —
- Eligible?
- —
Personal DTI + credit; lowest rate.
DSCR
20% down · 8.5% · 30yr
- Down + closing
- —
- Monthly P&I
- —
- Monthly cashflow
- —
- DSCR
- —
- Eligible?
- —
No personal income docs; deal must DSCR.
Hard money
10% down · 12.0% · 12mo
- Down + closing
- —
- Monthly P&I
- —
- Monthly cashflow
- —
- DSCR
- —
- Eligible?
- —
Short-term bridge; refi at stabilization.
Rent comps 11 comps
| Address | Beds | Baths | Sqft | Rent | $/sqft | DOM | Units | Dist |
|---|---|---|---|---|---|---|---|---|
| 5321 Juanita Ln Louisville, KY | 3.0 | 1.0 | 1417 | $1,499 | $1.06 | 23d | 1 | 0.46mi |
| 5321 Juanita Ln Louisville, KY | 4.0 | 1.0 | 1500 | $1,499 | $1.00 | 16d | 1 | 0.46mi |
| 11711 Wiltonwood Ct Louisville, KY | 3.0 | 1.0 | 1200 | $1,459 | $1.22 | 11d | 1 | 0.68mi |
| 11206 Willowick Ct Louisville, KY | 3.0 | 1.0 | 1130 | $1,300 | $1.15 | 16d | 1 | 0.78mi |
| 10818 Grafton Hall Rd Louisville, KY | 3.0 | 1.0 | 1000 | $1,195 | $1.20 | 16d | 1 | 0.82mi |
| 5402 Logwood Ave Louisville, KY | 3.0 | 1.0 | 950 | $1,375 | $1.45 | 11d | 1 | 0.86mi |
| 4611 Flushing Way Louisville, KY | 3.0 | 1.0 | 925 | $1,430 | $1.55 | 23d | 1 | 1.21mi |
| 10200 Renaissance Valley Way Louisville, KY | 1.0–3.0 | 1.0–2.0 | 1102 | $1,904 | $1.73 | 1d | 29 | 1.24mi |
| 6001 Reigh Count Dr Louisville, KY | 3.0 | 1.0 | 1100 | $1,605 | $1.46 | 19d | 1 | 1.30mi |
| 12306 Glengrove Cir Louisville, KY | 2.0–3.0 | 1.0–2.0 | 1215 | $1,976 | $1.63 | 1d | 36 | 1.35mi |
| 9905 Ponder Ln Louisville, KY | 3.0 | 1.0 | 1293 | $1,555 | $1.20 | 16d | 1 | 1.38mi |
Listing history 6 events
-
2026-05-16status Pending
-
2026-05-14$159,900 Active
-
2020-04-27soldstatus $100,000
-
2020-04-23soldstatus $100,000 Closed 357-char remark
Show marketing remark (357 chars)
Great opportunity to add some sweat equity to your home. This 4 bedroom 1.5 bath ranch needs some work but the payoff will be worth it. House has replacement windows and full bathroom has been updated since ownership. Hvac is newer and the water heater is 2 years old. There's a 2 car detached garage out back. Yard is fully fenced. Call with any questions.
-
2020-03-31status Pending 357-char remark
Show marketing remark (357 chars)
Great opportunity to add some sweat equity to your home. This 4 bedroom 1.5 bath ranch needs some work but the payoff will be worth it. House has replacement windows and full bathroom has been updated since ownership. Hvac is newer and the water heater is 2 years old. There's a 2 car detached garage out back. Yard is fully fenced. Call with any questions.
-
2020-03-23$110,000 Active 357-char remark
Show marketing remark (357 chars)
Great opportunity to add some sweat equity to your home. This 4 bedroom 1.5 bath ranch needs some work but the payoff will be worth it. House has replacement windows and full bathroom has been updated since ownership. Hvac is newer and the water heater is 2 years old. There's a 2 car detached garage out back. Yard is fully fenced. Call with any questions.
ⓘ Source: listings_history table (triggers on properties + properties_extension) + one-shot
backfill from property_details.listing_events for pre-trigger history.
Tax reassessment forecast KY · Resets to sale price
- Current annual tax
- $1,568 · $131/mo
- Projected year-2 tax
- $1,568 · $131/mo
- Expected delta
- $0/yr ($0/mo · 0.0%)
ⓘ Screening estimate from a state-policy table — verify with the county assessor before closing.
Climate risk First Street
- Flood 1/10 Low FEMA zone X (shaded) · 0% chance over 30 yrs
- Wildfire 2/10 Low
- Heat 5/10 Major 7 d/yr ≥104°F today · 19 d/yr by 30 yrs out
- Wind 2/10 Low 3% chance of damaging wind over 30 yrs
- Air quality 3/10 Moderate 2 unhealthy d/yr today · 3 by 30 yrs out
Nearby sold comps map
Loading sold comps map…
Walkable amenities ~0.75 mi
Loading nearby amenities…
Taxation est. · year 1
- Rental income
- $19,238
- − Mortgage interest
- −$8,957
- − Property taxes
- −$1,568
- − Insurance
- −$800
- − Repairs & maintenance
- −$1,539
- − Management
- −$1,539
- − Depreciation
- −$4,652
- Taxable income
- $184
- Est. tax owed @ 24.0%
- −$44
- After-tax cash flow
- $2,724/yr
For passive investors: Depreciation is non-cash, so a rental often shows a tax loss while cash-flowing — sheltering income. Rental losses are passive: they offset passive income freely, and up to $25,000/yr can offset ordinary (W-2) income if you actively participate and your MAGI is under $100k (phasing out to $0 by $150k); unused losses carry forward. On sale, claimed depreciation is recaptured at up to 25%, and gains may owe capital-gains tax (a 1031 exchange can defer both). Figures are a year-1 estimate at your 24.0% rate — not tax advice; consult a CPA.
Schools (NCES district)
- District
- Jefferson County
- NCES district ID
- 2102990
- Math proficiency
- 19% ▼ -17.00%
- Reading proficiency
- 35% ▼ -11.00%
- Median HH income
- $47,885
- Composite
- 23.45/100
- National rank
- #7884
- State rank
- #121 of 165 in KY
Livability — Louisville/Jefferson County metro government (balance)
No livability data for this city. (Only ~50 U.S. cities are tracked.)
Census & demographics
- Census place
- Louisville/Jefferson County metro government (balance), KY
- County
- Jefferson County · 790,184 people
- City population
- 419,741
- Metro
- Louisville/Jefferson County, KY-IN
- Population (ZIP)
- 38,289
- Household income
- $69,940
- Rent vs Own
- Severe rent burden
- 702.0
Population outlook (Jefferson County) Hauer SSP2
- Today (2025)
- 823,112 people
- By 2030
- 849,343 · +3.2%
- By 2040
- 895,696 · +8.8%
- By 2050
- 933,630 · +13.4%
- By 2075
- 1,028,262 · +24.9%
- By 2100
- 1,072,675 · +30.3%
Race, ethnicity, and origin ACS 2023
- Neighborhood character
- Predominantly White (77%)
- Race & ethnicity
- White 77% Black 9% Hispanic / Latino 9% Two or more races 9%
- Hispanic origin (detail)
- Mexican 3% Cuban 3%
- Common ancestry
- Slovak 2% Lithuanian 1% Italian 1%
- Foreign-born
- 6% · Canada
- Languages at home
- 92% English-only · Spanish 7%
Political lean MEDSL · Jefferson
- 2024 margin
- D (+16.6) · D 57.4% · R 40.9% · Other 1.7%
- 2008→2024 swing
- +4.5pp toward D · 2008: 12.0pp · 2024: 16.6pp
- All cycles
- 2024: D+16.6 2020: D+20.1 2016: D+13.3 2012: D+11.1 2008: D+12.0
Not yet ingested
- Civics
- —
Market trends
- HPI YoY
- ▼ -262.10%
- Current HPI
- 247.2954
- Rent YoY
- ▲ 2.07%
- Metro
- Louisville/Jefferson County, KY-IN
- State GDP YoY
- ▲ 1.81%
- F500 in state
- 4
Industry mix (Fortune 500 HQ in KY)
| Industry | F500 HQs | Revenue |
|---|---|---|
| Healthcare | 1 | $118B |
|
||
| Food / Beverage | 1 | $7B |
|
||
Price history
+45.4% since first listed6 events — show timeline
- 2026-05-16 Pending — Metro Search MLS
- 2026-05-14 Listed $159,900 Metro Search MLS
- 2020-04-27 Sold (Public Records) $100,000 Public Records
- 2020-04-23 Sold (MLS) $100,000 Metro Search MLS
- 2020-03-31 Pending — Metro Search MLS
- 2020-03-23 Listed $110,000 Metro Search MLS
Property tax history
+5.4%/yrLatest (2025): $1,568 · +34.6% YoY. Source: county tax records.
Cash-flow waterfall
monthlySold comps — $/sqft
last 12 mo · ≤1 miLoading sold comps…