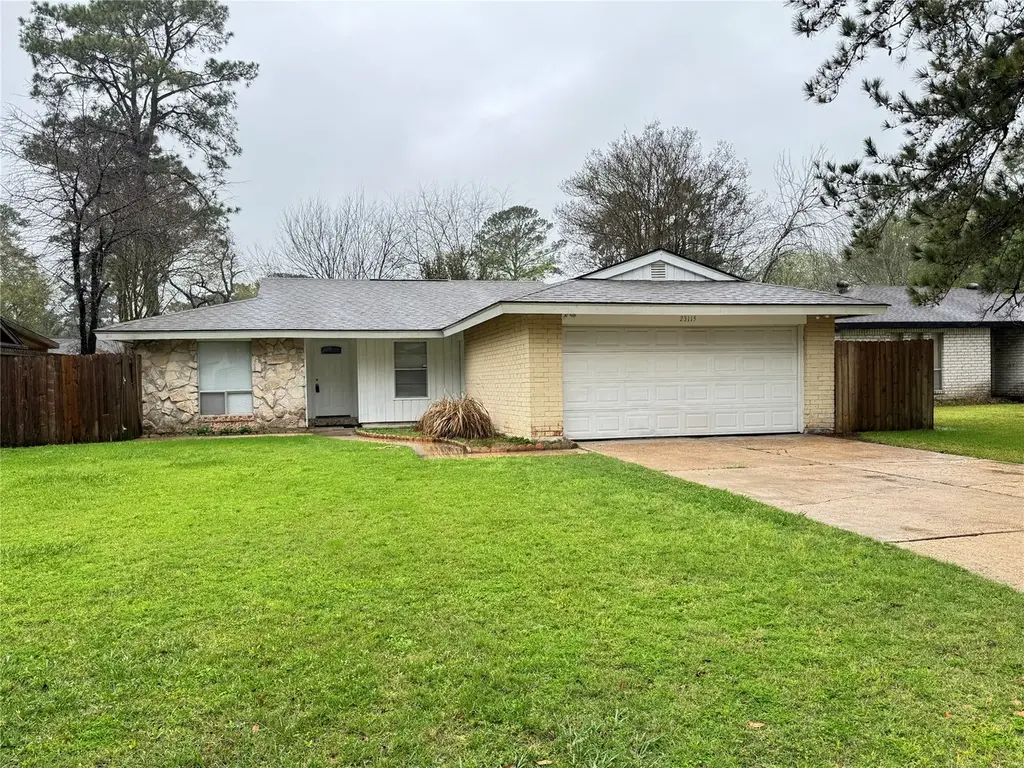
23115 Ludgate Dr · Spring, TX
Flood risk 5/10 · Moderate
- FEMA flood zone
- X (unshaded)
- Chance of flooding over 30 yrs
- 0.66%
- Est. flood insurance / yr
- $507 – $1,088
Fire risk 2/10 · Minimal
- Est. fire insurance / yr
- $1,222 – $2,270
Heat risk 8/10 · Major
- Hot days now (above 110°F)
- 7 days/yr
- Hot days in 30 yrs
- 23 days/yr
Wind risk 8/10 · Major
- Chance of severe wind over 30 yrs
- 99.0%
Air-quality risk 3/10 · Minor
- Unhealthy air days now
- 3 days/yr
- Unhealthy air days in 30 yrs
- 3 days/yr
Risk factors via First Street. Map © Google.
Why this score? — see what drove the C- grade
The composite is a weighted blend of 9 inputs, each scored 0–100. Each bar is that input's sub-score; the figure is the points it added to the 100-point composite (weight × sub-score).
- Cash flow +20.4/30.0
- ARV discount +9.6/15.0
- 1% rule +6.9/10.0
- DSCR +6.5/10.0
- Livability +3.3/5.0
- Condition / age +2.5/5.0
- Rent growth +2.4/5.0
- Schools +2.0/10.0
- Appreciation +0.0/10.0
$189,900
🖨 Deal sheet (PDF) 📄 Offer letter ✓ Due diligence
Listing remarks MLS
Welcome home! Quaint three bedroom two bath house in Fairfax. Districted to Spring ISD schools. Low taxes rate, low HOA fees. Laminate and tile flooring throughout, no carpet! Roof is less than 8 months old. Call your Realtor to schedule a private showing TODAY!!
Key facts
- Low hoa fees
- Spring isd schools
- Low taxes rate
Tags
Neighborhood map
What this means for you Summary
Snapshot
- This is a 3-bed/2.0-bath single-family listed at $190k.
Deal economics
- At list price, monthly cash flow is $246 ($3k/yr) — positive.
- The deal already cash-flows at list — no discount required.
- Meets the 1% rule at list price ($2k rent vs $190k).
- Recommended offer: $179k (6.0% below list) — sets the bar for market timing.
- Cap rate 7.8% vs local median 4.5% in Spring — top-decile yield for the area; either an underpriced asset or a hidden risk that comps aren't pricing in. Stress-test before assuming the spread holds.
Location & tenants
- Location reads 66/100 on livability (#635 in TX) — a middle-class / working-renter tenant base. Strengths: cost of living A+, housing A+, employment B; Watch: schools C-, crime D, amenities F.
- Spring ISD (suburban): math 19% / reading 26% proficiency, ranked #730 of 826 in TX (top 88%) — low school quality limits family demand, transient renter base, plan for 1-2y turnover; 66% free/reduced lunch — lower-income household profile, screen leases tightly.
- Market conditions: Rents soft (-0.3%/yr); 595 active listings in the ZIP; solid renter incomes; 29,883 units permitted in Harris County in 2024 (8,621 in 5+ unit buildings).
- This rent runs 31% of the median local income ($89k/yr) — at the standard rent-burdened threshold; future hikes will face affordability resistance.
Forward outlook
- Local home prices are declining (-3.0%/yr); year-one equity from $1k of loan paydown is wiped out by about $6k of value loss. Plan a longer hold.
- Harris County population projected at +47% by 2050 — long-run rental-demand tailwind backs the buy-and-hold thesis.
Negotiation context
- It's been on market 83 days — a 6% lower offer ($179k) is reasonable based on typical stale-listing flexibility.
- 5 sale attempts since 20y ago; this cycle's ask is 11409% above the opening price — seller raised mid-cycle; expect resistance to lowballs.
- Current owner paid $55k; list at $190k implies a 245% gain — meaningful room to come down on a strong offer.
Risks & watch-outs
- Watch-outs: property tax is 2.7% of price.
- Climate carrying-cost: moderate flood risk; severe wind risk, 99% chance of damaging wind over 30y; extreme-heat days projected 7→23/yr by 2055 (HVAC capex compounding) — expect insurance premiums to compound above CPI over the hold.
Questions for the listing agent
- It's been on market 83 days. Have you received any prior offers? Is the seller open to a 6% concession, seller financing, or rate buy-down credit?
- Built in 1973 — when were the roof, HVAC, electrical panel, plumbing, and water heater last replaced?
- Property tax is high relative to price — has the assessment been appealed recently, and will the sale trigger a re-assessment?
- What does the HOA fee cover, when was the last increase, and are there any pending special assessments or reserve-fund shortfalls?
- Why hasn't it sold? Are there any deal-killer items the seller is aware of (foundation, flood, title, zoning, code violations)?
- Is there a deadline driving the sale (1031 exchange, divorce, estate, relocation)? That informs how much negotiation room exists.
- Crime grade is D in this area — have there been break-ins, vandalism, or insurance claims at this property in the last 3 years? What carrier currently insures it and at what premium?
- What's the average days-on-market for RENTAL listings here right now (not sales)? A rising rental-DOM trend means longer vacancies and softer asking-rent achievability than the comps imply.
- What's the recent tenant-quality profile in this submarket — average credit score on applications, eviction rate, late-payment / NSF rate, and stable-employment percentage? A property-management company in the area should have these aggregated.
- How much new for-sale + rental construction is in the pipeline within 1–3 miles? Heavy new supply typically softens prices + rents 12–24 months out; constrained supply supports both.
Investment metrics
- 1% rule
- 1.19% ✓
- Cap rate
- 7.85%
- Cash-on-cash
- 5.55%
- DSCR
- 1.25
- GRM
- 7.0
CMA / ARV
- ARV (median comp)
- $198,985
- List price
- $189,900
- Delta
- -4.57%
- Verdict
- FAIR
- Comps
- 20 within 1.0 mi
Show comp detail 12 sales within ~0.75 mi
| Address | Dist | Beds/Ba | Sqft | Sold | Price | $/sf | Match |
|---|---|---|---|---|---|---|---|
| 23110 Ludgate Dr | 0.03mi | 3/2.0 | 1,474 (0%) | 13mo | $220,000 | $149 | 87 |
| 4555 Algernon Dr | 0.23mi | 3/2.0 | 1,360 (-8%) | 16mo | $205,000 | $151 | 63 |
| 4015 Donalbain Dr | 0.45mi | 3/2.0 | 1,322 (-10%) | 0mo | $168,000 | $127 | 62 |
| 3902 Adonis Dr | 0.57mi | 3/2.0 | 1,462 (-1%) | 13mo | $229,000 | $157 | 61 |
| 23207 Naples Dr | 0.28mi | 4/2.0 (+1) | 1,558 (+6%) | 16mo | $165,000 | $106 | 59 |
| 23114 Goodfellow Dr | 0.60mi | 3/2.0 | 1,541 (+4%) | 7mo | $210,000 | $136 | 59 |
| 4106 Donalbain Dr | 0.43mi | 3/2.0 | 1,353 (-8%) | 14mo | $239,999 | $177 | 55 |
| 23303 Whittaker Way | 0.57mi | 2/2.0 (-1) | 1,354 (-8%) | 12mo | $192,500 | $142 | 45 |
| 4211 Hirschfield Rd | 0.46mi | 4/2.0 (+1) | 1,686 (+14%) | 8mo | $199,000 | $118 | 43 |
| 4214 Chestergate Dr | 0.62mi | 3/2.0 | 1,637 (+11%) | 13mo | $199,990 | $122 | 41 |
| 23142 Calico Corners Ln | 0.70mi | 3/2.0 | 1,599 (+8%) | 19mo | $179,000 | $112 | 37 |
| 4515 Hickorygate Dr | 0.74mi | 3/2.0 | 1,258 (-15%) | 16mo | $224,900 | $179 | 28 |
Match score weights: distance 35% · size 25% · config 20% · recency 20%. Top-matched comps best support the ARV.
Projected returns pro-forma
-3.0% appreciation · 0.0% rent growth · sell at horizon
- IRR
- -11.6%
- Equity multiple
- 0.59×
- Total profit
- $-21,556
- Equity at exit
- $28,315
- IRR
- -8.4%
- Equity multiple
- 0.56×
- Total profit
- $-23,496
- Equity at exit
- $16,419
Cash invested: $53,172 (down + closing). Projections, not guarantees.
Landlord ↔ Tenant lean methodology
- Overall (STATE)
- 87 Strongly Landlord-Friendly
- State Texas
- 87 Strongly Landlord-Friendly · R+5
- County
- — inherits STATE
- City
- — inherits STATE
ZIP-level market 77373
- Rents YoY
- -0.3%
- Active inventory
- 595
- Price-to-rent
- 7.0×
Monthly cashflow live
- Estimated rent
- $2,261 medium interval (Pro) →
- Mortgage (P&I)
- −$996
- Tax from tax record
- −$434 /mo · $5,212/yr
- Insurance
- −$79
- HOA
- −$31
- Vacancy / Maint / Mgmt
- −$475
- Net cashflow
- $246
Break-even live
Sensitivity live
| Price | -10% $354 | -5% $300 | +0% $246 | +5% $192 | +10% $139 |
|---|---|---|---|---|---|
| Rent | -10% $67 | -5% $157 | +0% $246 | +5% $335 | +10% $425 |
| Rate | -1.0pp $342 | -0.5pp $294 | base $246 | +0.5pp $197 | +1.0pp $147 |
UW: 25.0% down · 7.5% · 30yr · 1.5% tax · 5.0% vac · 8.0% maint · 8.0% mgmt
Financing live
Cash to close
- Down payment
- $47,475
- Closing costs
- $5,697
- Reserves months
- —
- Total cash needed
- —
Loan-product check · same deal, 3 products live
Conventional
25% down · 7.5% · 30yr
- Down + closing
- —
- Monthly P&I
- —
- Monthly cashflow
- —
- DSCR
- —
- Eligible?
- —
Personal DTI + credit; lowest rate.
DSCR
20% down · 8.5% · 30yr
- Down + closing
- —
- Monthly P&I
- —
- Monthly cashflow
- —
- DSCR
- —
- Eligible?
- —
No personal income docs; deal must DSCR.
Hard money
10% down · 12.0% · 12mo
- Down + closing
- —
- Monthly P&I
- —
- Monthly cashflow
- —
- DSCR
- —
- Eligible?
- —
Short-term bridge; refi at stabilization.
HOA detail
- Monthly dues
- $31 · $372/yr
Listing history 17 events
-
2026-06-09days on market $189,900 Pending 83 DOM
-
2026-06-08days on market $189,900 Pending 82 DOM
-
2026-06-07statusdays on market $189,900 Pending 81 DOM
-
2026-06-04days on market $189,900 Active 78 DOM
-
2026-06-03days on market $189,900 Active 77 DOM
-
2026-06-02days on market $189,900 Active 76 DOM
-
2026-06-02statusdays on market $189,900 Active 75 DOM
-
2026-04-20price $189,900 263-char remark
Show marketing remark (263 chars)
Welcome home! Quaint three bedroom two bath house in Fairfax. Districted to Spring ISD schools. Low taxes rate, low HOA fees. Laminate and tile flooring throughout, no carpet! Roof is less than 8 months old. Call your Realtor to schedule a private showing TODAY!!
-
2026-04-14$1,650
-
2026-03-08$180,000 Active 263-char remark
Show marketing remark (263 chars)
Welcome home! Quaint three bedroom two bath house in Fairfax. Districted to Spring ISD schools. Low taxes rate, low HOA fees. Laminate and tile flooring throughout, no carpet! Roof is less than 8 months old. Call your Realtor to schedule a private showing TODAY!!
-
2023-08-09historical $1,575
-
2023-08-02$1,575
-
2017-05-04historical
-
2017-04-24$140,000 Active
-
2007-01-16historical
-
2006-07-10$74,900
-
1991-01-25soldstatus $55,000
ⓘ Source: listings_history table (triggers on properties + properties_extension) + one-shot
backfill from property_details.listing_events for pre-trigger history.
Tax reassessment forecast TX · Resets to sale price
- Current annual tax
- $5,212 · $434/mo
- Projected year-2 tax
- $5,212 · $434/mo
- Expected delta
- $0/yr ($0/mo · 0.0%)
ⓘ Screening estimate from a state-policy table — verify with the county assessor before closing.
Climate risk First Street
- Flood 5/10 Major FEMA zone X (unshaded) · 66% chance over 30 yrs
- Wildfire 2/10 Low
- Heat 8/10 Severe 7 d/yr ≥110°F today · 23 d/yr by 30 yrs out
- Wind 8/10 Severe 99% chance of damaging wind over 30 yrs
- Air quality 3/10 Moderate 3 unhealthy d/yr today · 3 by 30 yrs out
Nearby sold comps map
Loading sold comps map…
Walkable amenities ~0.75 mi
Loading nearby amenities…
Taxation est. · year 1
- Rental income
- $27,134
- − Mortgage interest
- −$10,637
- − Property taxes
- −$5,212
- − Insurance
- −$950
- − Repairs & maintenance
- −$2,171
- − Management
- −$2,171
- − HOA
- −$372
- − Depreciation
- −$5,524
- Taxable income
- $97
- Est. tax owed @ 24.0%
- −$23
- After-tax cash flow
- $2,929/yr
For passive investors: Depreciation is non-cash, so a rental often shows a tax loss while cash-flowing — sheltering income. Rental losses are passive: they offset passive income freely, and up to $25,000/yr can offset ordinary (W-2) income if you actively participate and your MAGI is under $100k (phasing out to $0 by $150k); unused losses carry forward. On sale, claimed depreciation is recaptured at up to 25%, and gains may owe capital-gains tax (a 1031 exchange can defer both). Figures are a year-1 estimate at your 24.0% rate — not tax advice; consult a CPA.
Schools (NCES district)
- District
- Spring ISD
- NCES district ID
- 4841220
- Math proficiency
- 19% ▼ -13.00%
- Reading proficiency
- 26% ▼ -6.00%
- Median HH income
- $51,584
- Composite
- 20.12/100
- National rank
- #8643
- State rank
- #730 of 826 in TX
Livability — Spring
- Score
- 66/100
- State rank
- #635
- US rank
- #12101
Category grades
Schools grade is shown separately in the Schools card above.
Census & demographics
- Census place
- Spring, TX
- County
- Harris County · 4,702,590 people
- City population
- 430,529
- Metro
- Houston-The Woodlands-Sugar Land, TX
- Population (ZIP)
- 69,739
- Household income
- $88,617
- Rent vs Own
- Severe rent burden
- 1050.0
Population outlook (Harris County) Hauer SSP2
- Today (2025)
- 5,571,493 people
- By 2030
- 6,089,821 · +9.3%
- By 2040
- 7,142,806 · +28.2%
- By 2050
- 8,185,864 · +46.9%
- By 2075
- 10,574,329 · +89.8%
- By 2100
- 12,109,958 · +117.4%
Race, ethnicity, and origin ACS 2023
- Neighborhood character
- Diverse neighborhood (Simpson 0.69)
- Race & ethnicity
- Hispanic / Latino 40% White 30% Black 23% Two or more races 22% Asian 3%
- Hispanic origin (detail)
- Mexican 27% Puerto Rican 2% Cuban 2% Dominican 2%
- Common ancestry
- Lithuanian 2% Italian 1% Slovak 1%
- Foreign-born
- 17% · Canada, Jamaica, Vietnam
- Languages at home
- 64% English-only · Spanish 32% Vietnamese 1% Other Indo-European 1%
Political lean MEDSL · Harris
- 2024 margin
- Lean D (+5.5) · D 52.0% · R 46.4% · Other 1.6%
- 2008→2024 swing
- +3.9pp toward D · 2008: 1.6pp · 2024: 5.5pp
- All cycles
- 2024: D+5.5 2020: D+13.3 2016: D+12.4 2012: D+0.1 2008: D+1.6
Not yet ingested
- Civics
- —
Market trends
- HPI YoY
- ▼ -142.98%
- Current HPI
- 251.7231
- Rent YoY
- ▼ -0.30%
- Metro
- Houston-The Woodlands-Sugar Land, TX
- State GDP YoY
- ▲ 3.95%
- F500 in state
- 110
Industry mix (Fortune 500 HQ in TX)
| Industry | F500 HQs | Revenue |
|---|---|---|
| Energy | 16 | $1,198B |
|
||
| Technology | 5 | $198B |
|
||
| Engineering / Construction | 4 | $72B |
|
||
| Energy Services | 3 | $60B |
|
||
| Utilities | 3 | $41B |
|
||
| Healthcare | 2 | $330B |
|
||
Price history
+245.3% since first listed10 events — show timeline
- 2026-04-20 Price Changed $189,900 HARMLS
- 2026-04-14 Listed for Rent $1,650 HARMLS
- 2026-03-08 Listed $180,000 HARMLS
- 2023-08-09 Rental Removed $1,575 HARMLS
- 2023-08-02 Listed for Rent $1,575 HARMLS
- 2017-05-04 Listing Removed — HARMLS
- 2017-04-24 Listed $140,000 HARMLS
- 2007-01-16 Listing Removed — HARMLS
- 2006-07-10 Listed $74,900 HARMLS
- 1991-01-25 Sold (Public Records) $55,000 Public Records
Property tax history
+5.8%/yrLatest (2025): $5,212 · -2.0% YoY. Source: county tax records.
Cash-flow waterfall
monthlySold comps — $/sqft
last 12 mo · ≤1 miLoading sold comps…