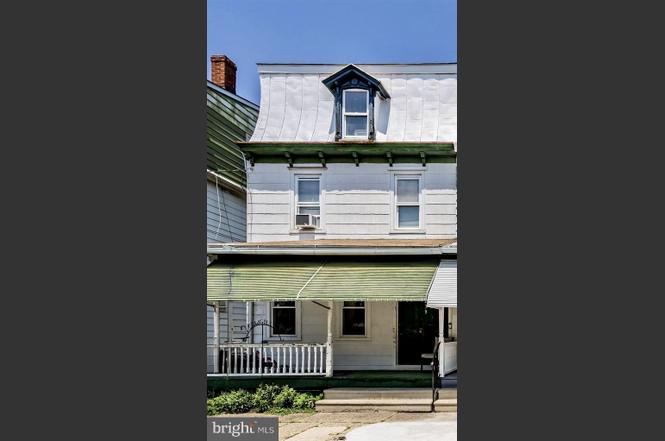
239 Conover St · Burlington, NJ
Flood risk 7/10 · Major
- FEMA flood zone
- AE
- Chance of flooding over 30 yrs
- 0.75%
- Est. flood insurance / yr
- $1,737 – $8,500
Fire risk 1/10 · Minimal
- Est. fire insurance / yr
- $526 – $976
Heat risk 6/10 · Moderate
- Hot days now (above 104°F)
- 7 days/yr
- Hot days in 30 yrs
- 15 days/yr
Wind risk 6/10 · Moderate
- Chance of severe wind over 30 yrs
- 27.0%
Air-quality risk 5/10 · Moderate
- Unhealthy air days now
- 6 days/yr
- Unhealthy air days in 30 yrs
- 8 days/yr
Risk factors via First Street. Map © Google.
Why this score? — see what drove the B- grade
The composite is a weighted blend of 9 inputs, each scored 0–100. Each bar is that input's sub-score; the figure is the points it added to the 100-point composite (weight × sub-score).
- Cash flow +30.0/30.0
- 1% rule +10.0/10.0
- DSCR +10.0/10.0
- ARV discount +7.5/15.0
- Livability +3.9/5.0
- Rent growth +2.5/5.0
- Condition / age +2.5/5.0
- Schools +1.6/10.0
- Appreciation +0.0/10.0
$70,000
🖨 Deal sheet 📄 Offer letter ✓ Due diligence
Listing remarks
Welcome to this spacious and versatile 3-story semi-attached twin home, located in the heart of historic Burlington City. This charming residence offers four generously sized bedrooms and two full bathrooms, making it an excellent opportunity for those looking to create their dream home or for investors seeking their next project. The first floor features a large living room, ideal for family gatherings or entertaining guests. The eat-in kitchen offers plenty of space for meals and everyday living, with lots of potential to modernize and personalize. Each level of the home offers ample natural light and original character, providing a solid foundation for a creative renovation. While the pr
Key facts
- Built 1900
Neighborhood map
What this means for you Summary
Snapshot
- This is a 4-bed/2.0-bath single-family listed at $70k.
Deal economics
- At list price, monthly cash flow is $1k ($13k/yr) — positive.
- The deal already cash-flows at list — no discount required.
- Meets the 1% rule at list price ($3k rent vs $70k).
- Cap rate 32.3% vs local median 4.6% in Burlington — top-decile yield for the area; either an underpriced asset or a hidden risk that comps aren't pricing in. Stress-test before assuming the spread holds.
Location & tenants
- Location reads 78/100 on livability (#89 in NJ, #2,359 nationally) — a middle-class / working-renter tenant base. Strengths: housing A+, health & safety A+, cost of living A-; Watch: schools C-, amenities F.
- Burlington City Public School District (suburban): math 7% / reading 29% proficiency, ranked #439 of 472 in NJ (top 93%) — low school quality limits family demand, transient renter base, plan for 1-2y turnover.
- Market conditions: 179 active listings in the ZIP; 8 comparable units currently listed for rent nearby; rentals leasing fast (median 2d on market — plan ~1-2 weeks tenant-placement turnaround); solid renter incomes; 2,161 units permitted in Burlington County in 2024 (988 in 5+ unit buildings).
- This rent runs 31% of the median local income ($98k/yr) — at the standard rent-burdened threshold; future hikes will face affordability resistance.
Forward outlook
- Local home prices are declining (-3.0%/yr); year-one equity from $484 of loan paydown is wiped out by about $2k of value loss. Plan a longer hold.
- Burlington County population projected to shrink 5% by 2050 — rents likely to lag national; underwrite the cash flow, not the appreciation.
- At projected returns (-3.0% appreciation + 3.0% rent growth), your $20k cash investment doubles in ~2 years — after that, you're playing with house money.
Negotiation context
- Only 1 days on market — expect competitive offers; lowballing is unlikely to land.
- 4 sale attempts since 21y ago with the ask held roughly flat each time — persistent listings suggest the price (not the market) is what's stuck; bring a comps-based counter.
Risks & watch-outs
- Watch-outs: flood insurance adds $427/mo; built in 1900 — expect roof / HVAC / electrical / plumbing capex.
- Climate carrying-cost: in FEMA flood zone AE (mandatory federal flood insurance); major wind risk, 27% chance of damaging wind over 30y; extreme-heat days projected 7→15/yr by 2055 (HVAC capex compounding) — expect insurance premiums to compound above CPI over the hold.
Questions for the listing agent
- Built in 1900 — when were the roof, HVAC, electrical panel, plumbing, and water heater last replaced?
- What's the actual annual flood-insurance premium (NFIP or private), and is the property in a SFHA with mandatory coverage?
- Is there a deadline driving the sale (1031 exchange, divorce, estate, relocation)? That informs how much negotiation room exists.
- What's the average days-on-market for RENTAL listings here right now (not sales)? A rising rental-DOM trend means longer vacancies and softer asking-rent achievability than the comps imply.
- What's the recent tenant-quality profile in this submarket — average credit score on applications, eviction rate, late-payment / NSF rate, and stable-employment percentage? A property-management company in the area should have these aggregated.
- How much new for-sale + rental construction is in the pipeline within 1–3 miles? Heavy new supply typically softens prices + rents 12–24 months out; constrained supply supports both.
Investment metrics
- 1% rule
- 3.62% ✓
- Cap rate
- 32.32%
- Cash-on-cash
- 92.95%
- DSCR
- 5.14
- GRM
- 2.3
CMA / ARV
- ARV (on-the-fly)
- $340,704
- Comps found
- 12
Show comp detail 12 sales within ~0.75 mi
| Address | Dist | Beds/Ba | Sqft | Sold | Price | $/sf | Match |
|---|---|---|---|---|---|---|---|
| 723 Woodland Ave | 0.44mi | 4/2.5 | 1,896 (-6%) | 0mo | $430,000 | $227 | 67 |
| 300 York St | 0.49mi | 3/2.0 (-1) | 2,057 (+2%) | 3mo | $215,000 | $105 | 66 |
| 628 Moorland Ave | 0.40mi | 4/1.5 | 1,870 (-7%) | 3mo | $270,000 | $144 | 65 |
| 338 Brown St | 0.14mi | 4/1.5 | 1,761 (-13%) | 7mo | $390,000 | $221 | 64 |
| 450 Locust Ave | 0.30mi | 4/2.5 | 2,222 (+10%) | 5mo | $375,000 | $169 | 63 |
| 775 Salem Rd | 0.59mi | 4/2.5 | 2,078 (+3%) | 3mo | $371,000 | $179 | 63 |
| 781 Salem Rd | 0.60mi | 4/2.0 | 1,935 (-4%) | 6mo | $355,000 | $183 | 60 |
| 225 Stacy St | 0.44mi | 4/2.0 | 1,834 (-9%) | 6mo | $157,000 | $86 | 60 |
| 317 Elm Ave | 0.68mi | 3/2.5 (-1) | 2,006 (-0%) | 5mo | $390,000 | $194 | 56 |
| 428 Locust Ave | 0.27mi | 5/2.0 (+1) | 2,232 (+11%) | 10mo | $168,500 | $75 | 56 |
| 422 Locust Ave | 0.27mi | 5/2.0 (+1) | 2,260 (+12%) | 11mo | $309,500 | $137 | 53 |
| 218 E Broad St | 0.55mi | 5/2.0 (+1) | 2,286 (+13%) | 12mo | $287,000 | $126 | 37 |
Match score weights: distance 35% · size 25% · config 20% · recency 20%. Top-matched comps best support the ARV.
Projected returns pro-forma
-3.0% appreciation · 3.0% rent growth · sell at horizon
- IRR
- 66.3%
- Equity multiple
- 3.98×
- Total profit
- $58,490
- Equity at exit
- $10,437
- IRR
- 70.6%
- Equity multiple
- 8.23×
- Total profit
- $141,686
- Equity at exit
- $6,052
Cash invested: $19,600 (down + closing). Projections, not guarantees.
Landlord ↔ Tenant lean methodology
- Overall (STATE)
- 21 Tenant-Leaning
- State New Jersey
- 21 Tenant-Leaning · D+6
- County
- — inherits STATE
- City
- — inherits STATE
ZIP-level market 08016
- Home prices YoY
- -21.8%
- Active inventory
- 179
- Price-to-rent
- 2.3×
Monthly cashflow live
- Estimated rent
- $2,534 high interval (Pro) →
- Mortgage (P&I)
- −$367
- Tax est. 1.5%
- −$88 /mo · $1,050/yr
- Insurance
- −$29
- Flood insurance flood zone
- −$427 /mo · $5,118/yr
- HOA
- −$0
- Vacancy / Maint / Mgmt
- −$532
- Net cashflow
- $1,092
Break-even live
UW: 25.0% down · 7.5% · 30yr · 1.5% tax · 5.0% vac · 8.0% maint · 8.0% mgmt
Financing live
Cash to close
- Down payment
- $17,500
- Closing costs
- $2,100
- Reserves months
- —
- Total cash needed
- —
Loan-product check · same deal, 3 products live
Conventional
25% down · 7.5% · 30yr
- Down + closing
- —
- Monthly P&I
- —
- Monthly cashflow
- —
- DSCR
- —
- Eligible?
- —
Personal DTI + credit; lowest rate.
DSCR
20% down · 8.5% · 30yr
- Down + closing
- —
- Monthly P&I
- —
- Monthly cashflow
- —
- DSCR
- —
- Eligible?
- —
No personal income docs; deal must DSCR.
Hard money
10% down · 12.0% · 12mo
- Down + closing
- —
- Monthly P&I
- —
- Monthly cashflow
- —
- DSCR
- —
- Eligible?
- —
Short-term bridge; refi at stabilization.
Rent comps 8 comps
| Address | Beds | Baths | Sqft | Rent | $/sqft | DOM | Units | Dist |
|---|---|---|---|---|---|---|---|---|
| 105 W Union St Burlington, NJ | 4.0 | 1.5 | 1645 | $2,000 | $1.22 | 2d | 1 | 0.17mi |
| 405 Lawrence St Burlington, NJ | 4.0 | 1.0 | 1859 | $2,000 | $1.08 | 5d | 1 | 0.42mi |
| 336 Barclay St Unit B Burlington, NJ | 3.0 | 1.0 | 1944 | $1,800 | $0.93 | 24d | 1 | 0.64mi |
| 516 Columbus Rd Burlington, NJ | 4.0 | 1.0 | 1600 | $2,750 | $1.72 | 15d | 1 | 0.85mi |
| 516 Columbus Rd Burlington, NJ | 4.0 | 1.0 | 1404 | $2,400 | $1.71 | 1d | 1 | 0.85mi |
| 115 Cedar St Unit 2 Bristol, PA | 3.0 | 1.0 | 1700 | $2,600 | $1.53 | 1d | 1 | 1.33mi |
| 256 Radcliffe St Bristol, PA | 4.0 | 2.0 | 1900 | $3,250 | $1.71 | 1d | 1 | 1.38mi |
| 327 Wood St Bristol, PA | 4.0 | 3.5 | 2453 | $3,995 | $1.63 | 1d | 1 | 1.50mi |
Listing history 13 events
-
2025-10-02status Pending
-
2025-10-02$70,000 Active
-
2025-08-30historical
-
2025-06-24$199,000 Active
-
2025-05-21status Pending
-
2025-05-21historical
-
2025-05-16historical Active Under Contract
-
2025-04-23$229,000 Active
-
2005-10-29historical
-
2005-04-29$174,900
-
1999-01-07soldstatus $85,500
-
1990-02-06soldstatus $85,500
-
1987-11-10soldstatus $68,000
ⓘ Source: listings_history table (triggers on properties + properties_extension) + one-shot
backfill from property_details.listing_events for pre-trigger history.
Climate risk First Street
- Flood 7/10 Severe FEMA zone AE · 75% chance over 30 yrs
- Wildfire 1/10 Low
- Heat 6/10 Major 7 d/yr ≥104°F today · 15 d/yr by 30 yrs out
- Wind 6/10 Major 27% chance of damaging wind over 30 yrs
- Air quality 5/10 Major 6 unhealthy d/yr today · 8 by 30 yrs out
Nearby sold comps map
Loading sold comps map…
Walkable amenities ~0.75 mi
Loading nearby amenities…
Taxation est. · year 1
- Rental income
- $30,410
- − Mortgage interest
- −$3,921
- − Property taxes
- −$1,050
- − Insurance
- −$5,468
- − Repairs & maintenance
- −$2,433
- − Management
- −$2,433
- − Depreciation
- −$2,036
- Taxable income
- $13,069
- Est. tax owed @ 24.0%
- −$3,137
- After-tax cash flow
- $9,964/yr
For passive investors: Depreciation is non-cash, so a rental often shows a tax loss while cash-flowing — sheltering income. Rental losses are passive: they offset passive income freely, and up to $25,000/yr can offset ordinary (W-2) income if you actively participate and your MAGI is under $100k (phasing out to $0 by $150k); unused losses carry forward. On sale, claimed depreciation is recaptured at up to 25%, and gains may owe capital-gains tax (a 1031 exchange can defer both). Figures are a year-1 estimate at your 24.0% rate — not tax advice; consult a CPA.
Schools (NCES district)
- District
- Burlington City Public School District
- NCES district ID
- 3402430
- Math proficiency
- 7% ▼ -16.00%
- Reading proficiency
- 29% ▼ -8.00%
- Median HH income
- $51,122
- Composite
- 16.27/100
- National rank
- #9218
- State rank
- #439 of 472 in NJ
Livability — Burlington
- Score
- 78/100
- State rank
- #89
- US rank
- #2359
Category grades
Schools grade is shown separately in the Schools card above.
Census & demographics
- Census place
- Burlington, NJ
- County
- Burlington County · 323,710 people
- Metro
- Philadelphia-Camden-Wilmington, PA-NJ-DE-MD
- Population (ZIP)
- 34,920
- Household income
- $98,463
- Rent vs Own
- Severe rent burden
- 1045.0
Population outlook (Burlington County) Hauer SSP2
- Today (2025)
- 453,425 people
- By 2030
- 452,359 · -0.2%
- By 2040
- 445,033 · -1.9%
- By 2050
- 431,760 · -4.8%
- By 2075
- 406,277 · -10.4%
- By 2100
- 364,732 · -19.6%
Race, ethnicity, and origin ACS 2023
- Neighborhood character
- Diverse neighborhood (Simpson 0.68)
- Race & ethnicity
- White 44% Black 33% Two or more races 10% Hispanic / Latino 9% Asian 7%
- Hispanic origin (detail)
- Puerto Rican 4% Dominican 1%
- Common ancestry
- Romanian 4% Hispanic 2% Lithuanian 1%
- Foreign-born
- 15% · Canada
- Languages at home
- 84% English-only · Spanish 4% Other Indo-European 4% French/Haitian/Cajun 2%
Political lean MEDSL · Burlington
- 2024 margin
- D (+16.6) · D 57.6% · R 41.0% · Other 1.3%
- 2008→2024 swing
- -2.0pp toward R · 2008: 18.6pp · 2024: 16.6pp
- All cycles
- 2024: D+16.6 2020: D+19.5 2016: D+14.8 2012: D+18.7 2008: D+18.6
Not yet ingested
- Civics
- —
Market trends
- HPI YoY
- ▼ -83.42%
- Current HPI
- 298.7935
- Rent YoY
- —
- Metro
- Philadelphia-Camden-Wilmington, PA-NJ-DE-MD
- State GDP YoY
- ▲ 2.05%
- F500 in state
- 34
Industry mix (Fortune 500 HQ in NJ)
| Industry | F500 HQs | Revenue |
|---|---|---|
| Consumer Goods | 3 | $31B |
|
||
| Pharmaceuticals | 2 | $153B |
|
||
| Technology | 2 | $21B |
|
||
| Insurance | 2 | $20B |
|
||
| Healthcare | 2 | $19B |
|
||
| Financial Services | 1 | $70B |
|
||
Price history
+2.9% since first listed13 events — show timeline
- 2025-10-02 Pending — BRIGHT MLS
- 2025-10-02 Listed $70,000 BRIGHT MLS
- 2025-08-30 Listing Removed — BRIGHT MLS
- 2025-06-24 Listed $199,000 BRIGHT MLS
- 2025-05-21 Pending — BRIGHT MLS
- 2025-05-21 Listing Removed — BRIGHT MLS
- 2025-05-16 Contingent — BRIGHT MLS
- 2025-04-23 Listed $229,000 BRIGHT MLS
- 2005-10-29 Listing Removed — BRIGHT MLS
- 2005-04-29 Listed $174,900 BRIGHT MLS
- 1999-01-07 Sold (Public Records) $85,500 Public Records
- 1990-02-06 Sold (Public Records) $85,500 Public Records
- 1987-11-10 Sold (Public Records) $68,000 Public Records
Property tax history
+4.0%/yrLatest (2025): $6,164 · +2.6% YoY. Source: county tax records.
Cash-flow waterfall
monthlySold comps — $/sqft
last 12 mo · ≤1 miLoading sold comps…