2010 Shady Oak St · Corpus Christi, TX
Flood risk No data
- FEMA flood zone
- —
- Chance of flooding over 30 yrs
- —
- Est. flood insurance / yr
- —
Fire risk No data
- Est. fire insurance / yr
- —
Heat risk No data
- Hot days now (above threshold)
- —
- Hot days in 30 yrs
- —
Wind risk No data
- Chance of severe wind over 30 yrs
- —
Air-quality risk No data
- Unhealthy air days now
- —
- Unhealthy air days in 30 yrs
- —
Risk factors via First Street. Map © Google.
Why this score? — see what drove the D grade
The composite is a weighted blend of 9 inputs, each scored 0–100. Each bar is that input's sub-score; the figure is the points it added to the 100-point composite (weight × sub-score).
- Cash flow +12.3/30.0
- ARV discount +8.0/15.0
- Livability +3.9/5.0
- DSCR +3.7/10.0
- 1% rule +3.5/10.0
- Schools +3.4/10.0
- Rent growth +3.0/5.0
- Condition / age +2.5/5.0
- Appreciation +0.0/10.0
$211,999
🖨 Deal sheet (PDF) 📄 Offer letter ✓ Due diligence
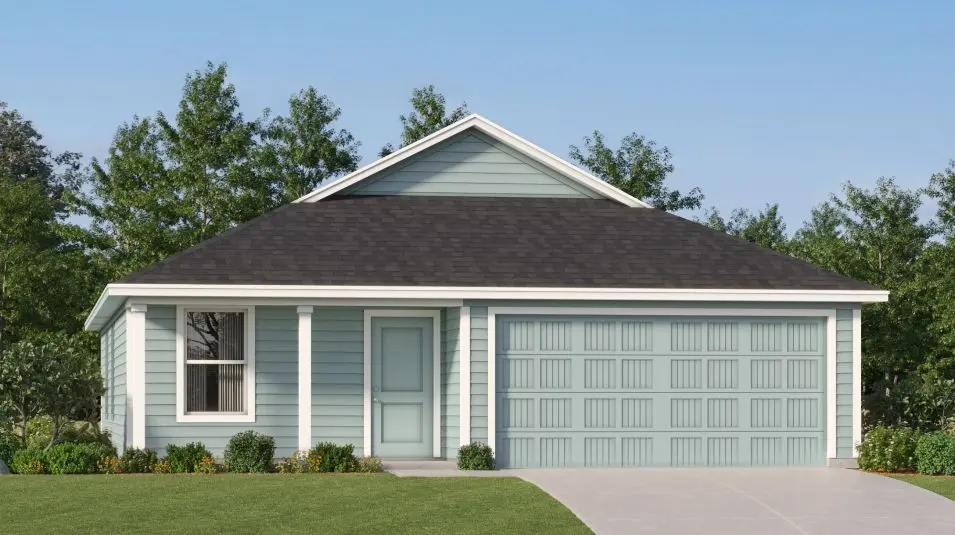
Listing remarks
This new home is conveniently laid out on a single floor for maximum comfort and convenience. At its heart stands an open-concept layout connecting a spacious family room, a multi-functional kitchen and lovely dining area. The owner's suite is situated in a private corner and comes complete with an adjoining bathroom, while the two secondary bedrooms are located near the foyer.
Key facts
- Private corner
- Adjoining bathroom
- Open-concept layout
Tags
Property features AI
Finance
- Other: Address: 2010 Shady Oak St, Corpus Christi, TX 78410; Status: Active; Listing type: Spec new-construction; Plan name: Beckman
- Financial info: List price $212,999
Exterior
- Parking: Detached or attached 2 parking spaces (2 garage spaces listed)
- Home design: Single-family property (Beckman plan)
- Exterior features: Living area approximately 1,260 (listed)
Interior
- Bedrooms: 3 bedrooms
- Bathrooms: 2 full bathrooms
- Interior features: Spec home (new construction, Beckman plan)
Neighborhood map
What this means for you Summary
Snapshot
- This is a 3-bed/2.0-bath single-family listed at $212k.
Deal economics
- At list price, monthly cash flow is $-38 ($-453/yr) — negative.
- To cash-flow at today's rent, offer at most $207k (2.6% below list).
- To meet the 1% rule (rent ≥ 1% of price), the offer needs to be $181k (14.8% below list).
- Recommended offer: $181k (14.8% below list) — sets the bar for 1% rule.
- Cap rate 6.1% vs local median 3.6% in Corpus Christi — top-decile yield for the area; either an underpriced asset or a hidden risk that comps aren't pricing in. Stress-test before assuming the spread holds.
Location & tenants
- Location reads 78/100 on livability (#66 in TX, #2,404 nationally) — a middle-class / working-renter tenant base. Strengths: commute A+, cost of living A+, housing A+; Watch: crime F.
- Tuloso-Midway ISD (urban): math 33% / reading 46% proficiency, ranked #408 of 826 in TX (top 49%) — families likely to look elsewhere, expect single-tenant / working-renter base with shorter leases.
- Zoned schools: Tuloso-Midway Int (math 35% / reading 45%, grade F, #1,514 of 4,322 statewide, top 36%, 890 students, 66% FRL); Tuloso-Midway Middle (math 33% / reading 44%, grade F, #704 of 1,662 statewide, top 43%, 801 students, 64% FRL); Tuloso-Midway H S (math 23% / reading 54%, grade F, #866 of 1,632 statewide, top 54%, 1,062 students, 57% FRL).
- Market conditions: Rents rising (+2.0%/yr); 339 active listings in the ZIP; 2 comparable units currently listed for rent nearby; solid renter incomes; 1,397 units permitted in Nueces County in 2024 (47 in 5+ unit buildings).
Forward outlook
- Local home prices are declining (-3.0%/yr); year-one equity from $1k of loan paydown is wiped out by about $6k of value loss. Plan a longer hold.
- Nueces County population projected at +36% by 2050 — long-run rental-demand tailwind backs the buy-and-hold thesis.
Negotiation context
- It's been on market 15 days — a 2% lower offer ($209k) is reasonable based on typical stale-listing flexibility.
Questions for the listing agent
- What do current leases actually rent for vs. the listed asking? Can we see a recent rent roll and the last 12 months of T-12 income?
- Is there a deadline driving the sale (1031 exchange, divorce, estate, relocation)? That informs how much negotiation room exists.
- Crime grade is F in this area — have there been break-ins, vandalism, or insurance claims at this property in the last 3 years? What carrier currently insures it and at what premium?
- The area grade is low — what's the realistic commute time and amenity access for the typical tenant pool here? Any planned neighborhood developments (good or bad) we should know about?
- What's the average days-on-market for RENTAL listings here right now (not sales)? A rising rental-DOM trend means longer vacancies and softer asking-rent achievability than the comps imply.
- What's the recent tenant-quality profile in this submarket — average credit score on applications, eviction rate, late-payment / NSF rate, and stable-employment percentage? A property-management company in the area should have these aggregated.
- How much new for-sale + rental construction is in the pipeline within 1–3 miles? Heavy new supply typically softens prices + rents 12–24 months out; constrained supply supports both.
Investment metrics
- 1% rule
- 0.85% ✗
- Cap rate
- 6.08%
- Cash-on-cash
- -0.76%
- DSCR
- 0.97
- GRM
- 9.8
CMA / ARV
- ARV (on-the-fly)
- $214,200
- Comps found
- 12
Show comp detail 12 sales within ~0.75 mi
| Address | Dist | Beds/Ba | Sqft | Sold | Price | $/sf | Match |
|---|---|---|---|---|---|---|---|
| 2138 Shady Oak St | 0.17mi | 3/2.0 | 1,260 (0%) | 1mo | $224,999 | $179 | 91 |
| 2113 Shady Oak St | 0.17mi | 3/2.0 | 1,260 (0%) | 4mo | $213,999 | $170 | 89 |
| 9202 Dutch Oak St | 0.21mi | 3/2.0 | 1,260 (0%) | 4mo | $208,999 | $166 | 87 |
| 9210 Perseverance St | 0.19mi | 3/2.0 | 1,260 (0%) | 6mo | $210,999 | $167 | 86 |
| 9226 Perseverance St | 0.20mi | 3/2.0 | 1,260 (0%) | 7mo | $223,999 | $178 | 84 |
| 9242 Perseverance St | 0.22mi | 3/2.0 | 1,260 (0%) | 7mo | $209,999 | $167 | 84 |
| 2038 Escalante | 0.47mi | 3/2.0 | 1,216 (-4%) | 2mo | $229,500 | $189 | 70 |
| 2006 Spanish Trl | 0.26mi | 3/2.0 | 1,432 (+14%) | 4mo | $228,000 | $159 | 62 |
| 9312 Mcnorton Rd | 0.44mi | 3/1.0 | 1,338 (+6%) | 6mo | $219,900 | $164 | 60 |
| 1618 Danish Oak Dr | 0.45mi | 3/2.0 | 1,415 (+12%) | 2mo | $290,200 | $205 | 57 |
| 9422 English Oak Dr | 0.33mi | 3/2.0 | 1,428 (+13%) | 6mo | $255,000 | $179 | 57 |
| 9002 Caroline | 0.57mi | 3/2.0 | 1,140 (-10%) | 8mo | $130,000 | $114 | 51 |
Match score weights: distance 35% · size 25% · config 20% · recency 20%. Top-matched comps best support the ARV.
Projected returns pro-forma
-3.0% appreciation · 1.98% rent growth · sell at horizon
- IRR
- -18.7%
- Equity multiple
- 0.35×
- Total profit
- $-38,564
- Equity at exit
- $31,610
- IRR
- -13.3%
- Equity multiple
- 0.26×
- Total profit
- $-43,943
- Equity at exit
- $18,330
Cash invested: $59,360 (down + closing). Projections, not guarantees.
Landlord ↔ Tenant lean methodology
- Overall (STATE)
- 87 Strongly Landlord-Friendly
- State Texas
- 87 Strongly Landlord-Friendly · R+5
- County
- — inherits STATE
- City
- — inherits STATE
ZIP-level market 78410
- Rents YoY
- 2.0%
- Active inventory
- 339
- Price-to-rent
- 9.8×
Monthly cashflow live
- Estimated rent
- $1,807 medium interval (Pro) →
- Mortgage (P&I)
- −$1,112
- Tax est. 1.5%
- −$265 /mo · $3,180/yr
- Insurance
- −$88
- HOA
- −$0
- Vacancy / Maint / Mgmt
- −$379
- Net cashflow
- $-38
Break-even live
Sensitivity live
| Price | -10% $109 | -5% $36 | +0% $-38 | +5% $-111 | +10% $-184 |
|---|---|---|---|---|---|
| Rent | -10% $-180 | -5% $-109 | +0% $-38 | +5% $34 | +10% $105 |
| Rate | -1.0pp $69 | -0.5pp $16 | base $-38 | +0.5pp $-93 | +1.0pp $-149 |
UW: 25.0% down · 7.5% · 30yr · 1.5% tax · 5.0% vac · 8.0% maint · 8.0% mgmt
Financing live
Cash to close
- Down payment
- $53,000
- Closing costs
- $6,360
- Reserves months
- —
- Total cash needed
- —
Loan-product check · same deal, 3 products live
Conventional
25% down · 7.5% · 30yr
- Down + closing
- —
- Monthly P&I
- —
- Monthly cashflow
- —
- DSCR
- —
- Eligible?
- —
Personal DTI + credit; lowest rate.
DSCR
20% down · 8.5% · 30yr
- Down + closing
- —
- Monthly P&I
- —
- Monthly cashflow
- —
- DSCR
- —
- Eligible?
- —
No personal income docs; deal must DSCR.
Hard money
10% down · 12.0% · 12mo
- Down + closing
- —
- Monthly P&I
- —
- Monthly cashflow
- —
- DSCR
- —
- Eligible?
- —
Short-term bridge; refi at stabilization.
Rent comps 2 comps
| Address | Beds | Baths | Sqft | Rent | $/sqft | DOM | Units | Dist |
|---|---|---|---|---|---|---|---|---|
| 9318 Moon Beam Trl Corpus Christi, TX | 3.0 | 2.0 | 1725 | $2,000 | $1.16 | 15d | 1 | 0.68mi |
| 9338 Evening Star Ln Corpus Christi, TX | 3.0 | 2.0 | 1710 | $1,700 | $0.99 | 45d | 1 | 0.84mi |
Listing history 9 events
-
2026-06-10pricedays on market $211,999 Active 15 DOM
-
2026-06-09days on market $210,999 Active 14 DOM
-
2026-06-08days on market $210,999 Active 13 DOM
-
2026-06-07pricedays on market $210,999 Active 12 DOM
-
2026-06-03days on market $212,999 Active 8 DOM
-
2026-06-02days on market $212,999 Active 7 DOM
-
2026-06-01days on market $212,999 Active 6 DOM
-
2026-05-31days on market $212,999 Active 5 DOM
-
2026-05-30days on market $212,999 Active 4 DOM
ⓘ Source: listings_history table (triggers on properties + properties_extension) + one-shot
backfill from property_details.listing_events for pre-trigger history.
Nearby sold comps map
Loading sold comps map…
Walkable amenities ~0.75 mi
Loading nearby amenities…
Taxation est. · year 1
- Rental income
- $21,681
- − Mortgage interest
- −$11,875
- − Property taxes
- −$3,180
- − Insurance
- −$1,060
- − Repairs & maintenance
- −$1,735
- − Management
- −$1,735
- − Depreciation
- −$6,167
- Taxable loss
- −$4,070
- Est. tax savings @ 24.0%
- +$977
- After-tax cash flow
- $524/yr
For passive investors: Depreciation is non-cash, so a rental often shows a tax loss while cash-flowing — sheltering income. Rental losses are passive: they offset passive income freely, and up to $25,000/yr can offset ordinary (W-2) income if you actively participate and your MAGI is under $100k (phasing out to $0 by $150k); unused losses carry forward. On sale, claimed depreciation is recaptured at up to 25%, and gains may owe capital-gains tax (a 1031 exchange can defer both). Figures are a year-1 estimate at your 24.0% rate — not tax advice; consult a CPA.
Schools (NCES district)
- District
- Tuloso-Midway ISD
- NCES district ID
- 4843350
- Math proficiency
- 33% ▼ -13.00%
- Reading proficiency
- 46% ▼ -3.00%
- Median HH income
- $53,078
- Composite
- 34.33/100
- National rank
- #5235
- State rank
- #408 of 826 in TX
Livability — Corpus Christi
- Score
- 78/100
- State rank
- #66
- US rank
- #2404
Category grades
Schools grade is shown separately in the Schools card above.
Census & demographics
- Census place
- Corpus Christi, TX
- County
- Nueces County · 296,836 people
- City population
- 296,836
- Metro
- Corpus Christi, TX
- Population (ZIP)
- 29,040
- Household income
- $79,308
- Rent vs Own
- Severe rent burden
- 324.0
Population outlook (Nueces County) Hauer SSP2
- Today (2025)
- 418,037 people
- By 2030
- 447,123 · +7.0%
- By 2040
- 505,911 · +21.0%
- By 2050
- 567,522 · +35.8%
- By 2075
- 729,686 · +74.6%
- By 2100
- 847,087 · +102.6%
Race, ethnicity, and origin ACS 2023
- Neighborhood character
- Majority Hispanic (59%)
- Race & ethnicity
- Hispanic / Latino 59% White 38% Two or more races 35% Black 1%
- Hispanic origin (detail)
- Mexican 54% Puerto Rican 2%
- Common ancestry
- Slovak 1% Lithuanian 1% Iranian 1%
- Foreign-born
- 6% · Canada
- Languages at home
- 71% English-only · Spanish 28%
Political lean MEDSL · Nueces
- 2024 margin
- R (+11.5) · D 43.8% · R 55.3%
- 2008→2024 swing
- -7.1pp toward R · 2008: -4.4pp · 2024: -11.5pp
- All cycles
- 2024: R+11.5 2020: R+2.9 2016: R+1.5 2012: R+3.2 2008: R+4.4
Not yet ingested
- Civics
- —
Market trends
- HPI YoY
- ▼ -145.45%
- Current HPI
- 174.0462
- Rent YoY
- ▲ 1.98%
- Metro
- Corpus Christi, TX
- State GDP YoY
- ▲ 3.95%
- F500 in state
- 110
Industry mix (Fortune 500 HQ in TX)
| Industry | F500 HQs | Revenue |
|---|---|---|
| Energy | 16 | $1,198B |
|
||
| Technology | 5 | $198B |
|
||
| Engineering / Construction | 4 | $72B |
|
||
| Energy Services | 3 | $60B |
|
||
| Utilities | 3 | $41B |
|
||
| Healthcare | 2 | $330B |
|
||
Cash-flow waterfall
monthlySold comps — $/sqft
last 12 mo · ≤1 miLoading sold comps…