 🌊 Lakefront
204E Lakeview Ter · Conroe, TX
Flood risk 5/10 · Moderate
- FEMA flood zone
- X (unshaded)
- Chance of flooding over 30 yrs
- 0.26%
- Est. flood insurance / yr
- $507 – $1,088
Fire risk 4/10 · Minor
- Est. fire insurance / yr
- $1,222 – $2,270
Heat risk 8/10 · Major
- Hot days now (above 110°F)
- 7 days/yr
- Hot days in 30 yrs
- 24 days/yr
Wind risk 8/10 · Major
- Chance of severe wind over 30 yrs
- 99.0%
Air-quality risk 2/10 · Minimal
- Unhealthy air days now
- 1 days/yr
- Unhealthy air days in 30 yrs
- 1 days/yr
Risk factors via First Street. Map © Google.
Why this score? — see what drove the D grade
The composite is a weighted blend of 9 inputs, each scored 0–100. Each bar is that input's sub-score; the figure is the points it added to the 100-point composite (weight × sub-score).
- ARV discount +15.0/15.0
- Cash flow +7.8/30.0
- Schools +5.4/10.0
- 1% rule +5.0/10.0
- Condition / age +4.0/5.0
- Livability +3.7/5.0
- DSCR +1.9/10.0
- Rent growth +1.7/5.0
- Appreciation +0.0/10.0
$129,000
🖨 Deal sheet (PDF) 📄 Offer letter ✓ Due diligence
Listing remarks
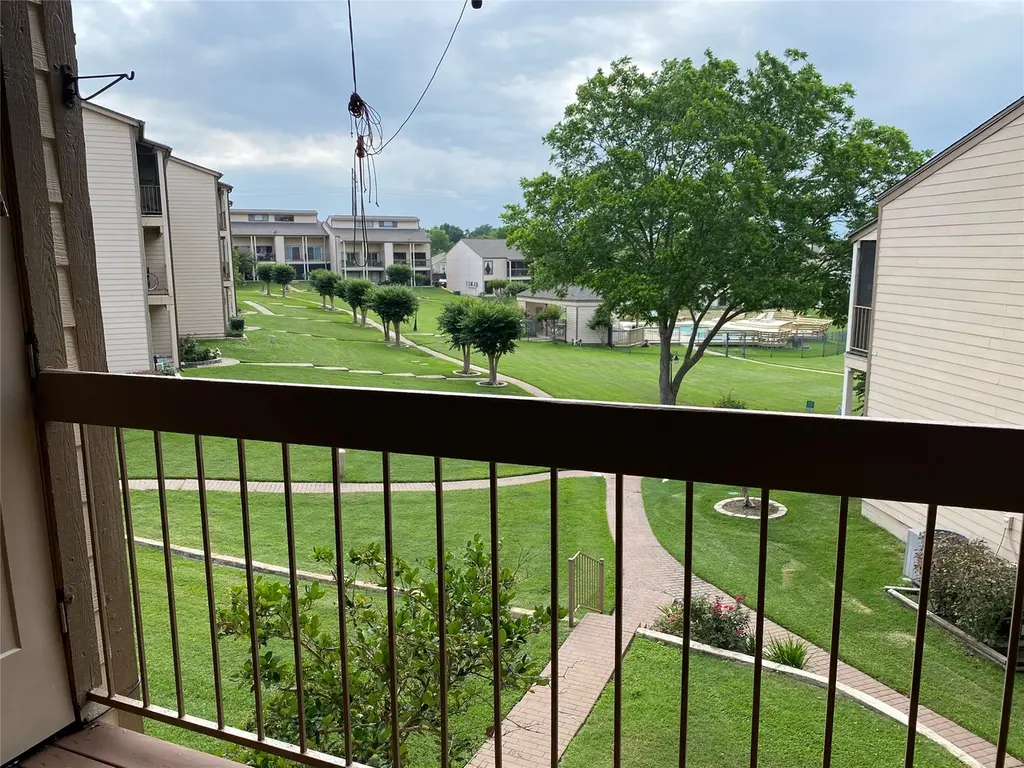
Beautiful 1 Bedroom Condo Located in the Golf and Lakeside Community of April Sound, The Kitchen Opens seamlessly to the dining and living areas, creating an inviting space for living and entertaining. The living area boats patio doors that lead to a covered Balcony with views overlooking the pool and common areas. The primary bedroom has a bathroom en-suite with a large shower. an additional room/Loft can be used as a bedroom or extra storage space.
Key facts
- Covered balcony
- Large shower
- Additional room
Tags
Property features AI
Finance
- Financial info: Lease considered
- HOA & community: April Sound POA; Monthly association fee; Association amenities include clubhouse, controlled access, and pool; Association fee covers common areas, insurance, structure maintenance, and recreation facilities
Exterior
- Parking: Additional parking available; Assigned parking
- Security: Controlled access; Smoke detectors
- Utilities: Public water; Public sewer
- Home design: Residential property; Single-story; Faces south; Entry level: first floor
- Construction: Cement siding; Composition roof; Slab foundation; Built in 1978
- Exterior features: Balcony; Tennis courts; Association pool
Interior
- Kitchen: Electric oven; Electric range; Microwave
- Bedrooms: Primary bedroom on first floor (12 ft x 10 ft); Second possible bedroom
- Flooring: Laminate counters noted (flooring type not specified)
- Bathrooms: 1 full bathroom (primary bathroom on first floor, 8 ft x 7 ft)
- Heating & cooling: Central heating (electric); Central air (electric)
- Interior features: Breakfast bar; High ceilings; Kitchen/family room combo; Laminate counters; Kitchen/dining combo; Loft
Neighborhood map
What this means for you Summary
Snapshot
- This is a 1-bed/1.0-bath condo listed at $129k. Condition is rated good.
Deal economics
- At list price, monthly cash flow is $-141 ($-2k/yr) — negative.
- To cash-flow at today's rent, offer at most $109k (15.9% below list).
- Meets the 1% rule at list price ($1k rent vs $129k).
- Recommended offer: $109k (15.9% below list) — sets the bar for cash-flow.
- Cap rate 5.0% vs local median 3.1% in Conroe — top-decile yield for the area; either an underpriced asset or a hidden risk that comps aren't pricing in. Stress-test before assuming the spread holds.
Location & tenants
- Location reads 74/100 on livability (#169 in TX, #4,447 nationally) — a middle-class / working-renter tenant base. Strengths: cost of living A+, housing A+, amenities B; Watch: commute F, health & safety F.
- Montgomery ISD (rural): math 63% / reading 57% proficiency, ranked #49 of 826 in TX (top 6%) — acceptable for families but not a draw, mixed tenant base, ~2y average lease.
- Zoned schools: Stewart Creek El (math 49% / reading 58%, grade C, #686 of 4,322 statewide, top 16%, 738 students, 46% FRL); Montgomery J H (math 68% / reading 54%, grade B+, #145 of 1,662 statewide, top 9%, 1,045 students, 30% FRL); Lake Creek H S (math 53% / reading 68%, grade C+, #268 of 1,632 statewide, top 17%, 1,649 students, 23% FRL).
- Market conditions: Rents falling (-3.3%/yr); 1069 active listings in the ZIP; 2 comparable units currently listed for rent nearby; solid renter incomes; 13,259 units permitted in Montgomery County in 2024 (1,402 in 5+ unit buildings).
- This rent is only 15% of the median local income ($107k/yr) — well below the 30% rent-burden line; pricing power to push rent on renewal without tenant pushback.
Forward outlook
- Local home prices are declining (-3.0%/yr); year-one equity from $892 of loan paydown is wiped out by about $4k of value loss. Plan a longer hold.
- Montgomery County population projected at +65% by 2050 — long-run rental-demand tailwind backs the buy-and-hold thesis.
Negotiation context
- It's been on market 47 days — a 3% lower offer ($125k) is reasonable based on typical stale-listing flexibility.
- 7 sale attempts; this cycle's ask is 10220% above the opening price — seller raised mid-cycle; expect resistance to lowballs.
Risks & watch-outs
- Watch-outs: HOA is 21% of rent.
- Climate carrying-cost: moderate flood risk; severe wind risk, 99% chance of damaging wind over 30y; extreme-heat days projected 7→24/yr by 2055 (HVAC capex compounding) — expect insurance premiums to compound above CPI over the hold.
Questions for the listing agent
- What do current leases actually rent for vs. the listed asking? Can we see a recent rent roll and the last 12 months of T-12 income?
- It's been on market 47 days. Have you received any prior offers? Is the seller open to a 16% concession, seller financing, or rate buy-down credit?
- Built in 1978 — when were the roof, HVAC, electrical panel, plumbing, and water heater last replaced?
- What does the HOA fee cover, when was the last increase, and are there any pending special assessments or reserve-fund shortfalls?
- Any open or pending special assessments — roof, HVAC, plumbing, elevator, façade? What's the per-unit balance and payoff schedule, and is the seller paying it off at close or rolling it to the buyer?
- Is there a deadline driving the sale (1031 exchange, divorce, estate, relocation)? That informs how much negotiation room exists.
- Schools are D-rated, which usually means shorter tenancies and higher turnover. Who's the typical renter profile here, and what's been the actual vacancy rate?
- The area grade is low — what's the realistic commute time and amenity access for the typical tenant pool here? Any planned neighborhood developments (good or bad) we should know about?
- This sits on a lake — are riparian / water-frontage rights deeded with the parcel? Any dock permits, shoreline easements, or HOA water-use restrictions?
- What's the documented flood / surge / shoreline-erosion history here (FEMA AND non-FEMA — e.g., storm surge, creek backup, septic-field saturation)?
- Any water-quality or seasonal algae-bloom issues that affect tenant satisfaction or short-term-rental demand?
- What's the average days-on-market for RENTAL listings here right now (not sales)? A rising rental-DOM trend means longer vacancies and softer asking-rent achievability than the comps imply.
- What's the recent tenant-quality profile in this submarket — average credit score on applications, eviction rate, late-payment / NSF rate, and stable-employment percentage? A property-management company in the area should have these aggregated.
- How much new apartment / multifamily construction is in the pipeline within 1–3 miles? Heavy new supply (>2% of stock underway) typically softens rents 12–24 months out; light construction supports rent growth.
Investment metrics
- 1% rule
- 1.00% ✓
- Cap rate
- 4.98%
- Cash-on-cash
- -4.69%
- DSCR
- 0.79
- GRM
- 8.3
CMA / ARV
- ARV (median comp)
- $206,911
- List price
- $129,000
- Delta
- -37.65%
- Verdict
- UNDERPRICED
- Comps
- 20 within 2.0 mi
Projected returns pro-forma
-3.0% appreciation · 0.0% rent growth · sell at horizon
- IRR
- -28.7%
- Equity multiple
- 0.07×
- Total profit
- $-33,515
- Equity at exit
- $19,234
- IRR
- -55.5%
- Equity multiple
- -0.51×
- Total profit
- $-54,692
- Equity at exit
- $11,154
Cash invested: $36,120 (down + closing). Projections, not guarantees.
Landlord ↔ Tenant lean methodology
- Overall (STATE)
- 87 Strongly Landlord-Friendly
- State Texas
- 87 Strongly Landlord-Friendly · R+5
- County
- — inherits STATE
- City
- — inherits STATE
ZIP-level market 77356
- Home prices YoY
- -30.3%
- Rents YoY
- -3.3%
- Active inventory
- 1069
- Price-to-rent
- 8.3×
Monthly cashflow live
- Estimated rent
- $1,296 medium interval (Pro) →
- Mortgage (P&I)
- −$676
- Tax est. 1.5%
- −$161 /mo · $1,935/yr
- Insurance
- −$54
- HOA
- −$274
- Vacancy / Maint / Mgmt
- −$272
- Net cashflow
- $-141
Break-even live
Sensitivity live
| Price | -10% $-52 | -5% $-97 | +0% $-141 | +5% $-186 | +10% $-230 |
|---|---|---|---|---|---|
| Rent | -10% $-244 | -5% $-193 | +0% $-141 | +5% $-90 | +10% $-39 |
| Rate | -1.0pp $-76 | -0.5pp $-108 | base $-141 | +0.5pp $-175 | +1.0pp $-209 |
UW: 25.0% down · 7.5% · 30yr · 1.5% tax · 5.0% vac · 8.0% maint · 8.0% mgmt
Financing live
Cash to close
- Down payment
- $32,250
- Closing costs
- $3,870
- Reserves months
- —
- Total cash needed
- —
Loan-product check · same deal, 3 products live
Conventional
25% down · 7.5% · 30yr
- Down + closing
- —
- Monthly P&I
- —
- Monthly cashflow
- —
- DSCR
- —
- Eligible?
- —
Personal DTI + credit; lowest rate.
DSCR
20% down · 8.5% · 30yr
- Down + closing
- —
- Monthly P&I
- —
- Monthly cashflow
- —
- DSCR
- —
- Eligible?
- —
No personal income docs; deal must DSCR.
Hard money
10% down · 12.0% · 12mo
- Down + closing
- —
- Monthly P&I
- —
- Monthly cashflow
- —
- DSCR
- —
- Eligible?
- —
Short-term bridge; refi at stabilization.
Rent comps 2 comps
| Address | Beds | Baths | Sqft | Rent | $/sqft | DOM | Units | Dist |
|---|---|---|---|---|---|---|---|---|
| 15656 Walden Rd Montgomery, TX | 1.0 | 1.0 | 706 | $1,160 | $1.64 | 45d | 1 | 1.08mi |
| 15650 Walden Rd Montgomery, TX | 1.0–3.0 | 1.0–2.0 | 1044 | $999 | $0.96 | 0d | 28 | 1.16mi |
HOA detail condo
- Monthly dues
- $274 · $3,288/yr
- Likely covers
- pool
- Assessments
- None detected in remarks — confirm with the listing agent.
Listing history 30 events
-
2026-06-21days on market $129,000 Active 47 DOM
-
2026-06-18days on market $129,000 Active 44 DOM
-
2026-06-17days on market $129,000 Active 43 DOM
-
2026-06-16days on market $129,000 Active 42 DOM
-
2026-06-15pricedays on market $129,000 Active 41 DOM
-
2026-06-13days on market $133,000 Active 39 DOM
-
2026-06-13days on market $133,000 Active 38 DOM
-
2026-06-09days on market $133,000 Active 35 DOM
-
2026-06-08days on market $133,000 Active 34 DOM
-
2026-06-07days on market $133,000 Active 33 DOM
-
2026-06-04days on market $133,000 Active 30 DOM
-
2026-06-03days on market $133,000 Active 29 DOM
-
2026-06-02days on market $133,000 Active 28 DOM
-
2026-06-01days on market $133,000 Active 27 DOM
-
2026-05-31days on market $133,000 Active 26 DOM
-
2026-05-06$1,250
-
2026-05-05historical $1,300
-
2026-05-05$133,000 Active 454-char remark
-
2026-05-01historical
-
2026-04-29$1,300
-
2026-04-28historical $1,325
-
2026-04-09price $133,000
-
2026-03-24price $134,990
-
2026-02-04$1,325
-
2026-02-03$138,000 Active
-
2026-01-26historical $1,325
-
2026-01-26historical
-
2026-01-06$1,325
-
2025-11-07price $140,000
-
2025-09-23$145,000 Active
ⓘ Source: listings_history table (triggers on properties + properties_extension) + one-shot
backfill from property_details.listing_events for pre-trigger history.
Climate risk First Street
- Flood 5/10 Major FEMA zone X (unshaded) · 26% chance over 30 yrs
- Wildfire 4/10 Moderate
- Heat 8/10 Severe 7 d/yr ≥110°F today · 24 d/yr by 30 yrs out
- Wind 8/10 Severe 99% chance of damaging wind over 30 yrs
- Air quality 2/10 Low 1 unhealthy d/yr today · 1 by 30 yrs out
Nearby sold comps map
Loading sold comps map…
Walkable amenities ~0.75 mi
Loading nearby amenities…
Taxation est. · year 1
- Rental income
- $15,557
- − Mortgage interest
- −$7,226
- − Property taxes
- −$1,935
- − Insurance
- −$645
- − Repairs & maintenance
- −$1,245
- − Management
- −$1,245
- − HOA
- −$3,288
- − Depreciation
- −$3,753
- Taxable loss
- −$3,779
- Est. tax savings @ 24.0%
- +$907
- After-tax cash flow
- $-789/yr
For passive investors: Depreciation is non-cash, so a rental often shows a tax loss while cash-flowing — sheltering income. Rental losses are passive: they offset passive income freely, and up to $25,000/yr can offset ordinary (W-2) income if you actively participate and your MAGI is under $100k (phasing out to $0 by $150k); unused losses carry forward. On sale, claimed depreciation is recaptured at up to 25%, and gains may owe capital-gains tax (a 1031 exchange can defer both). Figures are a year-1 estimate at your 24.0% rate — not tax advice; consult a CPA.
Condition & rehab AI · 12 photos
This 1-bedroom condo is in good condition with minimal repairs needed. Painting and landscaping improvements would significantly enhance its curb appeal and value.
Value-add opportunities
- Both Painting exterior and interior — Fresh paint enhances curb appeal and interior aesthetics
- Both Landscaping improvements — Well-maintained landscaping enhances curb appeal and property value
- Both Replace ceiling fans with energy-efficient models — Energy-efficient fans reduce utility costs and improve comfort
- Both Replace window treatments — New window treatments improve energy efficiency and aesthetics
- Both Replace flooring in living room — New flooring enhances the living space and increases resale value
Renovation cost estimate screening
Value-add ROI direction
- Both Painting exterior and interior — Fresh paint enhances curb appeal and interior aesthetics ↑
- Both Landscaping improvements — Well-maintained landscaping enhances curb appeal and property value ↑
- Both Replace ceiling fans with energy-efficient models — Energy-efficient fans reduce utility costs and improve comfort ↑
- Both Replace window treatments — New window treatments improve energy efficiency and aesthetics ↑
- Both Replace flooring in living room — New flooring enhances the living space and increases resale value ↑
ⓘ Cost ranges are severity-bucket heuristics (US national rule-of-thumb). Get contractor quotes + a written scope before underwriting a rehab budget.
Schools (NCES district)
- District
- Montgomery ISD
- NCES district ID
- 4831260
- Math proficiency
- 63% ▼ -3.00%
- Reading proficiency
- 57% ▼ -3.00%
- Median HH income
- $75,596
- Composite
- 53.55/100
- National rank
- #1445
- State rank
- #49 of 826 in TX
Livability — Conroe
- Score
- 74/100
- State rank
- #169
- US rank
- #4447
Category grades
Schools grade is shown separately in the Schools card above.
Census & demographics
- County
- Montgomery County · 663,713 people
- City population
- 205,417
- Metro
- Houston-The Woodlands-Sugar Land, TX
- Population (ZIP)
- 32,583
- Household income
- $106,804
- Rent vs Own
- Severe rent burden
- 414.0
Population outlook (Montgomery County) Hauer SSP2
- Today (2025)
- 713,896 people
- By 2030
- 805,263 · +12.8%
- By 2040
- 992,708 · +39.1%
- By 2050
- 1,179,590 · +65.2%
- By 2075
- 1,628,084 · +128.1%
- By 2100
- 1,937,880 · +171.5%
Race, ethnicity, and origin ACS 2023
- Neighborhood character
- Predominantly White (87%)
- Race & ethnicity
- White 87% Two or more races 5% Hispanic / Latino 5% Black 4%
- Common ancestry
- Lithuanian 8% Slovak 2% Romanian 2%
- Foreign-born
- 3% · Canada, China
- Languages at home
- 96% English-only · Spanish 3%
Political lean MEDSL · Montgomery
- 2024 margin
- Solid R (+45.5) · D 26.8% · R 72.3%
- 2008→2024 swing
- +7.2pp toward D · 2008: -52.7pp · 2024: -45.5pp
- All cycles
- 2024: R+45.5 2020: R+43.8 2016: R+51.4 2012: R+60.7 2008: R+52.7
Not yet ingested
- Civics
- —
Market trends
- HPI YoY
- ▼ -101.28%
- Current HPI
- 233.0032
- Rent YoY
- ▼ -3.30%
- Metro
- Houston-The Woodlands-Sugar Land, TX
- State GDP YoY
- ▲ 3.95%
- F500 in state
- 110
Industry mix (Fortune 500 HQ in TX)
| Industry | F500 HQs | Revenue |
|---|---|---|
| Energy | 16 | $1,198B |
|
||
| Technology | 5 | $198B |
|
||
| Engineering / Construction | 4 | $72B |
|
||
| Energy Services | 3 | $60B |
|
||
| Utilities | 3 | $41B |
|
||
| Healthcare | 2 | $330B |
|
||
Price history
-11.0% since first listed16 events — show timeline
- 2026-06-13 Price Changed $129,000 HARMLS
- 2026-05-06 Listed for Rent $1,250 HARMLS
- 2026-05-05 Rental Removed $1,300 HARMLS
- 2026-05-05 Listed $133,000 HARMLS
- 2026-05-01 Listing Removed — HARMLS
- 2026-04-29 Listed for Rent $1,300 HARMLS
- 2026-04-28 Rental Removed $1,325 HARMLS
- 2026-04-09 Price Changed $133,000 HARMLS
- 2026-03-24 Price Changed $134,990 HARMLS
- 2026-02-04 Listed for Rent $1,325 HARMLS
- 2026-02-03 Listed $138,000 HARMLS
- 2026-01-26 Rental Removed $1,325 HARMLS
- 2026-01-26 Listing Removed — HARMLS
- 2026-01-06 Listed for Rent $1,325 HARMLS
- 2025-11-07 Price Changed $140,000 HARMLS
- 2025-09-23 Listed $145,000 HARMLS
Cash-flow waterfall
monthlySold comps — $/sqft
last 12 mo · ≤1 miLoading sold comps…