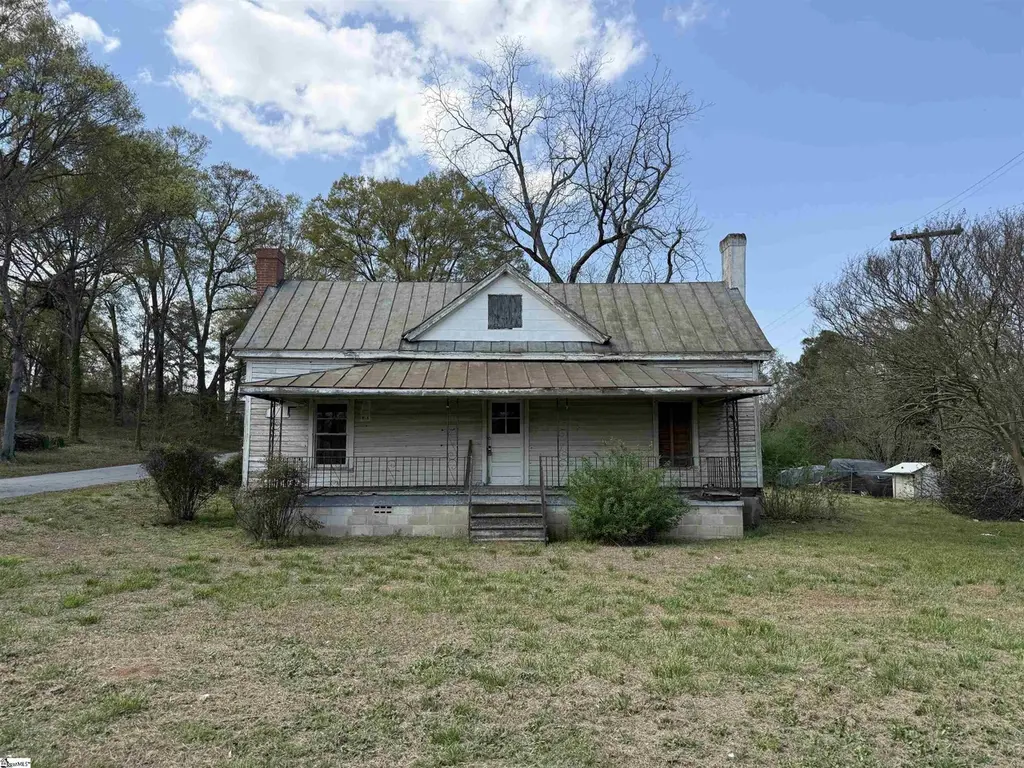
16 Ropp St · Gray Court, SC
Flood risk 1/10 · Minimal
- FEMA flood zone
- X (unshaded)
- Chance of flooding over 30 yrs
- 0.0%
- Est. flood insurance / yr
- $507 – $1,088
Fire risk 4/10 · Minor
- Est. fire insurance / yr
- $783 – $1,453
Heat risk 6/10 · Moderate
- Hot days now (above 105°F)
- 7 days/yr
- Hot days in 30 yrs
- 17 days/yr
Wind risk 3/10 · Minor
- Chance of severe wind over 30 yrs
- 6.0%
Air-quality risk 3/10 · Minor
- Unhealthy air days now
- 3 days/yr
- Unhealthy air days in 30 yrs
- 4 days/yr
Risk factors via First Street. Map © Google.
Why this score? — see what drove the B- grade
The composite is a weighted blend of 9 inputs, each scored 0–100. Each bar is that input's sub-score; the figure is the points it added to the 100-point composite (weight × sub-score).
- Cash flow +30.0/30.0
- 1% rule +10.0/10.0
- DSCR +10.0/10.0
- ARV discount +8.8/15.0
- Livability +2.6/5.0
- Rent growth +2.5/5.0
- Condition / age +2.5/5.0
- Schools +2.1/10.0
- Appreciation +0.0/10.0
$69,900
🖨 Deal sheet 📄 Offer letter ✓ Due diligence
Listing remarks MLS
SOLD AS IS.. This could be a beautiful house, Investor Special! remodel for a nice little house.
Key facts
- Demo completed
- Zoning
- Asbestos removed
Tags
Property features AI
Finance
- Other: Lead-based paint and residential property disclosures required
- HOA & community: No HOA amenities or fees listed
Exterior
- Parking: Unpaved driveway; No garage
- Utilities: Public water; Septic sewer; Water heater: Other (see remarks); Public garbage pickup
- Home design: Single-story home; Estimated age over 50 years; Crawl space foundation
- Construction: Metal roof
- Exterior features: Front porch; Corner, level lot; Lot dimensions approximately 75 x 186 x 83 x 184; Lot is 1/2 acre or less; Exterior finished in wood
Interior
- Kitchen: Kitchen approximately 15 x 15
- Bedrooms: Primary bedroom (14 x 15); Second bedroom (10 x 14); Two bedrooms on the main level
- Flooring: Hardwood floors
- Bathrooms: One full bathroom (main level)
- Heating & cooling: No central heating listed; Cooling: Other / see remarks
- Interior features: 9+ foot ceilings; Two fireplaces
- Laundry & utility: No dedicated laundry listed
Neighborhood map
What this means for you Summary
Snapshot
- This is a 2-bed/1.0-bath single-family listed at $70k.
Deal economics
- At list price, monthly cash flow is $1k ($13k/yr) — positive.
- The deal already cash-flows at list — no discount required.
- Meets the 1% rule at list price ($2k rent vs $70k).
- Recommended offer: $66k (6.0% below list) — sets the bar for market timing.
- Cap rate 25.2% vs local median 4.1% in Gray Court — top-decile yield for the area; either an underpriced asset or a hidden risk that comps aren't pricing in. Stress-test before assuming the spread holds.
Location & tenants
- Location reads 52/100 on livability (#347 in SC) — a working-class tenant base; expect higher turnover. Strengths: cost of living A+, housing A+; Watch: crime F, amenities F, commute F.
- Laurens 55 (rural): math 20% / reading 29% proficiency, ranked #63 of 80 in SC (top 79%) — low school quality limits family demand, transient renter base, plan for 1-2y turnover; 62% free/reduced lunch — lower-income household profile, screen leases tightly.
- Zoned schools: Gray Court-Owings Elementary/Middle (math 16% / reading 24%, grade F, #492 of 597 statewide, top 83%, 763 students, 100% FRL) — zoned schools average 100% FRL vs 62% district-wide (38 pts higher); higher-poverty schools than district average — tighter screening recommended.
- Market conditions: 170 active listings in the ZIP; 621 units permitted in Laurens County in 2024 (0 in 5+ unit buildings).
Forward outlook
- Local home prices are declining (-3.0%/yr); year-one equity from $483 of loan paydown is wiped out by about $2k of value loss. Plan a longer hold.
- Laurens County population projected to shrink 7% by 2050 — rents likely to lag national; underwrite the cash flow, not the appreciation.
- At projected returns (-3.0% appreciation + 3.0% rent growth), your $20k cash investment doubles in ~2 years — after that, you're playing with house money.
Negotiation context
- It's been on market 67 days — a 6% lower offer ($66k) is reasonable based on typical stale-listing flexibility.
- 3 sale attempts since 6y ago with the ask held roughly flat each time — persistent listings suggest the price (not the market) is what's stuck; bring a comps-based counter.
- Current owner paid $20k; list at $70k implies a 258% gain — meaningful room to come down on a strong offer.
Risks & watch-outs
- Climate carrying-cost: extreme-heat days projected 7→17/yr by 2055 (HVAC capex compounding) — expect insurance premiums to compound above CPI over the hold.
Questions for the listing agent
- It's been on market 67 days. Have you received any prior offers? Is the seller open to a 6% concession, seller financing, or rate buy-down credit?
- Why hasn't it sold? Are there any deal-killer items the seller is aware of (foundation, flood, title, zoning, code violations)?
- Is there a deadline driving the sale (1031 exchange, divorce, estate, relocation)? That informs how much negotiation room exists.
- Schools are F-rated, which usually means shorter tenancies and higher turnover. Who's the typical renter profile here, and what's been the actual vacancy rate?
- Crime grade is F in this area — have there been break-ins, vandalism, or insurance claims at this property in the last 3 years? What carrier currently insures it and at what premium?
- What's the average days-on-market for RENTAL listings here right now (not sales)? A rising rental-DOM trend means longer vacancies and softer asking-rent achievability than the comps imply.
- What's the recent tenant-quality profile in this submarket — average credit score on applications, eviction rate, late-payment / NSF rate, and stable-employment percentage? A property-management company in the area should have these aggregated.
- How much new for-sale + rental construction is in the pipeline within 1–3 miles? Heavy new supply typically softens prices + rents 12–24 months out; constrained supply supports both.
Investment metrics
- 1% rule
- 2.87% ✓
- Cap rate
- 25.23%
- Cash-on-cash
- 67.62%
- DSCR
- 4.01
- GRM
- 2.9
CMA / ARV
- ARV (on-the-fly)
- $72,000
- Comps found
- 1
Show comp detail 1 sale within ~0.75 mi
| Address | Dist | Beds/Ba | Sqft | Sold | Price | $/sf | Match |
|---|---|---|---|---|---|---|---|
| 15 Ropp St | 0.03mi | 2/2.0 | 1,200 (0%) | 4mo | $72,000 | $60 | 91 |
Match score weights: distance 35% · size 25% · config 20% · recency 20%. Top-matched comps best support the ARV.
Projected returns pro-forma
-3.0% appreciation · 3.0% rent growth · sell at horizon
- IRR
- 67.0%
- Equity multiple
- 4.01×
- Total profit
- $58,946
- Equity at exit
- $10,422
- IRR
- 71.2%
- Equity multiple
- 8.25×
- Total profit
- $141,901
- Equity at exit
- $6,044
Cash invested: $19,572 (down + closing). Projections, not guarantees.
Landlord ↔ Tenant lean methodology
- Overall (STATE)
- 90 Strongly Landlord-Friendly
- State South Carolina
- 90 Strongly Landlord-Friendly · R+6
- County
- — inherits STATE
- City
- — inherits STATE
ZIP-level market 29645
- Home prices YoY
- -21.9%
- Active inventory
- 170
- Price-to-rent
- 2.9×
Monthly cashflow live
- Estimated rent
- $2,008 medium interval (Pro) →
- Mortgage (P&I)
- −$367
- Tax est. 1.5%
- −$87 /mo · $1,048/yr
- Insurance
- −$29
- HOA
- −$0
- Vacancy / Maint / Mgmt
- −$422
- Net cashflow
- $1,103
Break-even live
UW: 25.0% down · 7.5% · 30yr · 1.5% tax · 5.0% vac · 8.0% maint · 8.0% mgmt
Financing live
Cash to close
- Down payment
- $17,475
- Closing costs
- $2,097
- Reserves months
- —
- Total cash needed
- —
Loan-product check · same deal, 3 products live
Conventional
25% down · 7.5% · 30yr
- Down + closing
- —
- Monthly P&I
- —
- Monthly cashflow
- —
- DSCR
- —
- Eligible?
- —
Personal DTI + credit; lowest rate.
DSCR
20% down · 8.5% · 30yr
- Down + closing
- —
- Monthly P&I
- —
- Monthly cashflow
- —
- DSCR
- —
- Eligible?
- —
No personal income docs; deal must DSCR.
Hard money
10% down · 12.0% · 12mo
- Down + closing
- —
- Monthly P&I
- —
- Monthly cashflow
- —
- DSCR
- —
- Eligible?
- —
Short-term bridge; refi at stabilization.
Listing history 22 events
-
2026-06-19days on market $69,900 Active 67 DOM
-
2026-06-18days on market $69,900 Active 66 DOM
-
2026-06-17days on market $69,900 Active 65 DOM
-
2026-06-16days on market $69,900 Active 64 DOM
-
2026-06-15days on market $69,900 Active 63 DOM
-
2026-06-14days on market $69,900 Active 61 DOM
-
2026-06-12days on market $69,900 Active 60 DOM
-
2026-06-09days on market $69,900 Active 57 DOM
-
2026-06-08days on market $69,900 Active 56 DOM
-
2026-06-07days on market $69,900 Active 55 DOM
-
2026-06-07days on market $69,900 Active 54 DOM
-
2026-06-03days on market $69,900 Active 51 DOM
-
2026-06-02days on market $69,900 Active 50 DOM
-
2026-06-01days on market $69,900 Active 49 DOM
-
2026-05-31days on market $69,900 Active 48 DOM
-
2026-05-30days on market $69,900 Active 47 DOM
-
2026-05-07status Active
-
2026-04-18status Pending
-
2026-03-25$69,900 Active
-
2020-04-23soldstatus $19,500 Sold 97-char remark
Show marketing remark (97 chars)
SOLD AS IS.. This could be a beautiful house, Investor Special! remodel for a nice little house.
-
2020-04-10status Pending 97-char remark
Show marketing remark (97 chars)
SOLD AS IS.. This could be a beautiful house, Investor Special! remodel for a nice little house.
-
2020-04-06$29,900 Active 97-char remark
Show marketing remark (97 chars)
SOLD AS IS.. This could be a beautiful house, Investor Special! remodel for a nice little house.
ⓘ Source: listings_history table (triggers on properties + properties_extension) + one-shot
backfill from property_details.listing_events for pre-trigger history.
Climate risk First Street
- Flood 1/10 Low FEMA zone X (unshaded) · 0% chance over 30 yrs
- Wildfire 4/10 Moderate
- Heat 6/10 Major 7 d/yr ≥105°F today · 17 d/yr by 30 yrs out
- Wind 3/10 Moderate 6% chance of damaging wind over 30 yrs
- Air quality 3/10 Moderate 3 unhealthy d/yr today · 4 by 30 yrs out
Nearby sold comps map
Loading sold comps map…
Walkable amenities ~0.75 mi
Loading nearby amenities…
Taxation est. · year 1
- Rental income
- $24,090
- − Mortgage interest
- −$3,915
- − Property taxes
- −$1,048
- − Insurance
- −$350
- − Repairs & maintenance
- −$1,927
- − Management
- −$1,927
- − Depreciation
- −$2,033
- Taxable income
- $12,889
- Est. tax owed @ 24.0%
- −$3,093
- After-tax cash flow
- $10,141/yr
For passive investors: Depreciation is non-cash, so a rental often shows a tax loss while cash-flowing — sheltering income. Rental losses are passive: they offset passive income freely, and up to $25,000/yr can offset ordinary (W-2) income if you actively participate and your MAGI is under $100k (phasing out to $0 by $150k); unused losses carry forward. On sale, claimed depreciation is recaptured at up to 25%, and gains may owe capital-gains tax (a 1031 exchange can defer both). Figures are a year-1 estimate at your 24.0% rate — not tax advice; consult a CPA.
Schools (NCES district)
- District
- Laurens 55
- NCES district ID
- 4502610
- Math proficiency
- 20% ▼ -11.00%
- Reading proficiency
- 29% ▼ -7.00%
- Median HH income
- $39,174
- Composite
- 20.58/100
- National rank
- #8555
- State rank
- #63 of 80 in SC
Livability — Gray Court
- Score
- 52/100
- State rank
- #347
- US rank
- #24818
Category grades
Schools grade is shown separately in the Schools card above.
Census & demographics
- Census place
- Gray Court, SC
- Population (ZIP)
- 11,212
Population outlook (Laurens County) Hauer SSP2
- Today (2025)
- 66,741 people
- By 2030
- 66,454 · -0.4%
- By 2040
- 64,881 · -2.8%
- By 2050
- 61,941 · -7.2%
- By 2075
- 53,266 · -20.2%
- By 2100
- 41,495 · -37.8%
Race, ethnicity, and origin ACS 2023
- Neighborhood character
- Predominantly White (74%)
- Race & ethnicity
- White 74% Black 12% Hispanic / Latino 11% Two or more races 6%
- Hispanic origin (detail)
- Mexican 9% Cuban 1%
- Common ancestry
- Slovak 3% Romanian 1% Serbian 1%
- Foreign-born
- 5% · Canada, Jamaica
- Languages at home
- 90% English-only · Spanish 9% French/Haitian/Cajun 1%
Political lean MEDSL · Laurens
- 2024 margin
- Solid R (+40.9) · D 29.0% · R 69.9% · Other 1.1%
- 2008→2024 swing
- -22.8pp toward R · 2008: -18.1pp · 2024: -40.9pp
- All cycles
- 2024: R+40.9 2020: R+32.3 2016: R+29.9 2012: R+17.5 2008: R+18.1
Not yet ingested
- Civics
- —
Market trends
- HPI YoY
- ▼ -46.90%
- Current HPI
- 166.9585
- Rent YoY
- —
- Metro
- —
- State GDP YoY
- ▲ 4.51%
- F500 in state
- 2
Industry mix (Fortune 500 HQ in SC)
| Industry | F500 HQs | Revenue |
|---|---|---|
| Packaging | 1 | $7B |
|
||
Price history
+133.8% since first listed6 events — show timeline
- 2026-05-07 Relisted — Greater Greenville MLS
- 2026-04-18 Pending — Greater Greenville MLS
- 2026-03-25 Listed $69,900 Greater Greenville MLS
- 2020-04-23 Sold (MLS) $19,500 Greater Greenville MLS
- 2020-04-10 Pending — Greater Greenville MLS
- 2020-04-06 Listed $29,900 Greater Greenville MLS
Cash-flow waterfall
monthlySold comps — $/sqft
last 12 mo · ≤1 miLoading sold comps…