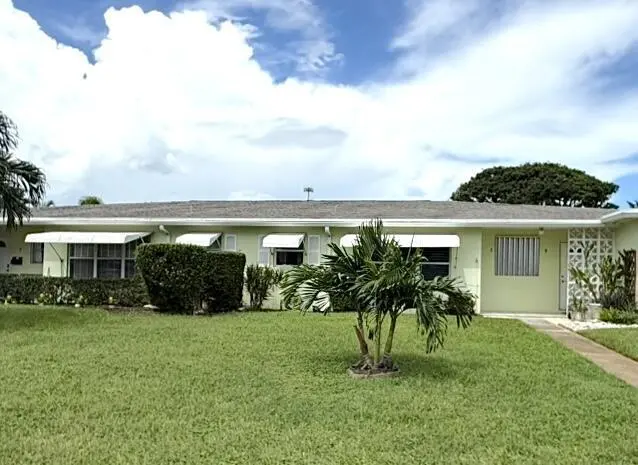
215 South Blvd Unit C · Boynton Beach, FL
Flood risk 1/10 · Minimal
- FEMA flood zone
- X (unshaded)
- Chance of flooding over 30 yrs
- 0.0%
- Est. flood insurance / yr
- $507 – $1,088
Fire risk 1/10 · Minimal
- Est. fire insurance / yr
- $947 – $1,759
Heat risk 10/10 · Severe
- Hot days now (above 105°F)
- 7 days/yr
- Hot days in 30 yrs
- 27 days/yr
Wind risk 10/10 · Severe
- Chance of severe wind over 30 yrs
- 99.0%
Air-quality risk 2/10 · Minimal
- Unhealthy air days now
- 1 days/yr
- Unhealthy air days in 30 yrs
- 2 days/yr
Risk factors via First Street. Map © Google.
Why this score? — see what drove the B grade
The composite is a weighted blend of 9 inputs, each scored 0–100. Each bar is that input's sub-score; the figure is the points it added to the 100-point composite (weight × sub-score).
- Cash flow +30.0/30.0
- 1% rule +10.0/10.0
- DSCR +10.0/10.0
- ARV discount +7.5/15.0
- Schools +4.3/10.0
- Livability +3.6/5.0
- Rent growth +3.4/5.0
- Condition / age +2.5/5.0
- Appreciation +0.0/10.0
$105,900
🖨 Deal sheet 📄 Offer letter ✓ Due diligence
Listing remarks
Welcome to this charming villa-style 1 bedroom, 1.5 bath condo located in a beautifully maintained 55+ community. This light and bright home features a newer kitchen with wood cabinets, and quartz countertops. The open layout includes a spacious primary suite with a walk-in closet and a full bath, plus an additional half bath for guests. Elegant plantation shutters enhance the living spaces. The community offers a clubhouse, pool, game room, and more. Conveniently located near shopping, dining, and major highways this villa is perfect for year-round living or a seasonal retreat.
Key facts
- $515 HOA
- Parking
- Community pool
Property features AI
Finance
- Other: Community is a senior community; Pets not allowed
- HOA & community: Monthly HOA dues; HOA amenities include billiard room, clubhouse, game room, pool, and internet included; HOA covers cable TV, grounds maintenance, sewer, trash, water, and common areas
Exterior
- Parking: Assigned parking; Guest parking; Total of 1 parking space
- Utilities: Public water; Public sewer; Three-phase electric; Cable available
- Home design: Condominium; Single-story; Faces south; Resale
- Construction: Built with CBS (concrete block) construction; Composition/shingle roof
- Exterior features: No waterfront
Interior
- Kitchen: Electric range; Dishwasher; Microwave; Refrigerator; Electric water heater
- Bedrooms: 1 bedroom on the main level
- Flooring: Carpet; Laminate
- Bathrooms: 1 full bathroom; 1 half bathroom
- Heating & cooling: Central electric heating; Central air conditioning (electric)
- Interior features: Walk-in closets; Plantation shutters; Furnished
Neighborhood map
What this means for you Summary
Snapshot
- This is a 1-bed/1.5-bath condo listed at $106k.
Deal economics
- At list price, monthly cash flow is $572 ($7k/yr) — positive.
- The deal already cash-flows at list — no discount required.
- Meets the 1% rule at list price ($2k rent vs $106k).
- Recommended offer: $103k (3.0% below list) — sets the bar for market timing.
Location & tenants
- Location reads 72/100 on livability (#351 in FL) — a middle-class / working-renter tenant base. Strengths: housing A+, health & safety B+, cost of living B; Watch: amenities D+, crime D-, commute F.
- Palm Beach (suburban): math 46% / reading 53% proficiency, ranked #34 of 73 in FL (top 47%) — families likely to look elsewhere, expect single-tenant / working-renter base with shorter leases.
- Zoned schools: Forest Park Elementary School (math 42% / reading 38%, grade F, #1,491 of 2,144 statewide, top 70%, 571 students, 81% FRL); Congress Community Middle School (math 21% / reading 28%, grade F, #522 of 571 statewide, top 93%, 988 students, 72% FRL); Boynton Beach Community High (math 13% / reading 25%, grade F, #565 of 667 statewide, top 85%, 1,547 students, 65% FRL) — zoned schools average 73% FRL vs 52% district-wide (21 pts higher); higher-poverty schools than district average — tighter screening recommended.
- Zoned-school proficiency averages 28% at this address vs 50% district-wide (-22 pts) — the specific schools serving this property underperform the Palm Beach average; the district grade overstates school quality for this exact location.
- Market conditions: Rents rising (+3.6%/yr); 536 active listings in the ZIP; 40 comparable units currently listed for rent nearby; rentals at typical pace (median 25d on market — plan ~3-4 weeks tenant-placement turnaround); 3,974 units permitted in Palm Beach County in 2024 (1,012 in 5+ unit buildings).
Forward outlook
- Local home prices are declining (-3.0%/yr); year-one equity from $732 of loan paydown is wiped out by about $3k of value loss. Plan a longer hold.
- Palm Beach County population projected at +30% by 2050 — long-run rental-demand tailwind backs the buy-and-hold thesis.
- At projected returns (-3.0% appreciation + 3.6% rent growth), your $30k cash investment doubles in ~6 years — after that, you're playing with house money.
Negotiation context
- It's been on market 44 days — a 3% lower offer ($103k) is reasonable based on typical stale-listing flexibility.
- 2 sale attempts; this cycle's ask has dropped $9k (8%) from the opening price — seller is motivated, your offer sets the floor, not the list.
- Current owner paid $60k; list at $106k implies a 76% gain — meaningful room to come down on a strong offer.
Risks & watch-outs
- Watch-outs: HOA is 24% of rent.
- Climate carrying-cost: severe wind risk, 99% chance of damaging wind over 30y; extreme-heat days projected 7→27/yr by 2055 (HVAC capex compounding) — expect insurance premiums to compound above CPI over the hold.
Questions for the listing agent
- It's been on market 44 days. Have you received any prior offers? Is the seller open to a 3% concession, seller financing, or rate buy-down credit?
- Built in 1968 — when were the roof, HVAC, electrical panel, plumbing, and water heater last replaced?
- What does the HOA fee cover, when was the last increase, and are there any pending special assessments or reserve-fund shortfalls?
- Any open or pending special assessments — roof, HVAC, plumbing, elevator, façade? What's the per-unit balance and payoff schedule, and is the seller paying it off at close or rolling it to the buyer?
- Is there a deadline driving the sale (1031 exchange, divorce, estate, relocation)? That informs how much negotiation room exists.
- Crime grade is D in this area — have there been break-ins, vandalism, or insurance claims at this property in the last 3 years? What carrier currently insures it and at what premium?
- What's the average days-on-market for RENTAL listings here right now (not sales)? A rising rental-DOM trend means longer vacancies and softer asking-rent achievability than the comps imply.
- What's the recent tenant-quality profile in this submarket — average credit score on applications, eviction rate, late-payment / NSF rate, and stable-employment percentage? A property-management company in the area should have these aggregated.
- How much new apartment / multifamily construction is in the pipeline within 1–3 miles? Heavy new supply (>2% of stock underway) typically softens rents 12–24 months out; light construction supports rent growth.
Investment metrics
- 1% rule
- 2.05% ✓
- Cap rate
- 12.77%
- Cash-on-cash
- 23.13%
- DSCR
- 2.03
- GRM
- 4.1
CMA / ARV
No comps found within radius.
Projected returns pro-forma
-3.0% appreciation · 3.64% rent growth · sell at horizon
- IRR
- 17.3%
- Equity multiple
- 1.71×
- Total profit
- $20,933
- Equity at exit
- $15,790
- IRR
- 26.5%
- Equity multiple
- 3.43×
- Total profit
- $72,095
- Equity at exit
- $9,156
Cash invested: $29,652 (down + closing). Projections, not guarantees.
Landlord ↔ Tenant lean methodology
- Overall (STATE)
- 87 Strongly Landlord-Friendly
- State Florida
- 87 Strongly Landlord-Friendly · R+3
- County
- — inherits STATE
- City
- — inherits STATE
ZIP-level market 33435
- Rents YoY
- 3.6%
- Active inventory
- 536
- Price-to-rent
- 4.1×
Monthly cashflow live
- Estimated rent
- $2,167 high interval (Pro) →
- Mortgage (P&I)
- −$555
- Tax from tax record
- −$26 /mo · $309/yr
- Insurance
- −$44
- HOA
- −$515
- Vacancy / Maint / Mgmt
- −$455
- Net cashflow
- $572
Break-even live
UW: 25.0% down · 7.5% · 30yr · 1.5% tax · 5.0% vac · 8.0% maint · 8.0% mgmt
Financing live
Cash to close
- Down payment
- $26,475
- Closing costs
- $3,177
- Reserves months
- —
- Total cash needed
- —
Loan-product check · same deal, 3 products live
Conventional
25% down · 7.5% · 30yr
- Down + closing
- —
- Monthly P&I
- —
- Monthly cashflow
- —
- DSCR
- —
- Eligible?
- —
Personal DTI + credit; lowest rate.
DSCR
20% down · 8.5% · 30yr
- Down + closing
- —
- Monthly P&I
- —
- Monthly cashflow
- —
- DSCR
- —
- Eligible?
- —
No personal income docs; deal must DSCR.
Hard money
10% down · 12.0% · 12mo
- Down + closing
- —
- Monthly P&I
- —
- Monthly cashflow
- —
- DSCR
- —
- Eligible?
- —
Short-term bridge; refi at stabilization.
Rent comps 40 comps
| Address | Beds | Baths | Sqft | Rent | $/sqft | DOM | Units | Dist |
|---|---|---|---|---|---|---|---|---|
| 255 South Blvd Unit D Boynton Beach, FL | 2.0 | 2.0 | 1104 | $2,100 | $1.90 | 24d | 1 | 0.13mi |
| 255 South Blvd Unit D Boynton Beach, FL | 2.0 | 2.0 | 1104 | $1,975 | $1.79 | 3d | 1 | 0.13mi |
| 200 Main Blvd Unit 2D Boynton Beach, FL | 2.0 | 2.0 | 1104 | $1,200 | $1.09 | 17d | 1 | 0.26mi |
| 405 SE 20th Ave Unit 12E Boynton Beach, FL | 2.0 | 1.0 | 975 | $1,889 | $1.94 | 24d | 1 | 0.37mi |
| 405 SE 20th Ave Unit 5F Boynton Beach, FL | — | 1.0 | 600 | $1,489 | $2.48 | 22d | 1 | 0.47mi |
| 405 SE 20th Ave Apt 1C Boynton Beach, FL | 2.0 | 1.0 | 975 | $1,949 | $2.00 | 24d | 1 | 0.47mi |
| 405 SE 20th Ave Unit 6D Boynton Beach, FL | 2.0 | 1.0 | 975 | $1,889 | $1.94 | 7d | 1 | 0.47mi |
| 127 SW 10th Ave Boynton Beach, FL | 2.0 | 1.5 | 754 | $3,500 | $4.64 | 15d | 1 | 0.52mi |
| 2301 SE 4th St #11 Boynton Beach, FL | 1.0 | 1.0 | 573 | $1,595 | $2.78 | 24d | 1 | 0.53mi |
| 2301 SE 4th St Unit 15 Boynton Beach, FL | 1.0 | 1.0 | 573 | $1,545 | $2.70 | 24d | 1 | 0.53mi |
| 515 SE 20th Ave Boynton Beach, FL | 2.0 | 1.0 | 787 | $1,689 | $2.14 | 7d | 3 | 0.53mi |
| 523 SE 20th Ct Unit 5 Boynton Beach, FL | 1.0 | 1.0 | 755 | $1,750 | $2.32 | 24d | 1 | 0.56mi |
| 2303 S Federal Hwy #19 Boynton Beach, FL | 1.0 | 1.0 | 615 | $1,450 | $2.36 | 5d | 1 | 0.61mi |
| 1351 S Federal Hwy Boynton Beach, FL | 1.0–3.0 | 1.0–2.0 | 1394 | $2,090 | $1.50 | 1d | 32 | 0.63mi |
| 3302 Tuscany Way Boynton Beach, FL | 2.0 | 1.0 | 933 | $2,900 | $3.11 | 24d | 1 | 0.65mi |
| 2861 S Seacrest Blvd Boynton Beach, FL | 1.0 | 1.0 | 710 | $1,680 | $2.37 | 2d | 3 | 0.68mi |
| 2016 S Federal Hwy #206 Boynton Beach, FL | 2.0 | 2.0 | 963 | $2,300 | $2.39 | 24d | 1 | 0.69mi |
| 2016 S Federal Hwy #404 Boynton Beach, FL | 2.0 | 2.0 | 963 | $2,300 | $2.39 | 15d | 1 | 0.69mi |
| 2016 S Federal Hwy #204 Boynton Beach, FL | 2.0 | 2.0 | 963 | $1,995 | $2.07 | 7d | 1 | 0.69mi |
| 2006 S Federal Hwy #401 Boynton Beach, FL | 2.0 | 2.0 | 963 | $2,400 | $2.49 | 24d | 1 | 0.69mi |
| 2120 Tuscany Way Boynton Beach, FL | 2.0 | 2.0 | 1017 | $2,650 | $2.61 | 24d | 1 | 0.69mi |
| 2220 Tuscany Way Unit 2220 Boynton Beach, FL | 2.0 | 2.0 | 1030 | $2,850 | $2.77 | 24d | 1 | 0.69mi |
| 100 Newlake Dr Boynton Beach, FL | 1.0–3.0 | 1.0–2.0 | 1261 | $1,950 | $1.55 | 1d | 22 | 0.70mi |
| 2412 Tuscany Way Boynton Beach, FL | 1.0 | 1.0 | 750 | $3,000 | $4.00 | 24d | 1 | 0.70mi |
| 624 Snug Harbor Dr Unit B7 Boynton Beach, FL | 2.0 | 2.0 | 858 | $1,950 | $2.27 | 24d | 1 | 0.71mi |
| 651 E Woolbright Rd #103 Boynton Beach, FL | 2.0 | 2.0 | 1009 | $2,650 | $2.63 | 17d | 1 | 0.71mi |
| 661 E Woolbright Rd Boynton Beach, FL | 2.0 | 2.0 | 1095 | $3,093 | $2.82 | 3d | 1 | 0.72mi |
| 4411 Tuscany Way #4411 Boynton Beach, FL | 2.0 | 2.0 | 1030 | $2,400 | $2.33 | 24d | 1 | 0.72mi |
| 1407 Tuscany Way #1407 Boynton Beach, FL | 1.0 | 1.0 | 721 | $2,100 | $2.91 | 3d | 1 | 0.72mi |
| 2004 S Federal Hwy #102 Boynton Beach, FL | 2.0 | 2.0 | 963 | $2,400 | $2.49 | 24d | 1 | 0.73mi |
| 630 E Woolbright Rd Apt 220 Boynton Beach, FL | 1.0 | 1.0 | 768 | $2,915 | $3.80 | 16d | 1 | 0.74mi |
| 630 E Woolbright Rd Apt 902 Boynton Beach, FL | 1.0 | 1.0 | 768 | $3,040 | $3.96 | 24d | 1 | 0.74mi |
| 630 E Woolbright Rd Apt 412 Boynton Beach, FL | 1.0 | 1.0 | 768 | $2,790 | $3.63 | 24d | 1 | 0.74mi |
| 1575 SW 8th St Boynton Beach, FL | 1.0–3.0 | 1.0–2.0 | 1104 | $1,905 | $1.72 | 2d | 25 | 0.74mi |
| 631 E Woolbright Rd Boynton Beach, FL | 1.0 | 1.0 | 786 | $3,025 | $3.85 | 24d | 1 | 0.76mi |
| 640 Snug Harbor Dr Unit F3 Boynton Beach, FL | 1.0 | 1.0 | 629 | $2,500 | $3.97 | 11d | 1 | 0.78mi |
| 638 Snug Harbor Dr Boynton Beach, FL | 1.0–2.0 | 1.0–2.0 | 747 | $1,600 | $2.14 | 24d | 2 | 0.78mi |
| 1006 SE 4th St Boynton Beach, FL | 2.0 | 1.0 | 900 | $2,300 | $2.56 | 24d | 1 | 0.80mi |
| 1001 S Federal Hwy Unit 3 Boynton Beach, FL | 1.0 | 1.0 | 650 | $1,995 | $3.07 | 24d | 1 | 0.82mi |
| 615 Villa Cir Boynton Beach, FL | 2.0 | 2.0 | 1008 | $2,500 | $2.48 | 24d | 1 | 0.82mi |
HOA detail condo
- Monthly dues
- $515 · $6,180/yr
- Likely covers
- pool
- Assessments
- None detected in remarks — confirm with the listing agent.
Listing history 20 events
-
2026-06-18days on market $105,900 Active 44 DOM
-
2026-06-17pricedays on market $105,900 Active 43 DOM
-
2026-06-16days on market $114,900 Active 42 DOM
-
2026-06-15days on market $114,900 Active 41 DOM
-
2026-06-13days on market $114,900 Active 39 DOM
-
2026-06-09days on market $114,900 Active 35 DOM
-
2026-06-08days on market $114,900 Active 34 DOM
-
2026-06-07days on market $114,900 Active 33 DOM
-
2026-06-04days on market $114,900 Active 30 DOM
-
2026-06-03days on market $114,900 Active 29 DOM
-
2026-06-02days on market $114,900 Active 28 DOM
-
2026-06-01days on market $114,900 Active 27 DOM
-
2026-05-31days on market $114,900 Active 26 DOM
-
2026-05-05$114,900 Active
-
2025-12-27historical
-
2025-10-07price $119,900
-
2025-09-25$129,900 Active
-
2025-09-24historical
-
2009-09-09soldstatus $60,000
-
1990-02-01soldstatus $34,000
ⓘ Source: listings_history table (triggers on properties + properties_extension) + one-shot
backfill from property_details.listing_events for pre-trigger history.
Tax reassessment forecast FL · Resets to sale price
- Current annual tax
- $309 · $26/mo
- Projected year-2 tax
- $879 · $73/mo
- Expected delta
- +$570/yr (+$47/mo · 184.1%)
ⓘ Screening estimate from a state-policy table — verify with the county assessor before closing.
Climate risk First Street
- Flood 1/10 Low FEMA zone X (unshaded) · 0% chance over 30 yrs
- Wildfire 1/10 Low
- Heat 10/10 Extreme 7 d/yr ≥105°F today · 27 d/yr by 30 yrs out
- Wind 10/10 Extreme 99% chance of damaging wind over 30 yrs
- Air quality 2/10 Low 1 unhealthy d/yr today · 2 by 30 yrs out
Nearby sold comps map
Loading sold comps map…
Walkable amenities ~0.75 mi
Loading nearby amenities…
Taxation est. · year 1
- Rental income
- $26,003
- − Mortgage interest
- −$5,932
- − Property taxes
- −$309
- − Insurance
- −$530
- − Repairs & maintenance
- −$2,080
- − Management
- −$2,080
- − HOA
- −$6,180
- − Depreciation
- −$3,081
- Taxable income
- $5,811
- Est. tax owed @ 24.0%
- −$1,395
- After-tax cash flow
- $5,465/yr
For passive investors: Depreciation is non-cash, so a rental often shows a tax loss while cash-flowing — sheltering income. Rental losses are passive: they offset passive income freely, and up to $25,000/yr can offset ordinary (W-2) income if you actively participate and your MAGI is under $100k (phasing out to $0 by $150k); unused losses carry forward. On sale, claimed depreciation is recaptured at up to 25%, and gains may owe capital-gains tax (a 1031 exchange can defer both). Figures are a year-1 estimate at your 24.0% rate — not tax advice; consult a CPA.
Schools (NCES district)
- District
- Palm Beach
- NCES district ID
- 1201500
- Math proficiency
- 46% ▼ -16.00%
- Reading proficiency
- 53% ▼ -4.00%
- Median HH income
- $53,943
- Composite
- 42.72/100
- National rank
- #3160
- State rank
- #34 of 73 in FL
Livability — Boynton Beach
- Score
- 72/100
- State rank
- #351
- US rank
- #6098
Category grades
Schools grade is shown separately in the Schools card above.
Census & demographics
- Census place
- Boynton Beach, FL
- County
- Palm Beach County · 1,438,312 people
- City population
- 148,060
- Metro
- Miami-Fort Lauderdale-Pompano Beach, FL
- Population (ZIP)
- 37,833
- Household income
- $67,979
- Rent vs Own
- Severe rent burden
- 1623.0
Population outlook (Palm Beach County) Hauer SSP2
- Today (2025)
- 1,637,487 people
- By 2030
- 1,743,255 · +6.5%
- By 2040
- 1,948,712 · +19.0%
- By 2050
- 2,132,979 · +30.3%
- By 2075
- 2,530,027 · +54.5%
- By 2100
- 2,706,979 · +65.3%
Race, ethnicity, and origin ACS 2023
- Neighborhood character
- Diverse neighborhood (Simpson 0.65)
- Race & ethnicity
- White 41% Black 40% Hispanic / Latino 15% Two or more races 10%
- Hispanic origin (detail)
- Mexican 3% Puerto Rican 3% Cuban 2% Dominican 1%
- Common ancestry
- Hispanic 23% Romanian 2% Lithuanian 2%
- Foreign-born
- 30% · Canada, Jamaica
- Languages at home
- 61% English-only · French/Haitian/Cajun 24% Spanish 11% Other Indo-European 2%
Political lean MEDSL · Palm Beach
- 2024 margin
- Toss-up / Even · D 50.0% · R 49.2%
- 2008→2024 swing
- -22.1pp toward R · 2008: 22.9pp · 2024: 0.8pp
- All cycles
- 2024: D+0.8 2020: D+12.8 2016: D+15.3 2012: D+17.0 2008: D+22.9
Not yet ingested
- Civics
- —
Market trends
- HPI YoY
- ▼ -345.86%
- Current HPI
- 371.0527
- Rent YoY
- ▲ 3.64%
- Metro
- Miami-Fort Lauderdale-Pompano Beach, FL
- State GDP YoY
- ▲ 3.28%
- F500 in state
- 36
Industry mix (Fortune 500 HQ in FL)
| Industry | F500 HQs | Revenue |
|---|---|---|
| Industrial Technology | 2 | $29B |
|
||
| Insurance | 2 | $17B |
|
||
| Retail | 1 | $60B |
|
||
| Technology Distribution | 1 | $58B |
|
||
| Homebuilding | 1 | $35B |
|
||
| Technology Manufacturing | 1 | $35B |
|
||
Price history
+237.9% since first listed7 events — show timeline
- 2026-05-05 Listed $114,900 Beaches MLS
- 2025-12-27 Listing Removed — Beaches MLS
- 2025-10-07 Price Changed $119,900 Beaches MLS
- 2025-09-25 Listed $129,900 Beaches MLS
- 2025-09-24 Coming Soon — Beaches MLS
- 2009-09-09 Sold (Public Records) $60,000 Public Records
- 1990-02-01 Sold (Public Records) $34,000 Public Records
Property tax history
+3.7%/yrLatest (2025): $309 · +10.0% YoY. Source: county tax records.
Cash-flow waterfall
monthlySold comps — $/sqft
last 12 mo · ≤1 miLoading sold comps…