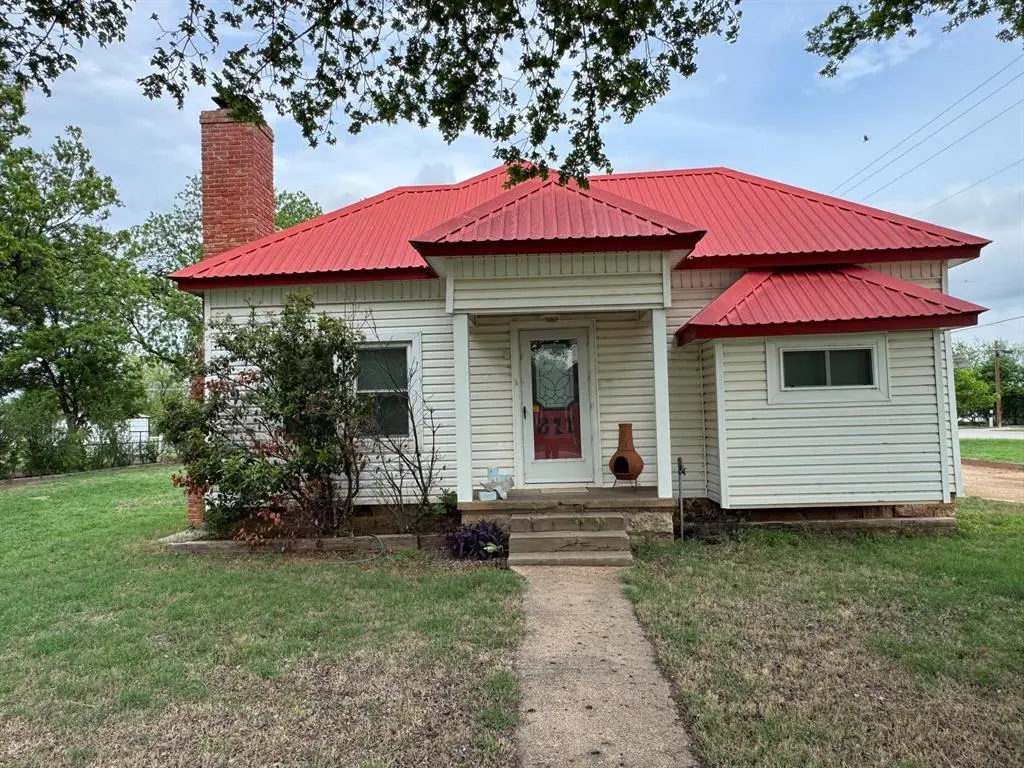
311 S Cedar St · Seymour, TX
Flood risk 1/10 · Minimal
- FEMA flood zone
- —
- Chance of flooding over 30 yrs
- 0.0%
- Est. flood insurance / yr
- —
Fire risk 7/10 · Major
- Est. fire insurance / yr
- $1,222 – $2,270
Heat risk 7/10 · Major
- Hot days now (above 108°F)
- 7 days/yr
- Hot days in 30 yrs
- 20 days/yr
Wind risk 3/10 · Minor
- Chance of severe wind over 30 yrs
- 8.0%
Air-quality risk 1/10 · Minimal
- Unhealthy air days now
- 0 days/yr
- Unhealthy air days in 30 yrs
- 0 days/yr
Risk factors via First Street. Map © Google.
Why this score? — see what drove the D grade
The composite is a weighted blend of 9 inputs, each scored 0–100. Each bar is that input's sub-score; the figure is the points it added to the 100-point composite (weight × sub-score).
- Cash flow +13.6/30.0
- Appreciation +8.6/10.0
- Schools +4.2/10.0
- DSCR +4.1/10.0
- Livability +3.7/5.0
- 1% rule +3.2/10.0
- Rent growth +2.5/5.0
- Condition / age +2.5/5.0
- ARV discount +0.0/15.0
$125,000
🖨 Deal sheet (PDF) 📄 Offer letter ✓ Due diligence
Listing remarks MLS
Welcome to this charming 2-bedroom, 2-bath home situated on a corner lot. The inviting living room features a large fireplace, creating a warm and welcoming atmosphere. The kitchen comes fully equipped with all appliances, and the laundry room includes a washer and dryer for added convenience. Exterior highlights include low-maintenance vinyl siding, a durable metal roof, a covered patio, and a double carport. Outdoor enthusiasts will appreciate the greenhouse and the 20×60 shop for storage or workspace.
Key facts
- Durable metal roof
- Large fireplace
- Covered patio
Tags
Neighborhood map
What this means for you Summary
Snapshot
- This is a 2-bed/2.0-bath single-family listed at $125k.
Deal economics
- At list price, monthly cash flow is $6 ($75/yr) — positive.
- The deal already cash-flows at list — no discount required.
- To meet the 1% rule (rent ≥ 1% of price), the offer needs to be $102k (18.2% below list).
- Recommended offer: $102k (18.2% below list) — sets the bar for 1% rule.
Location & tenants
- Location reads 74/100 on livability (#191 in TX, #4,884 nationally) — a middle-class / working-renter tenant base. Strengths: cost of living A+, housing A+, crime A-; Watch: health & safety C-, employment D, amenities F.
- Seymour ISD (rural): math 55% / reading 46% proficiency, ranked #195 of 826 in TX (top 24%) — acceptable for families but not a draw, mixed tenant base, ~2y average lease.
- Zoned schools: Seymour El (math 52% / reading 37%, grade F, #1,155 of 4,322 statewide, top 29%, 277 students, 65% FRL); Seymour Middle (math 52% / reading 47%, grade C, #356 of 1,662 statewide, top 23%, 190 students, 64% FRL); Seymour H S (math 74% / reading 54%, grade B-, #199 of 1,632 statewide, top 14%, 177 students, 54% FRL) — zoned schools average 61% FRL vs 46% district-wide (15 pts higher); higher-poverty schools than district average — tighter screening recommended.
- Market conditions: 50 active listings in the ZIP.
Forward outlook
- In year one you build about $10k of equity ($864 loan paydown + $9k appreciation (7.2% local appreciation)).
- Baylor County population projected to shrink 9% by 2050 — rents likely to lag national; underwrite the cash flow, not the appreciation.
- At projected returns (7.2% appreciation + 3.0% rent growth), your $35k cash investment doubles in ~4 years — after that, you're playing with house money.
- By year 4, paydown + projected appreciation supports a ~$34k cash-out refi (75% LTV) — recoverable capital for the next deal without selling this one.
Negotiation context
- It's been on market 68 days — a 6% lower offer ($118k) is reasonable based on typical stale-listing flexibility.
- 2 sale attempts; this cycle's ask has dropped $10k (7%) from the opening price — seller is motivated, your offer sets the floor, not the list.
Risks & watch-outs
- Watch-outs: built in 1948 — expect roof / HVAC / electrical / plumbing capex.
- Climate carrying-cost: major wildfire risk; extreme-heat days projected 7→20/yr by 2055 (HVAC capex compounding) — expect insurance premiums to compound above CPI over the hold.
Questions for the listing agent
- It's been on market 68 days. Have you received any prior offers? Is the seller open to a 18% concession, seller financing, or rate buy-down credit?
- Built in 1948 — when were the roof, HVAC, electrical panel, plumbing, and water heater last replaced?
- Why hasn't it sold? Are there any deal-killer items the seller is aware of (foundation, flood, title, zoning, code violations)?
- Is there a deadline driving the sale (1031 exchange, divorce, estate, relocation)? That informs how much negotiation room exists.
- Schools are B-rated — typically a magnet for longer-tenancy family renters. What's the average tenant stay here, and is there a school-zone premium baked into asking?
- The area grade is low — what's the realistic commute time and amenity access for the typical tenant pool here? Any planned neighborhood developments (good or bad) we should know about?
- What's the average days-on-market for RENTAL listings here right now (not sales)? A rising rental-DOM trend means longer vacancies and softer asking-rent achievability than the comps imply.
- What's the recent tenant-quality profile in this submarket — average credit score on applications, eviction rate, late-payment / NSF rate, and stable-employment percentage? A property-management company in the area should have these aggregated.
- How much new for-sale + rental construction is in the pipeline within 1–3 miles? Heavy new supply typically softens prices + rents 12–24 months out; constrained supply supports both.
Investment metrics
- 1% rule
- 0.82% ✗
- Cap rate
- 6.35%
- Cash-on-cash
- 0.22%
- DSCR
- 1.01
- GRM
- 10.2
CMA / ARV
- ARV (median comp)
- $90,332
- List price
- $125,000
- Delta
- 38.38%
- Verdict
- OVERPRICED
- Comps
- 20 within 1.0 mi
Show comp detail 11 sales within ~0.75 mi
| Address | Dist | Beds/Ba | Sqft | Sold | Price | $/sf | Match |
|---|---|---|---|---|---|---|---|
| 201 W Belknap St | 0.11mi | 2/1.5 | 1,225 (+1%) | 3mo | $115,000 | $94 | 88 |
| 511 W Morris St | 0.34mi | 2/1.0 | 1,209 (+0%) | 2mo | $115,000 | $95 | 79 |
| 105 W China St St | 0.31mi | 2/1.0 | 1,178 (-2%) | 16mo | $74,000 | $63 | 64 |
| 604 S Cedar St | 0.18mi | 3/1.5 (+1) | 1,063 (-12%) | 1mo | $125,000 | $118 | 63 |
| 400 N Tackitt St | 0.57mi | 2/2.0 | 1,282 (+6%) | 2mo | $105,000 | $82 | 62 |
| 603 W Mclain St | 0.32mi | 3/2.0 (+1) | 1,333 (+10%) | 2mo | $139,000 | $104 | 61 |
| 305 S Donald St | 0.14mi | 2/1.0 | 1,128 (-7%) | 23mo | $70,500 | $63 | 59 |
| 611 N Stratton St | 0.75mi | 2/1.0 | 1,232 (+2%) | 1mo | $74,900 | $61 | 57 |
| 411 N River St | 0.56mi | 2/1.0 | 1,028 (-15%) | 2mo | $135,000 | $131 | 43 |
| 703 W Nevada St | 0.57mi | 2/1.0 | 1,041 (-14%) | 5mo | $119,500 | $115 | 42 |
| 710 N Cedar St | 0.70mi | 3/2.0 (+1) | 1,104 (-9%) | 14mo | $89,900 | $81 | 36 |
Match score weights: distance 35% · size 25% · config 20% · recency 20%. Top-matched comps best support the ARV.
Projected returns pro-forma
7.22% appreciation · 3.0% rent growth · sell at horizon
- IRR
- 18.4%
- Equity multiple
- 2.31×
- Total profit
- $45,737
- Equity at exit
- $88,441
- IRR
- 17.5%
- Equity multiple
- 4.78×
- Total profit
- $132,447
- Equity at exit
- $169,673
Cash invested: $35,000 (down + closing). Projections, not guarantees.
Landlord ↔ Tenant lean methodology
- Overall (STATE)
- 87 Strongly Landlord-Friendly
- State Texas
- 87 Strongly Landlord-Friendly · R+5
- County
- — inherits STATE
- City
- — inherits STATE
ZIP-level market 76380
- Home prices YoY
- 5.8%
- Active inventory
- 50
- Price-to-rent
- 10.2×
Monthly cashflow live
- Estimated rent
- $1,023 medium interval (Pro) →
- Mortgage (P&I)
- −$656
- Tax from tax record
- −$94 /mo · $1,133/yr
- Insurance
- −$52
- HOA
- −$0
- Vacancy / Maint / Mgmt
- −$215
- Net cashflow
- $6
Break-even live
Sensitivity live
| Price | -10% $77 | -5% $42 | +0% $6 | +5% $-29 | +10% $-64 |
|---|---|---|---|---|---|
| Rent | -10% $-75 | -5% $-34 | +0% $6 | +5% $47 | +10% $87 |
| Rate | -1.0pp $69 | -0.5pp $38 | base $6 | +0.5pp $-26 | +1.0pp $-59 |
UW: 25.0% down · 7.5% · 30yr · 1.5% tax · 5.0% vac · 8.0% maint · 8.0% mgmt
Financing live
Cash to close
- Down payment
- $31,250
- Closing costs
- $3,750
- Reserves months
- —
- Total cash needed
- —
Loan-product check · same deal, 3 products live
Conventional
25% down · 7.5% · 30yr
- Down + closing
- —
- Monthly P&I
- —
- Monthly cashflow
- —
- DSCR
- —
- Eligible?
- —
Personal DTI + credit; lowest rate.
DSCR
20% down · 8.5% · 30yr
- Down + closing
- —
- Monthly P&I
- —
- Monthly cashflow
- —
- DSCR
- —
- Eligible?
- —
No personal income docs; deal must DSCR.
Hard money
10% down · 12.0% · 12mo
- Down + closing
- —
- Monthly P&I
- —
- Monthly cashflow
- —
- DSCR
- —
- Eligible?
- —
Short-term bridge; refi at stabilization.
Listing history 19 events
-
2026-06-21days on market $125,000 Active 68 DOM
-
2026-06-21days on market $125,000 Active 67 DOM
-
2026-06-18days on market $125,000 Active 65 DOM
-
2026-06-17days on market $125,000 Active 64 DOM
-
2026-06-16days on market $125,000 Active 63 DOM
-
2026-06-15days on market $125,000 Active 62 DOM
-
2026-06-15days on market $125,000 Active 61 DOM
-
2026-06-13days on market $125,000 Active 60 DOM
-
2026-06-12pricedays on market $125,000 Active 59 DOM
-
2026-06-09days on market $135,000 Active 56 DOM
-
2026-06-08days on market $135,000 Active 55 DOM
-
2026-06-08days on market $135,000 Active 54 DOM
-
2026-06-07days on market $135,000 Active 53 DOM
-
2026-06-03days on market $135,000 Active 50 DOM
-
2026-06-02days on market $135,000 Active 49 DOM
-
2026-06-01days on market $135,000 Active 48 DOM
-
2026-05-31days on market $135,000 Active 47 DOM
-
2026-04-13$135,000 Active 515-char remark
Show marketing remark (618 chars)
Welcome to this charming 2-bedroom, 2-bath home situated on a spacious corner lot. The inviting living room features a large fireplace as its focal point, creating a warm and welcoming atmosphere. The kitchen comes fully equipped with all appliances, including a washer and dryer for added convenience. Exterior highlights include low-maintenance vinyl siding, a durable metal roof, a covered patio, and a double carport. Outdoor enthusiasts will appreciate the greenhouse and the impressive 20×60 shop—perfect for hobbies, storage, or workspace. A well-rounded property with room to live, work, and enjoy.
-
2026-04-13$135,000 Active 618-char remark
Show marketing remark (618 chars)
Welcome to this charming 2-bedroom, 2-bath home situated on a spacious corner lot. The inviting living room features a large fireplace as its focal point, creating a warm and welcoming atmosphere. The kitchen comes fully equipped with all appliances, including a washer and dryer for added convenience. Exterior highlights include low-maintenance vinyl siding, a durable metal roof, a covered patio, and a double carport. Outdoor enthusiasts will appreciate the greenhouse and the impressive 20×60 shop—perfect for hobbies, storage, or workspace. A well-rounded property with room to live, work, and enjoy.
ⓘ Source: listings_history table (triggers on properties + properties_extension) + one-shot
backfill from property_details.listing_events for pre-trigger history.
Tax reassessment forecast TX · Resets to sale price
- Current annual tax
- $1,133 · $94/mo
- Projected year-2 tax
- $2,288 · $191/mo
- Expected delta
- +$1,155/yr (+$96/mo · 102.0%)
ⓘ Screening estimate from a state-policy table — verify with the county assessor before closing.
Climate risk First Street
- Flood 1/10 Low 0% chance over 30 yrs
- Wildfire 7/10 Severe
- Heat 7/10 Severe 7 d/yr ≥108°F today · 20 d/yr by 30 yrs out
- Wind 3/10 Moderate 8% chance of damaging wind over 30 yrs
- Air quality 1/10 Low 0 unhealthy d/yr today · 0 by 30 yrs out
Nearby sold comps map
Loading sold comps map…
Walkable amenities ~0.75 mi
Loading nearby amenities…
Taxation est. · year 1
- Rental income
- $12,277
- − Mortgage interest
- −$7,002
- − Property taxes
- −$1,133
- − Insurance
- −$625
- − Repairs & maintenance
- −$982
- − Management
- −$982
- − Depreciation
- −$3,636
- Taxable loss
- −$2,083
- Est. tax savings @ 24.0%
- +$500
- After-tax cash flow
- $575/yr
For passive investors: Depreciation is non-cash, so a rental often shows a tax loss while cash-flowing — sheltering income. Rental losses are passive: they offset passive income freely, and up to $25,000/yr can offset ordinary (W-2) income if you actively participate and your MAGI is under $100k (phasing out to $0 by $150k); unused losses carry forward. On sale, claimed depreciation is recaptured at up to 25%, and gains may owe capital-gains tax (a 1031 exchange can defer both). Figures are a year-1 estimate at your 24.0% rate — not tax advice; consult a CPA.
Schools (NCES district)
- District
- Seymour ISD
- NCES district ID
- 4839780
- Math proficiency
- 55% ▼ -9.00%
- Reading proficiency
- 46% ▼ -13.00%
- Median HH income
- $36,292
- Composite
- 41.94/100
- National rank
- #3353
- State rank
- #195 of 826 in TX
Livability — Seymour
- Score
- 74/100
- State rank
- #191
- US rank
- #4884
Category grades
Schools grade is shown separately in the Schools card above.
Census & demographics
- Census place
- Seymour, TX
- Population (ZIP)
- 3,484
Population outlook (Baylor County) Hauer SSP2
- Today (2025)
- 3,534 people
- By 2030
- 3,462 · -2.0%
- By 2040
- 3,321 · -6.0%
- By 2050
- 3,209 · -9.2%
- By 2075
- 3,093 · -12.5%
- By 2100
- 2,597 · -26.5%
Race, ethnicity, and origin ACS 2023
- Neighborhood character
- Predominantly White (76%)
- Race & ethnicity
- White 76% Hispanic / Latino 14% Two or more races 11% Pacific Islander 1%
- Hispanic origin (detail)
- Mexican 12%
- Common ancestry
- Slovak 3% Italian 2% Russian 1%
- Foreign-born
- 3% · Canada
- Languages at home
- 90% English-only · Spanish 9% Other Asian/Pacific 1%
Political lean MEDSL · Baylor
- 2024 margin
- Solid R (+77.1) · D 11.0% · R 88.1%
- 2008→2024 swing
- -22.5pp toward R · 2008: -54.5pp · 2024: -77.1pp
- All cycles
- 2024: R+77.1 2020: R+77.0 2016: R+72.1 2012: R+64.7 2008: R+54.5
Not yet ingested
- Civics
- —
Market trends
- HPI YoY
- ▲ 7.22%
- Current HPI
- 131.3235
- Rent YoY
- —
- Metro
- —
- State GDP YoY
- ▲ 3.95%
- F500 in state
- 110
Industry mix (Fortune 500 HQ in TX)
| Industry | F500 HQs | Revenue |
|---|---|---|
| Energy | 16 | $1,198B |
|
||
| Technology | 5 | $198B |
|
||
| Engineering / Construction | 4 | $72B |
|
||
| Energy Services | 3 | $60B |
|
||
| Utilities | 3 | $41B |
|
||
| Healthcare | 2 | $330B |
|
||
Price history
+0.0% since first listed2 events — show timeline
- 2026-04-13 Listed $135,000 NTREIS
- 2026-04-13 Listed $135,000 WFAOR
Property tax history
+4.2%/yrLatest (2025): $1,133 · -18.2% YoY. Source: county tax records.
Cash-flow waterfall
monthlySold comps — $/sqft
last 12 mo · ≤1 miLoading sold comps…