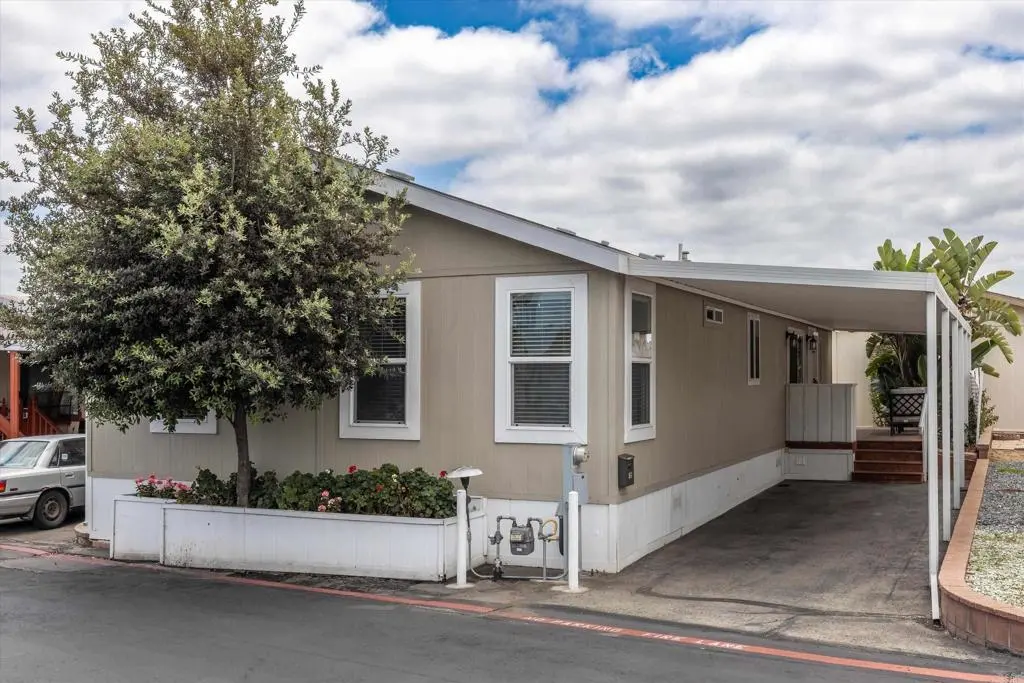
1515 Capalina Rd #15 · San Marcos, CA
Flood risk 1/10 · Minimal
- FEMA flood zone
- X (unshaded)
- Chance of flooding over 30 yrs
- 0.0%
- Est. flood insurance / yr
- $507 – $1,088
Fire risk 4/10 · Minor
- Est. fire insurance / yr
- $659 – $1,223
Heat risk 4/10 · Minor
- Hot days now (above 93°F)
- 7 days/yr
- Hot days in 30 yrs
- 23 days/yr
Wind risk 1/10 · Minimal
- Chance of severe wind over 30 yrs
- —
Air-quality risk 4/10 · Minor
- Unhealthy air days now
- 4 days/yr
- Unhealthy air days in 30 yrs
- 4 days/yr
Risk factors via First Street. Map © Google.
Why this score? — see what drove the B grade
The composite is a weighted blend of 9 inputs, each scored 0–100. Each bar is that input's sub-score; the figure is the points it added to the 100-point composite (weight × sub-score).
- Cash flow +27.8/30.0
- ARV discount +15.0/15.0
- DSCR +9.8/10.0
- 1% rule +7.6/10.0
- Schools +5.4/10.0
- Livability +3.9/5.0
- Rent growth +2.6/5.0
- Condition / age +2.5/5.0
- Appreciation +0.0/10.0
$268,000
🖨 Deal sheet 📄 Offer letter ✓ Due diligence
Listing remarks MLS
Lovely new manufactured home with granite counter tops and upgrades throughout. Beautiful open layout with island and open spaces. Walk in master bed closet, and tiled shower. Wonderful finished patio with plenty of room to entertain. This home is in a lease park, monthly rent is $595. This is a rent contrlled park. A must see!
Key facts
- 2 parking spots
- Community pool
- Built 2016
Property features AI
Finance
- Other: Located near Capalina off Rancho Santa Fe Rd, close to Hwy 78
- Financial info: Land lease amount: $1,040
- HOA & community: Senior community; Park designated for seniors; Land lease applies
Exterior
- Parking: 2 carport spaces; 2 total parking spaces
- Utilities: Public sewer
- Home design: Single-story mobile home; Mobile home remains; Mobile dimensions approximately 52' x 23'
- Construction: Public records used for living area and lot size
- Exterior features: Community pool; Close to clubhouse; Gutters; Street lighting
Interior
- Kitchen: Kitchen included
- Bedrooms: All bedrooms on ground level
- Bathrooms: 2 full bathrooms
- Heating & cooling: Central cooling
- Interior features: One-level home; Entry from carport; Rooms include primary bedroom, primary bathroom, living room, kitchen, and laundry; See remarks
- Laundry & utility: Inside laundry room; Washer included; Dryer included; Individual laundry room
Neighborhood map
What this means for you Summary
Snapshot
- This is a 3-bed/2.0-bath manufactured listed at $268k.
Deal economics
- At list price, monthly cash flow is $814 ($10k/yr) — positive.
- The deal already cash-flows at list — no discount required.
- Meets the 1% rule at list price ($3k rent vs $268k).
- Recommended offer: $264k (1.5% below list) — sets the bar for market timing.
- Cap rate 9.9% vs local median 2.5% in San Marcos — top-decile yield for the area; either an underpriced asset or a hidden risk that comps aren't pricing in. Stress-test before assuming the spread holds.
Location & tenants
- Location reads 77/100 on livability (#80 in CA, #3,074 nationally) — a middle-class / working-renter tenant base. Strengths: amenities A+, commute A+, employment A+; Watch: health & safety D+, cost of living F.
- San Marcos Unified (suburban): math 52% / reading 67% proficiency, ranked #249 of 1,400 in CA (top 18%) — acceptable for families but not a draw, mixed tenant base, ~2y average lease.
- Market conditions: Rents flat; 115 active listings in the ZIP; 21 comparable units currently listed for rent nearby; rentals at typical pace (median 24d on market — plan ~3-4 weeks tenant-placement turnaround); solid renter incomes; 11,759 units permitted in San Diego County in 2024 (7,244 in 5+ unit buildings).
- This rent runs 42% of the median local income ($97k/yr) — at the standard rent-burdened threshold; future hikes will face affordability resistance.
Forward outlook
- Local home prices are declining (-3.0%/yr); year-one equity from $2k of loan paydown is wiped out by about $8k of value loss. Plan a longer hold.
- San Diego County population projected at +20% by 2050 — long-run rental-demand tailwind backs the buy-and-hold thesis.
Negotiation context
- It's been on market 22 days — a 2% lower offer ($264k) is reasonable based on typical stale-listing flexibility.
- 2 sale attempts since 10y ago with the ask held roughly flat each time — persistent listings suggest the price (not the market) is what's stuck; bring a comps-based counter.
- Current owner paid $145k; list at $268k implies a 85% gain — meaningful room to come down on a strong offer.
Questions for the listing agent
- Is there a deadline driving the sale (1031 exchange, divorce, estate, relocation)? That informs how much negotiation room exists.
- What's the average days-on-market for RENTAL listings here right now (not sales)? A rising rental-DOM trend means longer vacancies and softer asking-rent achievability than the comps imply.
- What's the recent tenant-quality profile in this submarket — average credit score on applications, eviction rate, late-payment / NSF rate, and stable-employment percentage? A property-management company in the area should have these aggregated.
- How much new for-sale + rental construction is in the pipeline within 1–3 miles? Heavy new supply typically softens prices + rents 12–24 months out; constrained supply supports both.
Investment metrics
- 1% rule
- 1.26% ✓
- Cap rate
- 9.94%
- Cash-on-cash
- 13.01%
- DSCR
- 1.58
- GRM
- 6.6
CMA / ARV
- ARV (on-the-fly)
- $321,984
- Comps found
- 6
Show comp detail 6 sales within ~0.75 mi
| Address | Dist | Beds/Ba | Sqft | Sold | Price | $/sf | Match |
|---|---|---|---|---|---|---|---|
| 1515 Capalina Rd #95 | 0.00mi | 3/2.0 | 1,312 (+5%) | 13mo | $244,000 | $186 | 81 |
| 155 LAS FLORES Dr #13 | 0.53mi | 3/2.0 | 1,351 (+8%) | 12mo | $365,000 | $270 | 52 |
| 155 Las Flores #136 | 0.53mi | 2/2.0 (-1) | 1,344 (+8%) | 7mo | $280,000 | $208 | 52 |
| 150 S Rancho Santa Fe #105 | 0.40mi | 2/2.0 (-1) | 1,392 (+12%) | 10mo | $450,000 | $323 | 49 |
| 155 Las Flores Dr #23 | 0.53mi | 2/2.0 (-1) | 1,152 (-8%) | 12mo | $225,000 | $195 | 48 |
| 155 Las Flores Dr #24 | 0.53mi | 3/2.0 | 1,324 (+6%) | 24mo | $342,000 | $258 | 45 |
Match score weights: distance 35% · size 25% · config 20% · recency 20%. Top-matched comps best support the ARV.
Projected returns pro-forma
-3.0% appreciation · 0.55% rent growth · sell at horizon
- IRR
- 0.1%
- Equity multiple
- 1.00×
- Total profit
- $332
- Equity at exit
- $39,960
- IRR
- 7.1%
- Equity multiple
- 1.47×
- Total profit
- $35,510
- Equity at exit
- $23,172
Cash invested: $75,040 (down + closing). Projections, not guarantees.
Landlord ↔ Tenant lean methodology
- Overall (STATE)
- 18 Strongly Tenant-Friendly
- State California
- 18 Strongly Tenant-Friendly · D+13
- County
- — inherits STATE
- City
- — inherits STATE
ZIP-level market 92069
- Rents YoY
- 0.6%
- Active inventory
- 115
- Price-to-rent
- 6.6×
Monthly cashflow live
- Estimated rent
- $3,374 high interval (Pro) →
- Mortgage (P&I)
- −$1,405
- Tax est. 1.5%
- −$335 /mo · $4,020/yr
- Insurance
- −$112
- HOA
- −$0
- Vacancy / Maint / Mgmt
- −$709
- Net cashflow
- $814
Break-even live
UW: 25.0% down · 7.5% · 30yr · 1.5% tax · 5.0% vac · 8.0% maint · 8.0% mgmt
Financing live
Cash to close
- Down payment
- $67,000
- Closing costs
- $8,040
- Reserves months
- —
- Total cash needed
- —
Loan-product check · same deal, 3 products live
Conventional
25% down · 7.5% · 30yr
- Down + closing
- —
- Monthly P&I
- —
- Monthly cashflow
- —
- DSCR
- —
- Eligible?
- —
Personal DTI + credit; lowest rate.
DSCR
20% down · 8.5% · 30yr
- Down + closing
- —
- Monthly P&I
- —
- Monthly cashflow
- —
- DSCR
- —
- Eligible?
- —
No personal income docs; deal must DSCR.
Hard money
10% down · 12.0% · 12mo
- Down + closing
- —
- Monthly P&I
- —
- Monthly cashflow
- —
- DSCR
- —
- Eligible?
- —
Short-term bridge; refi at stabilization.
Rent comps 21 comps
| Address | Beds | Baths | Sqft | Rent | $/sqft | DOM | Units | Dist |
|---|---|---|---|---|---|---|---|---|
| 1635 Creek St San Marcos, CA | 1.0–2.0 | 2.0 | 1047 | $3,450 | $3.29 | 14d | 3 | 0.45mi |
| 1257 Armorlite Dr San Marcos, CA | 2.0 | 1.0–2.5 | 1189 | $4,330 | $3.64 | 1d | 24 | 0.47mi |
| 1045 Armorlite Dr San Marcos, CA | 2.0 | 1.0–3.0 | 902 | $3,398 | $3.77 | 1d | 16 | 0.62mi |
| 1189 Camino del Sol San Marcos, CA | 3.0 | 2.0 | 1315 | $3,500 | $2.66 | 24d | 1 | 0.68mi |
| 420 Smilax Rd San Marcos, CA | 2.0 | 2.0 | 896 | $2,445 | $2.73 | 2d | 3 | 0.73mi |
| 3834 La Rosa Dr Unit A San Marcos, CA | 2.0 | 1.0 | 1014 | $4,200 | $4.14 | 43d | 1 | 0.76mi |
| 3815 La Rosa Dr San Marcos, CA | 3.0 | 1.0 | 1014 | $3,700 | $3.65 | 12d | 1 | 0.80mi |
| 658 Las Flores Dr San Marcos, CA | 3.0 | 1.0 | 1284 | $3,650 | $2.84 | 43d | 1 | 0.84mi |
| 266 Avenida de Suerte San Marcos, CA | 3.0 | 2.0 | 1132 | $3,495 | $3.09 | 21d | 1 | 0.84mi |
| 300 Smilax Rd Unit 11 San Marcos, CA | 2.0 | 1.0 | 875 | $2,675 | $3.06 | 24d | 1 | 0.87mi |
| 320 Smilax Rd San Marcos, CA | 2.0 | 1.0 | 875 | $2,675 | $3.06 | 24d | 1 | 0.88mi |
| 320 Smilax Rd San Marcos, CA | 2.0 | 1.0 | 875 | $2,675 | $3.06 | 43d | 1 | 0.88mi |
| 221 Smilax Rd Vista, CA | 1.0–2.0 | 1.0–2.0 | 855 | $2,799 | $3.27 | 2d | 8 | 0.98mi |
| 3919 Las Cruces Ave San Marcos, CA | 3.0 | 2.0 | 1100 | $3,200 | $2.91 | 4d | 1 | 1.02mi |
| 1643 Rue de Valle San Marcos, CA | 2.0 | 1.5 | 1086 | $3,222 | $2.97 | 17d | 1 | 1.11mi |
| 603 Beverly Pl San Marcos, CA | 2.0 | 1.5 | 1068 | $3,150 | $2.95 | 43d | 1 | 1.16mi |
| 592 Los Vallecitos Blvd San Marcos, CA | 2.0 | 2.0 | 936 | $2,600 | $2.78 | 43d | 1 | 1.24mi |
| 1241 W San Marcos Blvd San Marcos, CA | 1.0–2.0 | 1.0 | 883 | $2,400 | $2.72 | 43d | 1 | 1.27mi |
| 245 Knoll Rd San Marcos, CA | 1.0–2.0 | 1.0 | 800 | $2,550 | $3.19 | 23d | 1 | 1.31mi |
| 532 Richmar Ave Unit C San Marcos, CA | 2.0 | 1.0 | 812 | $2,395 | $2.95 | 43d | 1 | 1.37mi |
| 433 Autumn Dr San Marcos, CA | 3.0 | 2.0 | 1150 | $2,650 | $2.30 | 43d | 1 | 1.44mi |
Listing history 18 events
-
2026-06-18days on market $268,000 Active 22 DOM
-
2026-06-17days on market $268,000 Active 21 DOM
-
2026-06-16days on market $268,000 Active 20 DOM
-
2026-06-16remarks 699-char remark
-
2026-06-15days on market $268,000 Active 19 DOM
-
2026-06-13days on market $268,000 Active 17 DOM
-
2026-06-09days on market $268,000 Active 13 DOM
-
2026-06-08days on market $268,000 Active 12 DOM
-
2026-06-07pricedays on market $268,000 Active 11 DOM
-
2026-06-04days on market $274,999 Active 8 DOM
-
2026-06-03days on market $274,999 Active 7 DOM
-
2026-06-02days on market $274,999 Active 6 DOM
-
2026-06-01days on market $274,999 Active 5 DOM
-
2026-05-31days on market $274,999 Active 4 DOM
-
2026-05-21$274,999 Active
-
2016-10-06status Pending 330-char remark
Show marketing remark (330 chars)
Lovely new manufactured home with granite counter tops and upgrades throughout. Beautiful open layout with island and open spaces. Walk in master bed closet, and tiled shower. Wonderful finished patio with plenty of room to entertain. This home is in a lease park, monthly rent is $595. This is a rent contrlled park. A must see!
-
2016-10-06soldstatus $144,900 Sold 330-char remark
Show marketing remark (330 chars)
Lovely new manufactured home with granite counter tops and upgrades throughout. Beautiful open layout with island and open spaces. Walk in master bed closet, and tiled shower. Wonderful finished patio with plenty of room to entertain. This home is in a lease park, monthly rent is $595. This is a rent contrlled park. A must see!
-
2016-07-25$144,900 Active 330-char remark
Show marketing remark (330 chars)
Lovely new manufactured home with granite counter tops and upgrades throughout. Beautiful open layout with island and open spaces. Walk in master bed closet, and tiled shower. Wonderful finished patio with plenty of room to entertain. This home is in a lease park, monthly rent is $595. This is a rent contrlled park. A must see!
ⓘ Source: listings_history table (triggers on properties + properties_extension) + one-shot
backfill from property_details.listing_events for pre-trigger history.
Climate risk First Street
- Flood 1/10 Low FEMA zone X (unshaded) · 0% chance over 30 yrs
- Wildfire 4/10 Moderate
- Heat 4/10 Moderate 7 d/yr ≥93°F today · 23 d/yr by 30 yrs out
- Wind 1/10 Low
- Air quality 4/10 Moderate 4 unhealthy d/yr today · 4 by 30 yrs out
Nearby sold comps map
Loading sold comps map…
Walkable amenities ~0.75 mi
Loading nearby amenities…
Taxation est. · year 1
- Rental income
- $40,494
- − Mortgage interest
- −$15,012
- − Property taxes
- −$4,020
- − Insurance
- −$1,340
- − Repairs & maintenance
- −$3,240
- − Management
- −$3,240
- − Depreciation
- −$7,796
- Taxable income
- $5,846
- Est. tax owed @ 24.0%
- −$1,403
- After-tax cash flow
- $8,362/yr
For passive investors: Depreciation is non-cash, so a rental often shows a tax loss while cash-flowing — sheltering income. Rental losses are passive: they offset passive income freely, and up to $25,000/yr can offset ordinary (W-2) income if you actively participate and your MAGI is under $100k (phasing out to $0 by $150k); unused losses carry forward. On sale, claimed depreciation is recaptured at up to 25%, and gains may owe capital-gains tax (a 1031 exchange can defer both). Figures are a year-1 estimate at your 24.0% rate — not tax advice; consult a CPA.
Schools (NCES district)
- District
- San Marcos Unified
- NCES district ID
- 0634880
- Math proficiency
- 52% ▲ 1.00%
- Reading proficiency
- 67% ▲ 2.00%
- Median HH income
- $64,752
- Composite
- 53.67/100
- National rank
- #3093
- State rank
- #249 of 1400 in CA
Livability — San Marcos
- Score
- 77/100
- State rank
- #80
- US rank
- #3074
Category grades
Schools grade is shown separately in the Schools card above.
Census & demographics
- Census place
- San Marcos, CA
- County
- San Diego County · 3,178,799 people
- City population
- 100,940
- Metro
- San Diego-Chula Vista-Carlsbad, CA
- Population (ZIP)
- 47,335
- Household income
- $96,771
- Rent vs Own
- Severe rent burden
- 2399.0
Population outlook (San Diego County) Hauer SSP2
- Today (2025)
- 3,678,185 people
- By 2030
- 3,856,546 · +4.8%
- By 2040
- 4,171,407 · +13.4%
- By 2050
- 4,421,607 · +20.2%
- By 2075
- 4,831,599 · +31.4%
- By 2100
- 4,832,502 · +31.4%
Race, ethnicity, and origin ACS 2023
- Neighborhood character
- Diverse neighborhood (Simpson 0.64)
- Race & ethnicity
- Hispanic / Latino 46% White 36% Two or more races 20% Asian 11% Native American 1% Black 1%
- Hispanic origin (detail)
- Mexican 41%
- Common ancestry
- Lithuanian 2% Romanian 2% Portuguese 2%
- Foreign-born
- 26% · Canada, China, Vietnam
- Languages at home
- 57% English-only · Spanish 32% Tagalog/Filipino 2% Other Asian/Pacific 2%
Political lean MEDSL · San Diego
- 2024 margin
- D (+16.8) · D 56.9% · R 40.1% · Other 2.9%
- 2008→2024 swing
- +6.6pp toward D · 2008: 10.2pp · 2024: 16.8pp
- All cycles
- 2024: D+16.8 2020: D+22.8 2016: D+17.8 2012: D+5.1 2008: D+10.2
Not yet ingested
- Civics
- —
Market trends
- HPI YoY
- ▼ -522.69%
- Current HPI
- 376.182
- Rent YoY
- ▲ 0.55%
- Metro
- San Diego-Chula Vista-Carlsbad, CA
- State GDP YoY
- ▲ 3.21%
- F500 in state
- 116
Industry mix (Fortune 500 HQ in CA)
| Industry | F500 HQs | Revenue |
|---|---|---|
| Technology | 27 | $1,492B |
|
||
| Financial Services | 3 | $174B |
|
||
| Retail | 3 | $44B |
|
||
| Insurance | 3 | $26B |
|
||
| Media / Entertainment | 2 | $115B |
|
||
| Pharmaceuticals / Biotech | 2 | $62B |
|
||
Price history
+89.8% since first listed4 events — show timeline
- 2026-05-21 Listed $274,999 CRMLS
- 2016-10-06 Pending — SDMLS
- 2016-10-06 Sold (MLS) $144,900 SDMLS
- 2016-07-25 Listed $144,900 SDMLS
Cash-flow waterfall
monthlySold comps — $/sqft
last 12 mo · ≤1 miLoading sold comps…