707 Old Montauk Hwy Unit A-57 · Montauk, NY
Flood risk No data
- FEMA flood zone
- —
- Chance of flooding over 30 yrs
- —
- Est. flood insurance / yr
- —
Fire risk No data
- Est. fire insurance / yr
- —
Heat risk No data
- Hot days now (above threshold)
- —
- Hot days in 30 yrs
- —
Wind risk No data
- Chance of severe wind over 30 yrs
- —
Air-quality risk No data
- Unhealthy air days now
- —
- Unhealthy air days in 30 yrs
- —
Risk factors via First Street. Map © Google.
Why this score? — see what drove the B+ grade
The composite is a weighted blend of 9 inputs, each scored 0–100. Each bar is that input's sub-score; the figure is the points it added to the 100-point composite (weight × sub-score).
- Cash flow +30.0/30.0
- 1% rule +10.0/10.0
- DSCR +10.0/10.0
- ARV discount +7.5/15.0
- Schools +5.1/10.0
- Appreciation +4.1/10.0
- Condition / age +4.0/5.0
- Livability +3.5/5.0
- Rent growth +2.5/5.0
$899,000
🖨 Deal sheet 📄 Offer letter ✓ Due diligence
Listing remarks
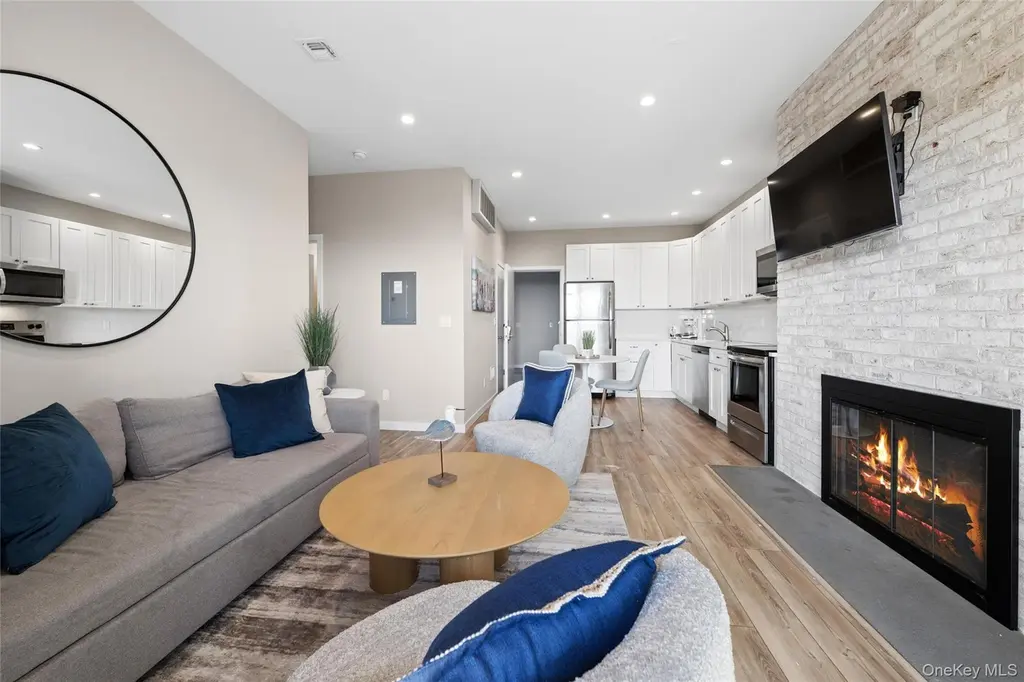
Sleep peacefully to the sound of the Atlantic in this charming two-bedroom, one-bathroom oceanfront co-op ideally located just minutes to the heart of Montauk. Perfectly positioned to capture ocean views and refreshing sea breezes, this coastal retreat offers the ultimate blend of tranquility and convenience. Enjoy direct access to Montauk's pristine beach, ideal for morning sunrises, surfing, or simply relaxing in the sun. Just minutes to restaurants, boutiques, markets, and nightlife. Atlantic Bluffs Club delivers the quintessential Montauk lifestyle you are looking for.
Key facts
- Oceanfront co-op
- Ocean views
- $1,862 HOA
Tags
Property features AI
Finance
- HOA & community: Association fee paid monthly; Association fee covers common area maintenance, exterior maintenance, grounds care, and pool service
Exterior
- Parking: Assigned parking
- Utilities: Shared septic system; Cable available
- Home design: Stock cooperative; Entry level: 1
- Construction: Frame construction
- Exterior features: Above-ground pool; Waterfront property
Interior
- Kitchen: Dishwasher; Electric range / oven; Range; Refrigerator
- Bedrooms: Bedroom located on the first floor
- Bathrooms: 1 full bathroom
- Heating & cooling: Electric heating; Ductwork for cooling
- Interior features: First-floor bedroom; First-floor full bathroom; Open floor plan; No basement; 5 total rooms
Neighborhood map
What this means for you Summary
Snapshot
- This is a 2-bed/1.0-bath condo listed at $899k. Condition is rated good.
Deal economics
- At list price, monthly cash flow is $4k ($44k/yr) — positive.
- The deal already cash-flows at list — no discount required.
- Meets the 1% rule at list price ($15k rent vs $899k).
- Recommended offer: $886k (1.5% below list) — sets the bar for market timing.
- Cap rate 11.2% vs local median 7.9% in Montauk — top-decile yield for the area; either an underpriced asset or a hidden risk that comps aren't pricing in. Stress-test before assuming the spread holds.
Location & tenants
- Location reads 69/100 on livability (#474 in NY) — a middle-class / working-renter tenant base. Strengths: crime A+, employment A+, health & safety A; Watch: housing C-, amenities F, commute F.
- Montauk Union Free School District (town): math 50% / reading 60% proficiency, ranked #311 of 755 in NY (top 41%) — acceptable for families but not a draw, mixed tenant base, ~2y average lease.
- Zoned schools: Montauk School (math 62% / reading 82%, grade A-, #378 of 2,108 statewide, top 20%, 303 students, 0% FRL) — zoned schools average 0% FRL vs 21% district-wide (21 pts lower); this property's tenant base skews higher-income than the district average.
- Zoned-school proficiency averages 72% at this address vs 55% district-wide (+17 pts) — the actual schools serving this property are materially stronger than the Montauk Union Free School District average implies; a family-tenant draw the district grade alone would hide.
- Market conditions: 39 active listings in the ZIP; 2 comparable units currently listed for rent nearby; high-income renter base; 1,366 units permitted in Suffolk County in 2024 (216 in 5+ unit buildings).
- At $14,858/mo this rent would consume 125% of the median local household income ($143k/yr) (locally 20% of renters already pay >50% of income on rent) — very limited rent-growth headroom before tenants either downsize or default.
Forward outlook
- Local home prices are declining (-1.8%/yr); year-one equity from $6k of loan paydown is wiped out by about $16k of value loss. Plan a longer hold.
- Suffolk County population projected to shrink 5% by 2050 — rents likely to lag national; underwrite the cash flow, not the appreciation.
- At projected returns (-1.8% appreciation + 3.0% rent growth), your $252k cash investment doubles in ~6 years — after that, you're playing with house money.
Negotiation context
- It's been on market 21 days — a 2% lower offer ($886k) is reasonable based on typical stale-listing flexibility.
Questions for the listing agent
- What does the HOA fee cover, when was the last increase, and are there any pending special assessments or reserve-fund shortfalls?
- Any open or pending special assessments — roof, HVAC, plumbing, elevator, façade? What's the per-unit balance and payoff schedule, and is the seller paying it off at close or rolling it to the buyer?
- Is there a deadline driving the sale (1031 exchange, divorce, estate, relocation)? That informs how much negotiation room exists.
- What's the average days-on-market for RENTAL listings here right now (not sales)? A rising rental-DOM trend means longer vacancies and softer asking-rent achievability than the comps imply.
- What's the recent tenant-quality profile in this submarket — average credit score on applications, eviction rate, late-payment / NSF rate, and stable-employment percentage? A property-management company in the area should have these aggregated.
- How much new apartment / multifamily construction is in the pipeline within 1–3 miles? Heavy new supply (>2% of stock underway) typically softens rents 12–24 months out; light construction supports rent growth.
Investment metrics
- 1% rule
- 1.65% ✓
- Cap rate
- 11.18%
- Cash-on-cash
- 17.46%
- DSCR
- 1.78
- GRM
- 5.0
CMA / ARV
No comps found within radius.
Projected returns pro-forma
-1.78% appreciation · 3.0% rent growth · sell at horizon
- IRR
- 12.5%
- Equity multiple
- 1.54×
- Total profit
- $135,706
- Equity at exit
- $183,762
- IRR
- 19.7%
- Equity multiple
- 2.85×
- Total profit
- $466,268
- Equity at exit
- $165,868
Cash invested: $251,720 (down + closing). Projections, not guarantees.
Landlord ↔ Tenant lean methodology
- Overall (STATE)
- 15 Strongly Tenant-Friendly
- State New York
- 15 Strongly Tenant-Friendly · D+10
- County
- — inherits STATE
- City
- — inherits STATE
ZIP-level market 11954
- Home prices YoY
- -0.3%
- Active inventory
- 39
- Price-to-rent
- 5.0×
Monthly cashflow live
- Estimated rent
- $14,858 medium interval (Pro) →
- Mortgage (P&I)
- −$4,714
- Tax est. 1.5%
- −$1,124 /mo · $13,485/yr
- Insurance
- −$375
- HOA
- −$1,862
- Vacancy / Maint / Mgmt
- −$3,120
- Net cashflow
- $3,663
Break-even live
UW: 25.0% down · 7.5% · 30yr · 1.5% tax · 5.0% vac · 8.0% maint · 8.0% mgmt
Financing live
Cash to close
- Down payment
- $224,750
- Closing costs
- $26,970
- Reserves months
- —
- Total cash needed
- —
Loan-product check · same deal, 3 products live
Conventional
25% down · 7.5% · 30yr
- Down + closing
- —
- Monthly P&I
- —
- Monthly cashflow
- —
- DSCR
- —
- Eligible?
- —
Personal DTI + credit; lowest rate.
DSCR
20% down · 8.5% · 30yr
- Down + closing
- —
- Monthly P&I
- —
- Monthly cashflow
- —
- DSCR
- —
- Eligible?
- —
No personal income docs; deal must DSCR.
Hard money
10% down · 12.0% · 12mo
- Down + closing
- —
- Monthly P&I
- —
- Monthly cashflow
- —
- DSCR
- —
- Eligible?
- —
Short-term bridge; refi at stabilization.
Rent comps 2 comps
| Address | Beds | Baths | Sqft | Rent | $/sqft | DOM | Units | Dist |
|---|---|---|---|---|---|---|---|---|
| 16 Navy Rd Unit 206 Montauk, NY | 1.0 | 1.0 | 600 | $24,000 | $40.00 | 24d | 1 | 1.14mi |
| 23 Fort Pond Rd Unit 13 Montauk, NY | 1.0 | 1.0 | 600 | $29,000 | $48.33 | 24d | 1 | 1.35mi |
HOA detail condo
- Monthly dues
- $1,862 · $22,344/yr
- Assessments
- None detected in remarks — confirm with the listing agent.
Listing history 15 events
-
2026-06-18days on market $899,000 Active 21 DOM
-
2026-06-17days on market $899,000 Active 20 DOM
-
2026-06-16days on market $899,000 Active 19 DOM
-
2026-06-15days on market $899,000 Active 18 DOM
-
2026-06-13days on market $899,000 Active 16 DOM
-
2026-06-13days on market $899,000 Active 15 DOM
-
2026-06-09days on market $899,000 Active 12 DOM
-
2026-06-08days on market $899,000 Active 11 DOM
-
2026-06-07days on market $899,000 Active 10 DOM
-
2026-06-04days on market $899,000 Active 7 DOM
-
2026-06-03days on market $899,000 Active 6 DOM
-
2026-06-02days on market $899,000 Active 5 DOM
-
2026-06-01days on market $899,000 Active 4 DOM
-
2026-05-31days on market $899,000 Active 3 DOM
-
2026-05-27$899,000 Active
ⓘ Source: listings_history table (triggers on properties + properties_extension) + one-shot
backfill from property_details.listing_events for pre-trigger history.
Nearby sold comps map
Loading sold comps map…
Walkable amenities ~0.75 mi
Loading nearby amenities…
Taxation est. · year 1
- Rental income
- $178,291
- − Mortgage interest
- −$50,358
- − Property taxes
- −$13,485
- − Insurance
- −$4,495
- − Repairs & maintenance
- −$14,263
- − Management
- −$14,263
- − HOA
- −$22,344
- − Depreciation
- −$26,153
- Taxable income
- $32,930
- Est. tax owed @ 24.0%
- −$7,903
- After-tax cash flow
- $36,049/yr
For passive investors: Depreciation is non-cash, so a rental often shows a tax loss while cash-flowing — sheltering income. Rental losses are passive: they offset passive income freely, and up to $25,000/yr can offset ordinary (W-2) income if you actively participate and your MAGI is under $100k (phasing out to $0 by $150k); unused losses carry forward. On sale, claimed depreciation is recaptured at up to 25%, and gains may owe capital-gains tax (a 1031 exchange can defer both). Figures are a year-1 estimate at your 24.0% rate — not tax advice; consult a CPA.
Condition & rehab AI · 12 photos
This two-bedroom, one-bathroom oceanfront condo is in excellent condition with modern finishes and a great location. It's move-in ready with minor touch-ups needed to enhance its curb appeal and rental value.
Value-add opportunities
- Resale Paint the fireplace — Enhances curb appeal and modernizes the space
- Resale Clean the fireplace — Maintains the fireplace's aesthetic and functionality
- Rental Replace the curtains — Fresh curtains can make the space feel more inviting and updated
Renovation cost estimate screening
Value-add ROI direction
- Resale Paint the fireplace — Enhances curb appeal and modernizes the space ↑
- Resale Clean the fireplace — Maintains the fireplace's aesthetic and functionality ↑
- Rental Replace the curtains — Fresh curtains can make the space feel more inviting and updated ↑
ⓘ Cost ranges are severity-bucket heuristics (US national rule-of-thumb). Get contractor quotes + a written scope before underwriting a rehab budget.
Schools (NCES district)
- District
- Montauk Union Free School District
- NCES district ID
- 3619710
- Math proficiency
- 50% ▼ -10.00%
- Reading proficiency
- 60% ▬ 0.00%
- Median HH income
- $73,702
- Composite
- 50.99/100
- National rank
- #3831
- State rank
- #311 of 755 in NY
Livability — Montauk
- Score
- 69/100
- State rank
- #474
- US rank
- #8373
Category grades
Schools grade is shown separately in the Schools card above.
Census & demographics
- Census place
- Montauk, NY
- County
- Suffolk County · 679,920 people
- City population
- 4,223
- Metro
- New York-Newark-Jersey City, NY-NJ-PA
- Population (ZIP)
- 4,223
- Household income
- $142,961
- Rent vs Own
- Severe rent burden
- 20.0
Population outlook (Suffolk County) Hauer SSP2
- Today (2025)
- 1,505,262 people
- By 2030
- 1,498,318 · -0.5%
- By 2040
- 1,471,101 · -2.3%
- By 2050
- 1,424,848 · -5.3%
- By 2075
- 1,337,157 · -11.2%
- By 2100
- 1,217,720 · -19.1%
Race, ethnicity, and origin ACS 2023
- Neighborhood character
- Predominantly White (89%)
- Race & ethnicity
- White 89% Hispanic / Latino 6% Two or more races 4% Black 1%
- Hispanic origin (detail)
- Mexican 2% Dominican 1%
- Common ancestry
- Romanian 4% Scotch-Irish 3% Italian 3%
- Foreign-born
- 10% · Canada, Jamaica
- Languages at home
- 90% English-only · Spanish 4% Russian/Polish/Slavic 4% Other Indo-European 1%
Political lean MEDSL · Suffolk
- 2024 margin
- Lean R (+10.0) · D 45.0% · R 55.0%
- 2008→2024 swing
- -16.0pp toward R · 2008: 6.0pp · 2024: -10.0pp
- All cycles
- 2024: R+10.0 2020: R+0.0 2016: R+8.2 2012: D+2.9 2008: D+6.0
Not yet ingested
- Civics
- —
Market trends
- HPI YoY
- ▼ -1.78%
- Current HPI
- 577.7344
- Rent YoY
- —
- Metro
- New York-Newark-Jersey City, NY-NJ-PA
- State GDP YoY
- ▲ 2.60%
- F500 in state
- 92
Industry mix (Fortune 500 HQ in NY)
| Industry | F500 HQs | Revenue |
|---|---|---|
| Financial Services | 10 | $950B |
|
||
| Consumer Goods | 9 | $162B |
|
||
| Insurance | 4 | $225B |
|
||
| Telecommunications | 2 | $144B |
|
||
| Pharmaceuticals | 2 | $112B |
|
||
| Media / Entertainment | 2 | $69B |
|
||
Price history
1 event — show timeline
- 2026-05-27 Listed $899,000 OneKey® MLS as Distributed by MLS Grid
Cash-flow waterfall
monthlySold comps — $/sqft
last 12 mo · ≤1 miLoading sold comps…