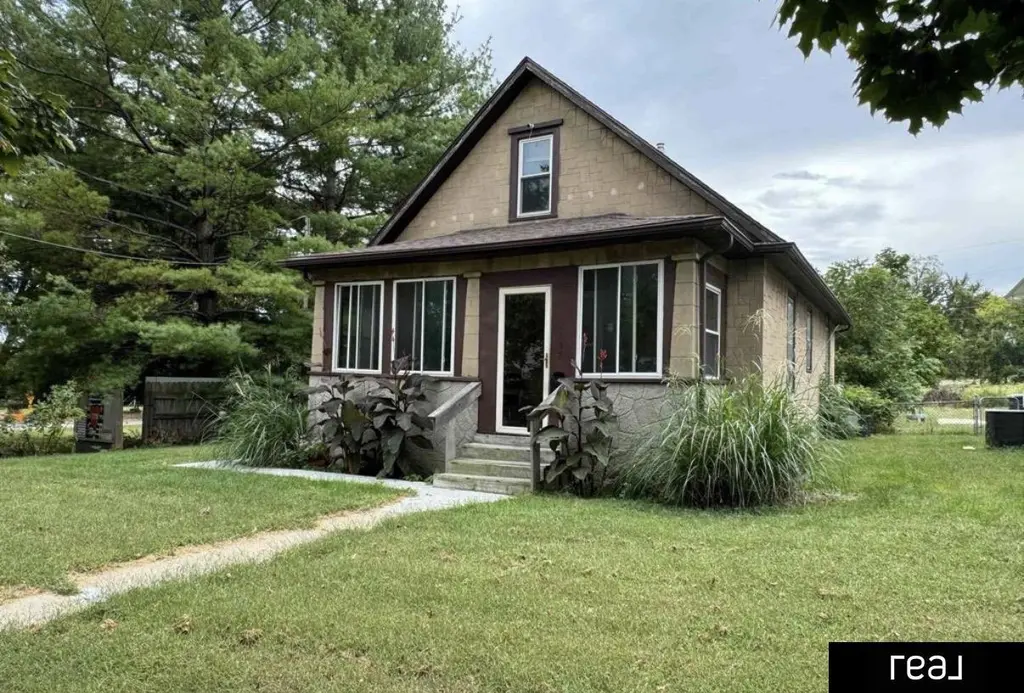
2857 Corby St · Omaha, NE
Flood risk 1/10 · Minimal
- FEMA flood zone
- X (unshaded)
- Chance of flooding over 30 yrs
- 0.0%
- Est. flood insurance / yr
- $473 – $860
Fire risk 1/10 · Minimal
- Est. fire insurance / yr
- $1,161 – $2,155
Heat risk 3/10 · Minor
- Hot days now (above 105°F)
- 7 days/yr
- Hot days in 30 yrs
- 15 days/yr
Wind risk 2/10 · Minimal
- Chance of severe wind over 30 yrs
- —
Air-quality risk 2/10 · Minimal
- Unhealthy air days now
- 0 days/yr
- Unhealthy air days in 30 yrs
- 1 days/yr
Risk factors via First Street. Map © Google.
Why this score? — see what drove the B grade
The composite is a weighted blend of 9 inputs, each scored 0–100. Each bar is that input's sub-score; the figure is the points it added to the 100-point composite (weight × sub-score).
- Cash flow +27.1/30.0
- Appreciation +10.0/10.0
- DSCR +9.4/10.0
- ARV discount +7.5/15.0
- 1% rule +7.4/10.0
- Livability +4.2/5.0
- Rent growth +3.3/5.0
- Condition / age +2.5/5.0
- Schools +2.1/10.0
$130,000
🖨 Deal sheet 📄 Offer letter ✓ Due diligence
Listing remarks MLS
Stop renting—this 4-bedroom could be yours (or your next rental income property). This 4-bedroom, 1-bath home offers a rare chance to step into homeownership or secure your next investment. With a strong rental history and a long-term tenant of 40 years moving out at the end of May, you’ll have the flexibility to move in, renovate, or lease at current market rents. Inside, you’ll find great space and potential—perfect for adding your own updates and instantly building equity. For investors, this is a value-add opportunity with clear upside. For buyers, it’s an affordable way to get more bedrooms and make it your own over time. Price recently reduced = even more opportunity Lease ending soon = flexibility to move in or rent out right away 24-hour notice required for showings.
Key facts
- 6,098 sq ft lot
- Built 1910
- Listed 30 days
Neighborhood map
What this means for you Summary
Snapshot
- This is a 4-bed/1.0-bath other listed at $130k.
Deal economics
- At list price, monthly cash flow is $369 ($4k/yr) — positive.
- The deal already cash-flows at list — no discount required.
- Meets the 1% rule at list price ($2k rent vs $130k).
- Recommended offer: $128k (1.5% below list) — sets the bar for market timing.
- Cap rate 9.7% vs local median 3.6% in Omaha — top-decile yield for the area; either an underpriced asset or a hidden risk that comps aren't pricing in. Stress-test before assuming the spread holds.
Location & tenants
- Location reads 84/100 on livability (#7 in NE, #663 nationally) — a professional / high-income tenant draw. Strengths: amenities A+, commute A+, cost of living A+; Watch: crime F.
- Omaha Public Schools (urban): math 20% / reading 28% proficiency, ranked #110 of 111 in NE (top 99%) — low school quality limits family demand, transient renter base, plan for 1-2y turnover; 62% free/reduced lunch — lower-income household profile, screen leases tightly.
- Market conditions: Rents rising (+3.2%/yr); 139 active listings in the ZIP; 15 comparable units currently listed for rent nearby; rentals at typical pace (median 24d on market — plan ~3-4 weeks tenant-placement turnaround); 40% of comp listings sitting > 30 days — soft ceiling on asking rent; lower-income renter base — watch delinquency; 4,539 units permitted in Douglas County in 2024 (2,583 in 5+ unit buildings).
- At $1,613/mo this rent would consume 46% of the median local household income ($42k/yr) (locally 1913% of renters already pay >50% of income on rent) — very limited rent-growth headroom before tenants either downsize or default.
Forward outlook
- In year one you build about $14k of equity ($899 loan paydown + $13k appreciation (10.0% local appreciation)).
- Douglas County population projected at +28% by 2050 — long-run rental-demand tailwind backs the buy-and-hold thesis.
- At projected returns (10.0% appreciation + 3.2% rent growth), your $36k cash investment doubles in ~2 years — after that, you're playing with house money.
- By year 3, paydown + projected appreciation supports a ~$35k cash-out refi (75% LTV) — recoverable capital for the next deal without selling this one.
Negotiation context
- It's been on market 30 days — a 2% lower offer ($128k) is reasonable based on typical stale-listing flexibility.
- 5 sale attempts since 2y ago with the ask held roughly flat each time — persistent listings suggest the price (not the market) is what's stuck; bring a comps-based counter.
Risks & watch-outs
- Watch-outs: built in 1910 — expect roof / HVAC / electrical / plumbing capex.
Questions for the listing agent
- Built in 1910 — when were the roof, HVAC, electrical panel, plumbing, and water heater last replaced?
- Is there a deadline driving the sale (1031 exchange, divorce, estate, relocation)? That informs how much negotiation room exists.
- Crime grade is F in this area — have there been break-ins, vandalism, or insurance claims at this property in the last 3 years? What carrier currently insures it and at what premium?
- What's the average days-on-market for RENTAL listings here right now (not sales)? A rising rental-DOM trend means longer vacancies and softer asking-rent achievability than the comps imply.
- What's the recent tenant-quality profile in this submarket — average credit score on applications, eviction rate, late-payment / NSF rate, and stable-employment percentage? A property-management company in the area should have these aggregated.
- How much new for-sale + rental construction is in the pipeline within 1–3 miles? Heavy new supply typically softens prices + rents 12–24 months out; constrained supply supports both.
Investment metrics
- 1% rule
- 1.24% ✓
- Cap rate
- 9.70%
- Cash-on-cash
- 12.16%
- DSCR
- 1.54
- GRM
- 6.7
CMA / ARV
No comps found within radius.
Projected returns pro-forma
10.0% appreciation · 3.22% rent growth · sell at horizon
- IRR
- 33.3%
- Equity multiple
- 3.60×
- Total profit
- $94,675
- Equity at exit
- $117,114
- IRR
- 28.8%
- Equity multiple
- 8.17×
- Total profit
- $261,122
- Equity at exit
- $252,561
Cash invested: $36,400 (down + closing). Projections, not guarantees.
Landlord ↔ Tenant lean methodology
- Overall (STATE)
- 83 Strongly Landlord-Friendly
- State Nebraska
- 83 Strongly Landlord-Friendly · R+13
- County
- — inherits STATE
- City
- — inherits STATE
ZIP-level market 68111
- Home prices YoY
- 4.0%
- Rents YoY
- 3.2%
- Active inventory
- 139
- Price-to-rent
- 6.7×
Monthly cashflow live
- Estimated rent
- $1,613 high interval (Pro) →
- Mortgage (P&I)
- −$682
- Tax from tax record
- −$169 /mo · $2,033/yr
- Insurance
- −$54
- HOA
- −$0
- Vacancy / Maint / Mgmt
- −$339
- Net cashflow
- $369
Break-even live
UW: 25.0% down · 7.5% · 30yr · 1.5% tax · 5.0% vac · 8.0% maint · 8.0% mgmt
Financing live
Cash to close
- Down payment
- $32,500
- Closing costs
- $3,900
- Reserves months
- —
- Total cash needed
- —
Loan-product check · same deal, 3 products live
Conventional
25% down · 7.5% · 30yr
- Down + closing
- —
- Monthly P&I
- —
- Monthly cashflow
- —
- DSCR
- —
- Eligible?
- —
Personal DTI + credit; lowest rate.
DSCR
20% down · 8.5% · 30yr
- Down + closing
- —
- Monthly P&I
- —
- Monthly cashflow
- —
- DSCR
- —
- Eligible?
- —
No personal income docs; deal must DSCR.
Hard money
10% down · 12.0% · 12mo
- Down + closing
- —
- Monthly P&I
- —
- Monthly cashflow
- —
- DSCR
- —
- Eligible?
- —
Short-term bridge; refi at stabilization.
Rent comps 15 comps
| Address | Beds | Baths | Sqft | Rent | $/sqft | DOM | Units | Dist |
|---|---|---|---|---|---|---|---|---|
| 2816 N 19th Ave Omaha, NE | 3.0 | 1.0 | 860 | $1,700 | $1.98 | 43d | 1 | 0.70mi |
| 1820 Miami St Omaha, NE | 4.0 | 1.5 | 1306 | $1,050 | $0.80 | 43d | 1 | 0.77mi |
| 3674 Bedford Ave Omaha, NE | 3.0 | 1.0 | 864 | $1,275 | $1.48 | 23d | 1 | 0.77mi |
| 3430 Seward St Omaha, NE | 3.0 | 1.0 | 1371 | $1,695 | $1.24 | 14d | 1 | 0.84mi |
| 3708 Florence Blvd Omaha, NE | 3.0 | 1.0 | 1102 | $1,395 | $1.27 | 21d | 1 | 0.91mi |
| 4201 N 22nd St Omaha, NE | 3.0 | 1.0 | 1380 | $1,545 | $1.12 | 43d | 1 | 1.06mi |
| 1120 N 20th St Unit 309 Omaha, NE | 4.0 | 2.0 | 1179 | $1,550 | $1.31 | 23d | 1 | 1.09mi |
| 1120 N 20th St Unit 102 Omaha, NE | 3.0 | 2.0 | 1094 | $580 | $0.53 | 14d | 1 | 1.09mi |
| 1120 N 20th St Unit 103 Omaha, NE | 3.0 | 2.0 | 1170 | $1,150 | $0.98 | 14d | 1 | 1.09mi |
| 4125 N 19th St Omaha, NE | 3.0 | 1.0 | 1266 | $1,532 | $1.21 | 43d | 1 | 1.16mi |
| 1004 Glenwood Ave Unit 2 Omaha, NE | 3.0 | 1.5 | 1000 | $1,500 | $1.50 | 3d | 1 | 1.20mi |
| 4276 Binney St Omaha, NE | 4.0 | 1.0 | 1358 | $1,495 | $1.10 | 43d | 1 | 1.21mi |
| 2929 California St Omaha, NE | 1.0–4.0 | 1.0–3.0 | 1280 | $3,340 | $2.61 | 3d | 118 | 1.30mi |
| 3535 N 45th Ave Omaha, NE | 3.0 | 1.0 | 1325 | $1,800 | $1.36 | 43d | 1 | 1.48mi |
| 1015 N 14th St Omaha, NE | 1.0–3.0 | 1.0–3.0 | 910 | $1,855 | $2.04 | 2d | 17 | 1.48mi |
Listing history 13 events
-
2026-05-07status Pending 815-char remark
Show marketing remark (815 chars)
Stop renting—this 4-bedroom could be yours (or your next rental income property). This 4-bedroom, 1-bath home offers a rare chance to step into homeownership or secure your next investment. With a strong rental history and a long-term tenant of 40 years moving out at the end of May, you’ll have the flexibility to move in, renovate, or lease at current market rents. Inside, you’ll find great space and potential—perfect for adding your own updates and instantly building equity. For investors, this is a value-add opportunity with clear upside. For buyers, it’s an affordable way to get more bedrooms and make it your own over time. Price recently reduced = even more opportunity Lease ending soon = flexibility to move in or rent out right away 24-hour notice required for showings.
-
2026-04-07$130,000 New 815-char remark
Show marketing remark (815 chars)
Stop renting—this 4-bedroom could be yours (or your next rental income property). This 4-bedroom, 1-bath home offers a rare chance to step into homeownership or secure your next investment. With a strong rental history and a long-term tenant of 40 years moving out at the end of May, you’ll have the flexibility to move in, renovate, or lease at current market rents. Inside, you’ll find great space and potential—perfect for adding your own updates and instantly building equity. For investors, this is a value-add opportunity with clear upside. For buyers, it’s an affordable way to get more bedrooms and make it your own over time. Price recently reduced = even more opportunity Lease ending soon = flexibility to move in or rent out right away 24-hour notice required for showings.
-
2026-04-07historical
Show marketing remark (815 chars)
Stop renting—this 4-bedroom could be yours (or your next rental income property). This 4-bedroom, 1-bath home offers a rare chance to step into homeownership or secure your next investment. With a strong rental history and a long-term tenant of 40 years moving out at the end of May, you’ll have the flexibility to move in, renovate, or lease at current market rents. Inside, you’ll find great space and potential—perfect for adding your own updates and instantly building equity. For investors, this is a value-add opportunity with clear upside. For buyers, it’s an affordable way to get more bedrooms and make it your own over time. Price recently reduced = even more opportunity Lease ending soon = flexibility to move in or rent out right away 24-hour notice required for showings.
-
2026-03-04$135,000 New
-
2026-03-04historical
-
2026-01-30$145,000 New
-
2024-11-12soldstatus $125,000
-
2024-11-08soldstatus $125,000 Sold
-
2024-10-29status Pending
-
2024-10-16price $135,000
-
2024-09-17$145,000 New
-
2024-02-10historical
-
2024-01-24$100,000 New
ⓘ Source: listings_history table (triggers on properties + properties_extension) + one-shot
backfill from property_details.listing_events for pre-trigger history.
Tax reassessment forecast NE · Resets to sale price
- Current annual tax
- $2,033 · $169/mo
- Projected year-2 tax
- $2,249 · $187/mo
- Expected delta
- +$216/yr (+$18/mo · 10.6%)
ⓘ Screening estimate from a state-policy table — verify with the county assessor before closing.
Climate risk First Street
- Flood 1/10 Low FEMA zone X (unshaded) · 0% chance over 30 yrs
- Wildfire 1/10 Low
- Heat 3/10 Moderate 7 d/yr ≥105°F today · 15 d/yr by 30 yrs out
- Wind 2/10 Low
- Air quality 2/10 Low 0 unhealthy d/yr today · 1 by 30 yrs out
Nearby sold comps map
Loading sold comps map…
Walkable amenities ~0.75 mi
Loading nearby amenities…
Taxation est. · year 1
- Rental income
- $19,353
- − Mortgage interest
- −$7,282
- − Property taxes
- −$2,033
- − Insurance
- −$650
- − Repairs & maintenance
- −$1,548
- − Management
- −$1,548
- − Depreciation
- −$3,782
- Taxable income
- $2,510
- Est. tax owed @ 24.0%
- −$602
- After-tax cash flow
- $3,823/yr
For passive investors: Depreciation is non-cash, so a rental often shows a tax loss while cash-flowing — sheltering income. Rental losses are passive: they offset passive income freely, and up to $25,000/yr can offset ordinary (W-2) income if you actively participate and your MAGI is under $100k (phasing out to $0 by $150k); unused losses carry forward. On sale, claimed depreciation is recaptured at up to 25%, and gains may owe capital-gains tax (a 1031 exchange can defer both). Figures are a year-1 estimate at your 24.0% rate — not tax advice; consult a CPA.
Schools (NCES district)
- District
- Omaha Public Schools
- NCES district ID
- 3174820
- Math proficiency
- 20% ▼ -10.00%
- Reading proficiency
- 28% ▼ -5.00%
- Median HH income
- $46,039
- Composite
- 20.83/100
- National rank
- #8502
- State rank
- #110 of 111 in NE
Livability — Omaha
- Score
- 84/100
- State rank
- #7
- US rank
- #663
Category grades
Schools grade is shown separately in the Schools card above.
Census & demographics
- Census place
- Omaha, NE
- County
- Douglas County · 538,646 people
- City population
- 552,986
- Metro
- Omaha-Council Bluffs, NE-IA
- Population (ZIP)
- 24,210
- Household income
- $42,185
- Rent vs Own
- Severe rent burden
- 1913.0
Population outlook (Douglas County) Hauer SSP2
- Today (2025)
- 625,245 people
- By 2030
- 661,613 · +5.8%
- By 2040
- 732,395 · +17.1%
- By 2050
- 801,988 · +28.3%
- By 2075
- 968,637 · +54.9%
- By 2100
- 1,101,871 · +76.2%
Race, ethnicity, and origin ACS 2023
- Neighborhood character
- Diverse neighborhood (Simpson 0.65)
- Race & ethnicity
- Black 52% Hispanic / Latino 21% White 17% Two or more races 15% Asian 3% Native American 1%
- Hispanic origin (detail)
- Mexican 14%
- Common ancestry
- Ukrainian 3% Lithuanian 0%
- Foreign-born
- 14% · Canada, Philippines
- Languages at home
- 75% English-only · Spanish 16% Other Asian/Pacific 3% French/Haitian/Cajun 1%
Political lean MEDSL · Douglas
- 2024 margin
- D (+10.2) · D 54.4% · R 44.2% · Other 1.4%
- 2008→2024 swing
- +5.5pp toward D · 2008: 4.6pp · 2024: 10.2pp
- All cycles
- 2024: D+10.2 2020: D+11.3 2016: D+1.4 2012: R+4.3 2008: D+4.6
Not yet ingested
- Civics
- —
Market trends
- HPI YoY
- ▲ 13.82%
- Current HPI
- 358.7174
- Rent YoY
- ▲ 3.22%
- Metro
- Omaha-Council Bluffs, NE-IA
- State GDP YoY
- ▲ 0.68%
- F500 in state
- 2
Industry mix (Fortune 500 HQ in NE)
| Industry | F500 HQs | Revenue |
|---|---|---|
| Conglomerate | 1 | $371B |
|
||
Price history
+30.0% since first listed13 events — show timeline
- 2026-05-07 Pending — GPRMLS
- 2026-04-07 Listing Removed — GPRMLS
- 2026-04-07 Listed $130,000 GPRMLS
- 2026-03-04 Listing Removed — GPRMLS
- 2026-03-04 Listed $135,000 GPRMLS
- 2026-01-30 Listed $145,000 GPRMLS
- 2024-11-12 Sold (Public Records) $125,000 Public Records
- 2024-11-08 Sold (MLS) $125,000 GPRMLS
- 2024-10-29 Pending — GPRMLS
- 2024-10-16 Price Changed $135,000 GPRMLS
- 2024-09-17 Listed $145,000 GPRMLS
- 2024-02-10 Listing Removed — GPRMLS
- 2024-01-24 Listed $100,000 GPRMLS
Property tax history
+10.5%/yrLatest (2025): $2,033 · +0.3% YoY. Source: county tax records.
Cash-flow waterfall
monthlySold comps — $/sqft
last 12 mo · ≤1 miLoading sold comps…