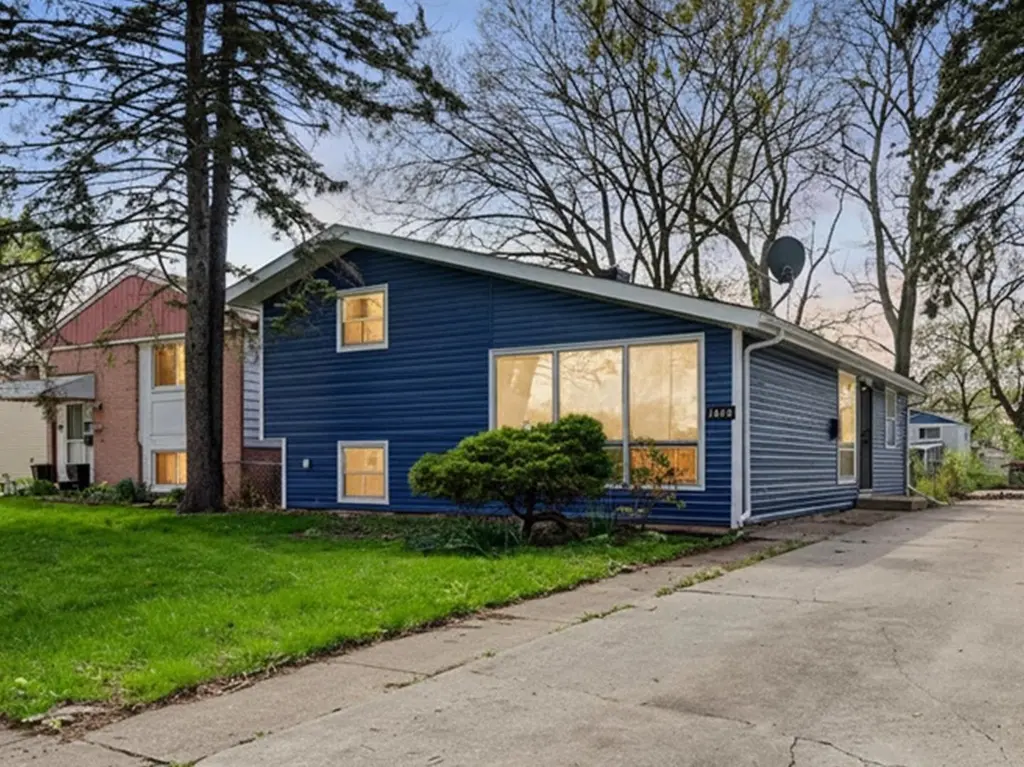
16420 Paulina St · Markham, IL
Flood risk 3/10 · Minor
- FEMA flood zone
- X (shaded)
- Chance of flooding over 30 yrs
- 0.2%
- Est. flood insurance / yr
- $507 – $1,088
Fire risk 1/10 · Minimal
- Est. fire insurance / yr
- $804 – $1,492
Heat risk 3/10 · Minor
- Hot days now (above 102°F)
- 7 days/yr
- Hot days in 30 yrs
- 15 days/yr
Wind risk 2/10 · Minimal
- Chance of severe wind over 30 yrs
- —
Air-quality risk 3/10 · Minor
- Unhealthy air days now
- 4 days/yr
- Unhealthy air days in 30 yrs
- 4 days/yr
Risk factors via First Street. Map © Google.
Why this score? — see what drove the B- grade
The composite is a weighted blend of 9 inputs, each scored 0–100. Each bar is that input's sub-score; the figure is the points it added to the 100-point composite (weight × sub-score).
- Cash flow +25.0/30.0
- Appreciation +10.0/10.0
- DSCR +8.2/10.0
- ARV discount +7.5/15.0
- 1% rule +5.3/10.0
- Livability +3.8/5.0
- Rent growth +2.5/5.0
- Condition / age +2.5/5.0
- Schools +0.7/10.0
$219,999
🖨 Deal sheet (PDF) 📄 Offer letter ✓ Due diligence
Listing remarks
Welcome to this beautifully maintained split-level home offering the perfect blend of space, comfort, and functionality! The main level features a bright and spacious living room, along with a seamless kitchen and dining room combo-ideal for everyday living and entertaining. Upstairs, you'll find a generous primary bedroom, two additional bedrooms, and a full bathroom. The fully finished basement provides the perfect space for gatherings, complete with a versatile bonus room that can be used as a home office, gym, or additional living area. Step outside to enjoy a great-sized yard, perfect for summer events and outdoor entertaining. A convenient side driveway offers ample parking. Don't mis
Key facts
- Great-sized yard
- Side driveway
- Bright living room
Tags
Property features AI
Finance
- Other: Living area source: Assessor; Property located in Markham (Thornton township)
- Financial info: Special service area: No
- HOA & community: No master association fee required
Exterior
- Parking: Four parking spaces total; Side apron parking (owned)
- Utilities: Water source: Lake Michigan; Public sewer
- Home design: Detached single-family split-level home; Fee simple ownership; Built before 1978 (61–70 years old)
- Construction: Frame construction
- Exterior features: Curb, sidewalks, street lights, and paved streets; Lot dimensions approximately 60 x 131
Interior
- Kitchen: Kitchen on main level (16 x 14)
- Bedrooms: Three bedrooms (master and two additional bedrooms on the second floor); Bonus room in basement (12 x 12)
- Bathrooms: One full bathroom
- Heating & cooling: Natural gas heating
- Interior features: Finished full basement; Seven total rooms
- Laundry & utility: Main-level laundry room
Neighborhood map
What this means for you Summary
Snapshot
- This is a 3-bed/1.0-bath single-family listed at $220k.
Deal economics
- At list price, monthly cash flow is $480 ($6k/yr) — positive.
- The deal already cash-flows at list — no discount required.
- Meets the 1% rule at list price ($2k rent vs $220k).
- Recommended offer: $213k (3.0% below list) — sets the bar for market timing.
Location & tenants
- Location reads 76/100 on livability (#186 in IL, #3,539 nationally) — a middle-class / working-renter tenant base. Strengths: commute A+, cost of living A+, housing A+; Watch: crime D, amenities D, employment D.
- Thornton Twp Hsd 205 (suburban): math 7% / reading 8% proficiency, ranked #594 of 620 in IL (top 96%) — low school quality limits family demand, transient renter base, plan for 1-2y turnover.
- Market conditions: 65 active listings in the ZIP; 8 comparable units currently listed for rent nearby; rentals leasing fast (median 2d on market — plan ~1-2 weeks tenant-placement turnaround); 6,272 units permitted in Cook County in 2024 (4,658 in 5+ unit buildings).
Forward outlook
- In year one you build about $24k of equity ($2k loan paydown + $22k appreciation (10.0% local appreciation)).
- At projected returns (10.0% appreciation + 3.0% rent growth), your $62k cash investment doubles in ~3 years — after that, you're playing with house money.
- By year 2, paydown + projected appreciation supports a ~$38k cash-out refi (75% LTV) — recoverable capital for the next deal without selling this one.
Negotiation context
- It's been on market 59 days — a 3% lower offer ($213k) is reasonable based on typical stale-listing flexibility.
- Current owner paid $50k; list at $220k implies a 340% gain — meaningful room to come down on a strong offer.
Questions for the listing agent
- It's been on market 59 days. Have you received any prior offers? Is the seller open to a 3% concession, seller financing, or rate buy-down credit?
- Built in 1961 — when were the roof, HVAC, electrical panel, plumbing, and water heater last replaced?
- Is there a deadline driving the sale (1031 exchange, divorce, estate, relocation)? That informs how much negotiation room exists.
- Schools are F-rated, which usually means shorter tenancies and higher turnover. Who's the typical renter profile here, and what's been the actual vacancy rate?
- Crime grade is D in this area — have there been break-ins, vandalism, or insurance claims at this property in the last 3 years? What carrier currently insures it and at what premium?
- What's the average days-on-market for RENTAL listings here right now (not sales)? A rising rental-DOM trend means longer vacancies and softer asking-rent achievability than the comps imply.
- What's the recent tenant-quality profile in this submarket — average credit score on applications, eviction rate, late-payment / NSF rate, and stable-employment percentage? A property-management company in the area should have these aggregated.
- How much new for-sale + rental construction is in the pipeline within 1–3 miles? Heavy new supply typically softens prices + rents 12–24 months out; constrained supply supports both.
Investment metrics
- 1% rule
- 1.03% ✓
- Cap rate
- 8.91%
- Cash-on-cash
- 9.35%
- DSCR
- 1.42
- GRM
- 8.1
CMA / ARV
- ARV (on-the-fly)
- $139,896
- Comps found
- 12
Show comp detail 12 sales within ~0.75 mi
| Address | Dist | Beds/Ba | Sqft | Sold | Price | $/sf | Match |
|---|---|---|---|---|---|---|---|
| 16221 Hermitage Ave | 0.25mi | 3/1.5 | 1,044 (0%) | 1mo | $192,000 | $184 | 86 |
| 16444 Wolcott Ave | 0.26mi | 3/1.5 | 1,080 (+3%) | 3mo | $112,500 | $104 | 78 |
| 16300 Winchester Ave | 0.34mi | 3/1.0 | 1,012 (-3%) | 2mo | $97,500 | $96 | 77 |
| 16807 Wood St | 0.48mi | 3/1.0 | 985 (-6%) | 0mo | $90,000 | $91 | 68 |
| 16019 Myrtle Ave | 0.59mi | 3/1.0 | 1,008 (-3%) | 3mo | $70,000 | $69 | 64 |
| 16207 Justine St | 0.35mi | 4/2.0 (+1) | 1,100 (+5%) | 3mo | $215,000 | $195 | 64 |
| 16628 Winchester Ave | 0.42mi | 2/1.0 (-1) | 1,134 (+9%) | 1mo | $84,000 | $74 | 60 |
| 1945 W 163rd St | 0.35mi | 3/1.0 | 1,188 (+14%) | 4mo | $159,500 | $134 | 58 |
| 16735 Dixie Hwy | 0.55mi | 2/1.0 (-1) | 965 (-8%) | 1mo | $153,000 | $159 | 56 |
| 1924 169th St | 0.65mi | 2/1.0 (-1) | 1,086 (+4%) | 3mo | $189,900 | $175 | 56 |
| 16784 Trapet Ave | 0.72mi | 3/1.0 | 970 (-7%) | 1mo | $96,000 | $99 | 54 |
| 16727 Head Ave | 0.71mi | 3/1.5 | 1,150 (+10%) | 1mo | $157,000 | $137 | 47 |
Match score weights: distance 35% · size 25% · config 20% · recency 20%. Top-matched comps best support the ARV.
Projected returns pro-forma
10.0% appreciation · 3.0% rent growth · sell at horizon
- IRR
- 31.1%
- Equity multiple
- 3.44×
- Total profit
- $150,305
- Equity at exit
- $198,193
- IRR
- 26.9%
- Equity multiple
- 7.79×
- Total profit
- $418,398
- Equity at exit
- $427,410
Cash invested: $61,600 (down + closing). Projections, not guarantees.
Landlord ↔ Tenant lean methodology
- Overall (STATE)
- 43 Moderately Tenant-Leaning
- State Illinois
- 43 Moderately Tenant-Leaning · D+7
- County
- — inherits STATE
- City
- — inherits STATE
ZIP-level market 60428
- Home prices YoY
- 8.5%
- Active inventory
- 65
- Price-to-rent
- 8.1×
Monthly cashflow live
- Estimated rent
- $2,276 high interval (Pro) →
- Mortgage (P&I)
- −$1,154
- Tax from tax record
- −$72 /mo · $870/yr
- Insurance
- −$92
- HOA
- −$0
- Vacancy / Maint / Mgmt
- −$478
- Net cashflow
- $480
Break-even live
Sensitivity live
| Price | -10% $605 | -5% $542 | +0% $480 | +5% $418 | +10% $356 |
|---|---|---|---|---|---|
| Rent | -10% $300 | -5% $390 | +0% $480 | +5% $570 | +10% $660 |
| Rate | -1.0pp $591 | -0.5pp $536 | base $480 | +0.5pp $423 | +1.0pp $365 |
UW: 25.0% down · 7.5% · 30yr · 1.5% tax · 5.0% vac · 8.0% maint · 8.0% mgmt
Financing live
Cash to close
- Down payment
- $55,000
- Closing costs
- $6,600
- Reserves months
- —
- Total cash needed
- —
Loan-product check · same deal, 3 products live
Conventional
25% down · 7.5% · 30yr
- Down + closing
- —
- Monthly P&I
- —
- Monthly cashflow
- —
- DSCR
- —
- Eligible?
- —
Personal DTI + credit; lowest rate.
DSCR
20% down · 8.5% · 30yr
- Down + closing
- —
- Monthly P&I
- —
- Monthly cashflow
- —
- DSCR
- —
- Eligible?
- —
No personal income docs; deal must DSCR.
Hard money
10% down · 12.0% · 12mo
- Down + closing
- —
- Monthly P&I
- —
- Monthly cashflow
- —
- DSCR
- —
- Eligible?
- —
Short-term bridge; refi at stabilization.
Rent comps 8 comps
| Address | Beds | Baths | Sqft | Rent | $/sqft | DOM | Units | Dist |
|---|---|---|---|---|---|---|---|---|
| 16125 Marshfield Ave Markham, IL | 3.0 | 1.0 | 1043 | $2,400 | $2.30 | 2d | 1 | 0.40mi |
| 16751 Crane Ave Hazel Crest, IL | 3.0 | 1.0 | 1200 | $1,800 | $1.50 | 2d | 1 | 0.75mi |
| 16901 Orchard Ridge Ave Hazel Crest, IL | 4.0 | 2.0 | 1406 | $2,700 | $1.92 | 2d | 1 | 0.96mi |
| 2107 171st St Unit 2107 Hazel Crest, IL | 3.0 | 1.5 | 1158 | $2,300 | $1.99 | 2d | 1 | 0.97mi |
| 16752 Artesian Ave Hazel Crest, IL | 3.0 | 1.0 | 867 | $2,500 | $2.88 | 2d | 1 | 0.99mi |
| 2308 170th St Hazel Crest, IL | 3.0 | 2.0 | 1020 | $2,400 | $2.35 | 2d | 1 | 1.00mi |
| 2173 171st St Hazel Crest, IL | 3.0 | 1.5 | 1159 | $2,350 | $2.03 | 2d | 1 | 1.02mi |
| 16048 Halsted St Unit 2 Harvey, IL | 3.0 | 1.0 | 1091 | $1,650 | $1.51 | 25d | 1 | 1.23mi |
Listing history 19 events
-
2026-06-21days on market $219,999 Active 59 DOM
-
2026-06-18days on market $219,999 Active 56 DOM
-
2026-06-17days on market $219,999 Active 55 DOM
-
2026-06-16days on market $219,999 Active 54 DOM
-
2026-06-15days on market $219,999 Active 53 DOM
-
2026-06-13days on market $219,999 Active 51 DOM
-
2026-06-13days on market $219,999 Active 50 DOM
-
2026-06-09days on market $219,999 Active 47 DOM
-
2026-06-08days on market $219,999 Active 46 DOM
-
2026-06-07days on market $219,999 Active 45 DOM
-
2026-06-04days on market $219,999 Active 42 DOM
-
2026-06-03days on market $219,999 Active 41 DOM
-
2026-06-02days on market $219,999 Active 40 DOM
-
2026-06-01days on market $219,999 Active 39 DOM
-
2026-05-31days on market $219,999 Active 38 DOM
-
2026-05-18price $219,999
-
2026-05-07price $224,999
-
2026-04-29price $227,499
-
1993-11-03soldstatus $50,000
ⓘ Source: listings_history table (triggers on properties + properties_extension) + one-shot
backfill from property_details.listing_events for pre-trigger history.
Tax reassessment forecast IL · Partial reset (capped growth)
- Current annual tax
- $870 · $72/mo
- Projected year-2 tax
- $2,932 · $244/mo
- Expected delta
- +$2,062/yr (+$172/mo · 237.0%)
ⓘ Screening estimate from a state-policy table — verify with the county assessor before closing.
Climate risk First Street
- Flood 3/10 Moderate FEMA zone X (shaded) · 20% chance over 30 yrs
- Wildfire 1/10 Low
- Heat 3/10 Moderate 7 d/yr ≥102°F today · 15 d/yr by 30 yrs out
- Wind 2/10 Low
- Air quality 3/10 Moderate 4 unhealthy d/yr today · 4 by 30 yrs out
Nearby sold comps map
Loading sold comps map…
Walkable amenities ~0.75 mi
Loading nearby amenities…
Taxation est. · year 1
- Rental income
- $27,311
- − Mortgage interest
- −$12,323
- − Property taxes
- −$870
- − Insurance
- −$1,100
- − Repairs & maintenance
- −$2,185
- − Management
- −$2,185
- − Depreciation
- −$6,400
- Taxable income
- $2,248
- Est. tax owed @ 24.0%
- −$539
- After-tax cash flow
- $5,222/yr
For passive investors: Depreciation is non-cash, so a rental often shows a tax loss while cash-flowing — sheltering income. Rental losses are passive: they offset passive income freely, and up to $25,000/yr can offset ordinary (W-2) income if you actively participate and your MAGI is under $100k (phasing out to $0 by $150k); unused losses carry forward. On sale, claimed depreciation is recaptured at up to 25%, and gains may owe capital-gains tax (a 1031 exchange can defer both). Figures are a year-1 estimate at your 24.0% rate — not tax advice; consult a CPA.
Schools (NCES district)
- District
- Thornton Twp Hsd 205
- NCES district ID
- 1738970
- Math proficiency
- 7% ▬ 0.00%
- Reading proficiency
- 8% ▼ -2.00%
- Median HH income
- $43,392
- Composite
- 6.92/100
- National rank
- #9976
- State rank
- #594 of 620 in IL
Livability — Markham
- Score
- 76/100
- State rank
- #186
- US rank
- #3539
Category grades
Schools grade is shown separately in the Schools card above.
Census & demographics
- Census place
- Markham, IL
- City population
- 10,980
- Population (ZIP)
- 10,980
Population outlook (Cook County) Hauer SSP2
- Today (2025)
- 5,347,519 people
- By 2030
- 5,357,703 · +0.2%
- By 2040
- 5,324,924 · -0.4%
- By 2050
- 5,230,762 · -2.2%
- By 2075
- 4,785,735 · -10.5%
- By 2100
- 4,188,836 · -21.7%
Race, ethnicity, and origin ACS 2023
- Neighborhood character
- Predominantly Black (69%)
- Race & ethnicity
- Black 69% Hispanic / Latino 17% White 11% Two or more races 4%
- Hispanic origin (detail)
- Mexican 16%
- Common ancestry
- Romanian 1% Lithuanian 1% Iranian 1%
- Foreign-born
- 8% · Canada
- Languages at home
- 86% English-only · Spanish 14%
Political lean MEDSL · Cook
- 2024 margin
- Solid D (+42.0) · D 70.4% · R 28.4% · Other 1.2%
- 2008→2024 swing
- -11.4pp toward R · 2008: 53.4pp · 2024: 42.0pp
- All cycles
- 2024: D+42.0 2020: D+50.3 2016: D+53.0 2012: D+49.4 2008: D+53.4
Not yet ingested
- Civics
- —
Market trends
- HPI YoY
- ▲ 23.63%
- Current HPI
- 302.333
- Rent YoY
- —
- Metro
- —
- State GDP YoY
- ▲ 1.59%
- F500 in state
- 60
Industry mix (Fortune 500 HQ in IL)
| Industry | F500 HQs | Revenue |
|---|---|---|
| Insurance | 4 | $201B |
|
||
| Consumer Goods | 4 | $87B |
|
||
| Industrial Machinery | 3 | $64B |
|
||
| Healthcare | 2 | $55B |
|
||
| Retail / Pharmacy | 1 | $148B |
|
||
| Agriculture / Food | 1 | $86B |
|
||
Price history
+340.0% since first listed4 events — show timeline
- 2026-05-18 Price Changed $219,999 MRED as Distributed by MLS Grid
- 2026-05-07 Price Changed $224,999 MRED as Distributed by MLS Grid
- 2026-04-29 Price Changed $227,499 MRED as Distributed by MLS Grid
- 1993-11-03 Sold (Public Records) $50,000 Public Records
Property tax history
-7.0%/yrLatest (2023): $870 · -51.6% YoY. Source: county tax records.
Cash-flow waterfall
monthlySold comps — $/sqft
last 12 mo · ≤1 miLoading sold comps…