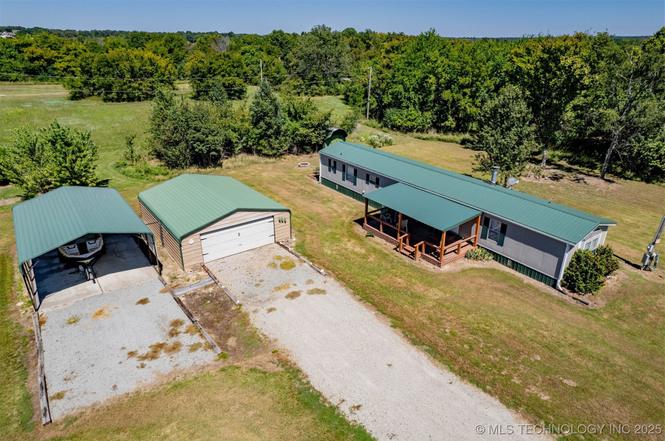
420229 E 1144 Rd · Texanna, OK
Flood risk 1/10 · Minimal
- FEMA flood zone
- X
- Chance of flooding over 30 yrs
- 0.0%
- Est. flood insurance / yr
- $435 – $905
Fire risk 5/10 · Moderate
- Est. fire insurance / yr
- $2,463 – $4,575
Heat risk 6/10 · Moderate
- Hot days now (above threshold)
- 7 days/yr
- Hot days in 30 yrs
- 19 days/yr
Wind risk No data
- Chance of severe wind over 30 yrs
- —
Air-quality risk No data
- Unhealthy air days now
- —
- Unhealthy air days in 30 yrs
- —
Risk factors via First Street. Map © Google.
Why this score? — see what drove the F grade
The composite is a weighted blend of 9 inputs, each scored 0–100. Each bar is that input's sub-score; the figure is the points it added to the 100-point composite (weight × sub-score).
- Appreciation +10.0/10.0
- Cash flow +9.6/30.0
- Livability +3.2/5.0
- DSCR +2.7/10.0
- Rent growth +2.5/5.0
- Schools +2.5/10.0
- Condition / age +2.5/5.0
- 1% rule +1.9/10.0
- ARV discount +0.0/15.0
$158,000
🖨 Deal sheet (PDF) 📄 Offer letter ✓ Due diligence
Listing remarks
CALLING LAKE LOVERS!!! This extremely well maintained property is just a mile from the serene shores of Lake Eufaula. The 3-bedroom, 2-bath home sits on a little over an acre of land and is completely move-in ready, fully furnished and tastefully decorated offering the ideal mix of modern updates and cozy charm. The interior features brand-new flooring throughout, a bright and spacious living area, a fully equipped kitchen with all appliances including the washer and dryer in the hidden utility room off of the kitchen, making your move even easier. Relax on your brand-new covered deck; it is perfect for enjoying morning coffee or evening gatherings with family and friends. With a newly ins
Key facts
- Hidden utility room
- Covered deck
- New flooring
Tags
Property features AI
Finance
- HOA & community: Homeowners association with $100 annual fee; Community gutters
Exterior
- Parking: Detached garage; Carport; 2 garage spaces
- Security: No safety shelter
- Utilities: Electricity available; Phone available; Water available; Rural water source; Septic tank
- Home design: Single wide manufactured home; 1 story; Faces west; Tie down foundation
- Construction: Manufactured construction; Vinyl siding; Metal roof; Year built per public records
- Exterior features: Covered porch; Fire pit; Gravel driveway; Rain gutters; Workshop; Beach access; Boat ramp/lift access; Less than 1 mile to water (Eufaula Lake)
Interior
- Kitchen: Dishwasher; Microwave; Oven; Range; Stove; Refrigerator; Plumbed for ice maker
- Flooring: Laminate flooring; Vinyl flooring
- Bathrooms: 2 full bathrooms
- Heating & cooling: Central heating (electric); Central air conditioning
- Interior features: Ceiling fan(s); Laminate counters; Vinyl windows; Electric oven and range connections; Plumbed for ice maker
- Laundry & utility: Washer hookup; Electric dryer hookup; Dryer; Washer; Electric water heater
Neighborhood map
What this means for you Summary
Snapshot
- This is a 3-bed/2.0-bath manufactured listed at $158k.
Deal economics
- At list price, monthly cash flow is $-108 ($-1k/yr) — negative.
- To cash-flow at today's rent, offer at most $139k (12.1% below list).
- To meet the 1% rule (rent ≥ 1% of price), the offer needs to be $109k (31.2% below list).
- Recommended offer: $109k (31.2% below list) — sets the bar for 1% rule.
- Cap rate 5.5% vs local median 2.6% in Texanna — top-decile yield for the area; either an underpriced asset or a hidden risk that comps aren't pricing in. Stress-test before assuming the spread holds.
Location & tenants
- Location reads 65/100 on livability (#140 in OK) — a middle-class / working-renter tenant base. Strengths: crime A+, cost of living A+, housing A+; Watch: employment C-, health & safety C-, amenities F.
- Checotah (town): math 32% / reading 28% proficiency, ranked #72 of 270 in OK (top 27%) — families likely to look elsewhere, expect single-tenant / working-renter base with shorter leases; 72% free/reduced lunch — lower-income household profile, screen leases tightly.
- Zoned schools: Marshall Es (422 students, 0% FRL); Checotah Ms (math 15% / reading 20%, grade F, #186 of 345 statewide, top 55%, 330 students, 0% FRL); Checotah Hs (math 12% / reading 17%, grade F, #348 of 447 statewide, top 79%, 394 students, 0% FRL) — zoned schools average 0% FRL vs 72% district-wide (72 pts lower); this property's tenant base skews higher-income than the district average.
- Zoned-school proficiency averages 16% at this address vs 30% district-wide (-14 pts) — the specific schools serving this property underperform the Checotah average; the district grade overstates school quality for this exact location.
- Market conditions: 151 active listings in the ZIP; 20 units permitted in McIntosh County in 2024 (0 in 5+ unit buildings).
Forward outlook
- In year one you build about $17k of equity ($1k loan paydown + $16k appreciation (10.0% local appreciation)).
- McIntosh County population projected at -17% by 2050 — secular population decline; favor cash flow + early exit over multi-decade hold.
- By year 3, paydown + projected appreciation supports a ~$43k cash-out refi (75% LTV) — recoverable capital for the next deal without selling this one.
Negotiation context
- It's been on market 225 days — a 12% lower offer ($139k) is reasonable based on typical stale-listing flexibility.
- 6 sale attempts since 2y ago; this cycle's ask has dropped $36k (19%) from the opening price — seller is motivated, your offer sets the floor, not the list.
Risks & watch-outs
- Climate carrying-cost: moderate wildfire risk; extreme-heat days projected 7→19/yr by 2055 (HVAC capex compounding) — expect insurance premiums to compound above CPI over the hold.
Questions for the listing agent
- What do current leases actually rent for vs. the listed asking? Can we see a recent rent roll and the last 12 months of T-12 income?
- It's been on market 225 days. Have you received any prior offers? Is the seller open to a 31% concession, seller financing, or rate buy-down credit?
- What does the HOA fee cover, when was the last increase, and are there any pending special assessments or reserve-fund shortfalls?
- Why hasn't it sold? Are there any deal-killer items the seller is aware of (foundation, flood, title, zoning, code violations)?
- Is there a deadline driving the sale (1031 exchange, divorce, estate, relocation)? That informs how much negotiation room exists.
- Schools are F-rated, which usually means shorter tenancies and higher turnover. Who's the typical renter profile here, and what's been the actual vacancy rate?
- The area grade is low — what's the realistic commute time and amenity access for the typical tenant pool here? Any planned neighborhood developments (good or bad) we should know about?
- What's the average days-on-market for RENTAL listings here right now (not sales)? A rising rental-DOM trend means longer vacancies and softer asking-rent achievability than the comps imply.
- What's the recent tenant-quality profile in this submarket — average credit score on applications, eviction rate, late-payment / NSF rate, and stable-employment percentage? A property-management company in the area should have these aggregated.
- How much new for-sale + rental construction is in the pipeline within 1–3 miles? Heavy new supply typically softens prices + rents 12–24 months out; constrained supply supports both.
Investment metrics
- 1% rule
- 0.69% ✗
- Cap rate
- 5.47%
- Cash-on-cash
- -2.93%
- DSCR
- 0.87
- GRM
- 12.1
CMA / ARV
- ARV (on-the-fly)
- $134,976
- Comps found
- 5
Show comp detail 5 sales within ~0.75 mi
| Address | Dist | Beds/Ba | Sqft | Sold | Price | $/sf | Match |
|---|---|---|---|---|---|---|---|
| 114210 S 4201 Rd | 0.25mi | 3/2.0 | 1,280 (+5%) | 5mo | $127,500 | $100 | 75 |
| 114126 S 4203 Rd | 0.32mi | 3/2.0 | 1,140 (-6%) | 4mo | $166,000 | $146 | 72 |
| 114671 S 4201 Rd | 0.31mi | 3/2.0 | 1,216 (0%) | 22mo | $135,000 | $111 | 67 |
| 114166 S 4209 Rd | 0.65mi | 2/1.0 (-1) | 1,200 (-1%) | 4mo | $128,000 | $107 | 55 |
| 420862 E 1145 | 0.66mi | 3/2.0 | 1,368 (+12%) | 22mo | $155,000 | $113 | 30 |
Match score weights: distance 35% · size 25% · config 20% · recency 20%. Top-matched comps best support the ARV.
Projected returns pro-forma
10.0% appreciation · 3.0% rent growth · sell at horizon
- IRR
- 22.2%
- Equity multiple
- 2.79×
- Total profit
- $79,116
- Equity at exit
- $142,339
- IRR
- 19.9%
- Equity multiple
- 6.39×
- Total profit
- $238,269
- Equity at exit
- $306,959
Cash invested: $44,240 (down + closing). Projections, not guarantees.
Landlord ↔ Tenant lean methodology
- Overall (STATE)
- 83 Strongly Landlord-Friendly
- State Oklahoma
- 83 Strongly Landlord-Friendly · R+20
- County
- — inherits STATE
- City
- — inherits STATE
ZIP-level market 74426
- Home prices YoY
- 5.3%
- Active inventory
- 151
- Price-to-rent
- 12.1×
Monthly cashflow live
- Estimated rent
- $1,087 medium interval (Pro) →
- Mortgage (P&I)
- −$829
- Tax from tax record
- −$64 /mo · $770/yr
- Insurance
- −$66
- HOA
- −$8
- Vacancy / Maint / Mgmt
- −$228
- Net cashflow
- $-108
Break-even live
Sensitivity live
| Price | -10% $-18 | -5% $-63 | +0% $-108 | +5% $-153 | +10% $-197 |
|---|---|---|---|---|---|
| Rent | -10% $-194 | -5% $-151 | +0% $-108 | +5% $-65 | +10% $-22 |
| Rate | -1.0pp $-28 | -0.5pp $-68 | base $-108 | +0.5pp $-149 | +1.0pp $-191 |
UW: 25.0% down · 7.5% · 30yr · 1.5% tax · 5.0% vac · 8.0% maint · 8.0% mgmt
Financing live
Cash to close
- Down payment
- $39,500
- Closing costs
- $4,740
- Reserves months
- —
- Total cash needed
- —
Loan-product check · same deal, 3 products live
Conventional
25% down · 7.5% · 30yr
- Down + closing
- —
- Monthly P&I
- —
- Monthly cashflow
- —
- DSCR
- —
- Eligible?
- —
Personal DTI + credit; lowest rate.
DSCR
20% down · 8.5% · 30yr
- Down + closing
- —
- Monthly P&I
- —
- Monthly cashflow
- —
- DSCR
- —
- Eligible?
- —
No personal income docs; deal must DSCR.
Hard money
10% down · 12.0% · 12mo
- Down + closing
- —
- Monthly P&I
- —
- Monthly cashflow
- —
- DSCR
- —
- Eligible?
- —
Short-term bridge; refi at stabilization.
HOA detail
- Monthly dues
- $8 · $96/yr
Listing history 18 events
-
2026-05-12status Pending
-
2026-04-17status Active
-
2026-04-13status Pending
-
2025-12-01price $158,000
-
2025-09-26price $185,000
-
2025-09-25$194,000 Active
-
2025-09-19historical
-
2025-09-11price $185,000
-
2025-08-08status Active
-
2025-07-24status Pending
-
2025-06-09price $189,000
-
2025-03-13$198,000 Active
-
2025-03-12historical
-
2024-09-12$194,000 Active
-
2024-09-08historical
-
2024-04-04price $197,500
-
2024-03-06$199,900 Active
-
2021-12-29soldstatus $175,000
ⓘ Source: listings_history table (triggers on properties + properties_extension) + one-shot
backfill from property_details.listing_events for pre-trigger history.
Tax reassessment forecast OK · Resets to sale price
- Current annual tax
- $770 · $64/mo
- Projected year-2 tax
- $1,422 · $118/mo
- Expected delta
- +$652/yr (+$54/mo · 84.7%)
ⓘ Screening estimate from a state-policy table — verify with the county assessor before closing.
Climate risk First Street
- Flood 1/10 Low FEMA zone X · 0% chance over 30 yrs
- Wildfire 5/10 Major
- Heat 6/10 Major
Nearby sold comps map
Loading sold comps map…
Walkable amenities ~0.75 mi
Loading nearby amenities…
Taxation est. · year 1
- Rental income
- $13,043
- − Mortgage interest
- −$8,850
- − Property taxes
- −$770
- − Insurance
- −$790
- − Repairs & maintenance
- −$1,043
- − Management
- −$1,043
- − HOA
- −$96
- − Depreciation
- −$4,596
- Taxable loss
- −$4,147
- Est. tax savings @ 24.0%
- +$995
- After-tax cash flow
- $-300/yr
For passive investors: Depreciation is non-cash, so a rental often shows a tax loss while cash-flowing — sheltering income. Rental losses are passive: they offset passive income freely, and up to $25,000/yr can offset ordinary (W-2) income if you actively participate and your MAGI is under $100k (phasing out to $0 by $150k); unused losses carry forward. On sale, claimed depreciation is recaptured at up to 25%, and gains may owe capital-gains tax (a 1031 exchange can defer both). Figures are a year-1 estimate at your 24.0% rate — not tax advice; consult a CPA.
Schools (NCES district)
- District
- Checotah
- NCES district ID
- 4007350
- Math proficiency
- 32% ▼ -7.00%
- Reading proficiency
- 28% ▼ -2.00%
- Median HH income
- $34,331
- Composite
- 24.73/100
- National rank
- #7607
- State rank
- #72 of 270 in OK
Livability — Texanna
- Score
- 65/100
- State rank
- #140
- US rank
- #13083
Category grades
Schools grade is shown separately in the Schools card above.
Census & demographics
- Census place
- Texanna, OK
- Population (ZIP)
- 9,482
Population outlook (McIntosh County) Hauer SSP2
- Today (2025)
- 18,935 people
- By 2030
- 18,272 · -3.5%
- By 2040
- 16,905 · -10.7%
- By 2050
- 15,771 · -16.7%
- By 2075
- 14,097 · -25.6%
- By 2100
- 12,572 · -33.6%
Race, ethnicity, and origin ACS 2023
- Neighborhood character
- Diverse neighborhood (Simpson 0.62)
- Race & ethnicity
- White 62% Native American 18% Two or more races 13% Hispanic / Latino 5% Black 3% Asian 2%
- Common ancestry
- Iranian 3% Slovak 2% Lithuanian 2%
- Foreign-born
- 2% · Canada
- Languages at home
- 94% English-only · German/W. Germanic 2% Other Indo-European 1% Spanish 1%
Political lean MEDSL · McIntosh
- 2024 margin
- Solid R (+52.7) · D 22.9% · R 75.7% · Other 1.4%
- 2008→2024 swing
- -33.5pp toward R · 2008: -19.3pp · 2024: -52.7pp
- All cycles
- 2024: R+52.7 2020: R+49.7 2016: R+42.5 2012: R+23.8 2008: R+19.3
Not yet ingested
- Civics
- —
Market trends
- HPI YoY
- ▲ 16.32%
- Current HPI
- 325.0751
- Rent YoY
- —
- Metro
- —
- State GDP YoY
- ▲ 1.55%
- F500 in state
- 6
Industry mix (Fortune 500 HQ in OK)
| Industry | F500 HQs | Revenue |
|---|---|---|
| Energy | 3 | $48B |
|
||
Price history
-9.7% since first listed18 events — show timeline
- 2026-05-12 Pending — MLS Technology, Inc.
- 2026-04-17 Relisted — MLS Technology, Inc.
- 2026-04-13 Pending — MLS Technology, Inc.
- 2025-12-01 Price Changed $158,000 MLS Technology, Inc.
- 2025-09-26 Price Changed $185,000 MLS Technology, Inc.
- 2025-09-25 Listed $194,000 MLS Technology, Inc.
- 2025-09-19 Listing Removed — MLS Technology, Inc.
- 2025-09-11 Price Changed $185,000 MLS Technology, Inc.
- 2025-08-08 Relisted — MLS Technology, Inc.
- 2025-07-24 Pending — MLS Technology, Inc.
- 2025-06-09 Price Changed $189,000 MLS Technology, Inc.
- 2025-03-13 Listed $198,000 MLS Technology, Inc.
- 2025-03-12 Listing Removed — MLS Technology, Inc.
- 2024-09-12 Listed $194,000 MLS Technology, Inc.
- 2024-09-08 Listing Removed — MLS Technology, Inc.
- 2024-04-04 Price Changed $197,500 MLS Technology, Inc.
- 2024-03-06 Listed $199,900 MLS Technology, Inc.
- 2021-12-29 Sold (Public Records) $175,000 Public Records
Property tax history
+2.0%/yrLatest (2025): $770 · +7.7% YoY. Source: county tax records.
Cash-flow waterfall
monthlySold comps — $/sqft
last 12 mo · ≤1 miLoading sold comps…