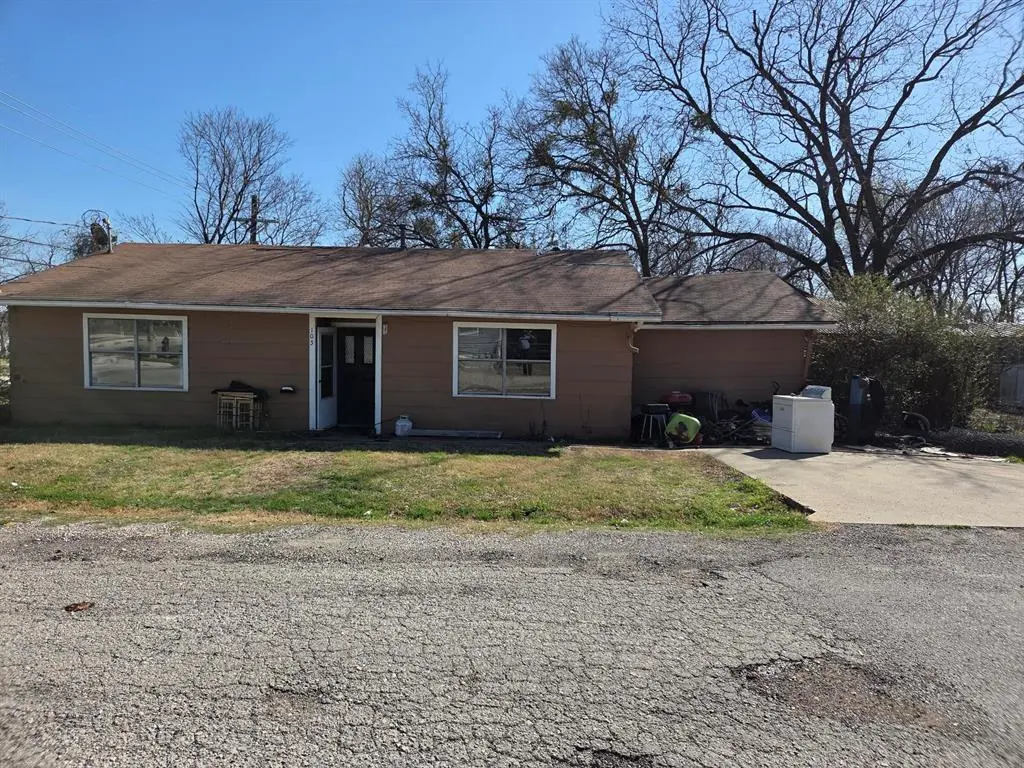
105 Royal Ln · Princeton, TX
Flood risk 1/10 · Minimal
- FEMA flood zone
- X (unshaded)
- Chance of flooding over 30 yrs
- 0.0%
- Est. flood insurance / yr
- $507 – $1,088
Fire risk 5/10 · Moderate
- Est. fire insurance / yr
- $1,222 – $2,270
Heat risk 7/10 · Major
- Hot days now (above 110°F)
- 7 days/yr
- Hot days in 30 yrs
- 23 days/yr
Wind risk 6/10 · Moderate
- Chance of severe wind over 30 yrs
- 27.0%
Air-quality risk 3/10 · Minor
- Unhealthy air days now
- 3 days/yr
- Unhealthy air days in 30 yrs
- 3 days/yr
Risk factors via First Street. Map © Google.
Why this score? — see what drove the B grade
The composite is a weighted blend of 9 inputs, each scored 0–100. Each bar is that input's sub-score; the figure is the points it added to the 100-point composite (weight × sub-score).
- Cash flow +26.7/30.0
- ARV discount +15.0/15.0
- DSCR +9.2/10.0
- 1% rule +7.6/10.0
- Schools +4.2/10.0
- Livability +3.1/5.0
- Condition / age +2.5/5.0
- Rent growth +2.2/5.0
- Appreciation +0.0/10.0
$160,000
🖨 Deal sheet (PDF) 📄 Offer letter ✓ Due diligence
Listing remarks MLS
Spanning 1,522 sq. ft., this residence offers a solid foundation and a functional layout, including ceiling fans for year-round comfort. While the home is in fair condition and requires some TLC, it presents a fantastic opportunity for a new buyer to customize and update the space to their exact taste. Please note the property is sold without appliances and features a driveway for parking. Sold as-is.
Key facts
- Driveway for parking
- Ceiling fans
- 6,970 sq ft lot
Tags
Neighborhood map
What this means for you Summary
Snapshot
- This is a 3-bed/1.0-bath single-family listed at $160k.
Deal economics
- At list price, monthly cash flow is $434 ($5k/yr) — positive.
- The deal already cash-flows at list — no discount required.
- Meets the 1% rule at list price ($2k rent vs $160k).
- Recommended offer: $150k (6.0% below list) — sets the bar for market timing.
- Cap rate 9.5% vs local median 4.5% in Princeton — top-decile yield for the area; either an underpriced asset or a hidden risk that comps aren't pricing in. Stress-test before assuming the spread holds.
Location & tenants
- Location reads 62/100 on livability (#969 in TX) — a middle-class / working-renter tenant base. Strengths: employment A+, housing A+, cost of living A; Watch: schools C-, amenities F, commute F.
- Princeton ISD (suburban): math 51% / reading 47% proficiency, ranked #188 of 826 in TX (top 23%) — families likely to look elsewhere, expect single-tenant / working-renter base with shorter leases.
- Market conditions: Rents soft (-1.0%/yr); 1404 active listings in the ZIP; 40 comparable units currently listed for rent nearby; rentals at typical pace (median 25d on market — plan ~3-4 weeks tenant-placement turnaround); 42% of comp listings sitting > 30 days — soft ceiling on asking rent; solid renter incomes; 19,194 units permitted in Collin County in 2024 (3,988 in 5+ unit buildings).
Forward outlook
- Local home prices are declining (-3.0%/yr); year-one equity from $1k of loan paydown is wiped out by about $5k of value loss. Plan a longer hold.
- Collin County population projected at +60% by 2050 — long-run rental-demand tailwind backs the buy-and-hold thesis.
Negotiation context
- It's been on market 88 days — a 6% lower offer ($150k) is reasonable based on typical stale-listing flexibility.
- 3 sale attempts since 15y ago; this cycle's ask has dropped $20k (11%) from the opening price — seller is motivated, your offer sets the floor, not the list.
Risks & watch-outs
- Climate carrying-cost: major wind risk, 27% chance of damaging wind over 30y; moderate wildfire risk; extreme-heat days projected 7→23/yr by 2055 (HVAC capex compounding) — expect insurance premiums to compound above CPI over the hold.
Questions for the listing agent
- It's been on market 88 days. Have you received any prior offers? Is the seller open to a 6% concession, seller financing, or rate buy-down credit?
- Built in 1975 — when were the roof, HVAC, electrical panel, plumbing, and water heater last replaced?
- Why hasn't it sold? Are there any deal-killer items the seller is aware of (foundation, flood, title, zoning, code violations)?
- Is there a deadline driving the sale (1031 exchange, divorce, estate, relocation)? That informs how much negotiation room exists.
- What's the average days-on-market for RENTAL listings here right now (not sales)? A rising rental-DOM trend means longer vacancies and softer asking-rent achievability than the comps imply.
- What's the recent tenant-quality profile in this submarket — average credit score on applications, eviction rate, late-payment / NSF rate, and stable-employment percentage? A property-management company in the area should have these aggregated.
- How much new for-sale + rental construction is in the pipeline within 1–3 miles? Heavy new supply typically softens prices + rents 12–24 months out; constrained supply supports both.
Investment metrics
- 1% rule
- 1.26% ✓
- Cap rate
- 9.54%
- Cash-on-cash
- 11.61%
- DSCR
- 1.52
- GRM
- 6.6
CMA / ARV
- ARV (median comp)
- $267,340
- List price
- $160,000
- Delta
- -40.15%
- Verdict
- UNDERPRICED
- Comps
- 20 within 1.0 mi
Show comp detail 12 sales within ~0.75 mi
| Address | Dist | Beds/Ba | Sqft | Sold | Price | $/sf | Match |
|---|---|---|---|---|---|---|---|
| 409 Kingsbury Ave | 0.40mi | 3/2.0 | 1,606 (+6%) | 2mo | $308,990 | $192 | 66 |
| 1211 Longneck Rd | 0.37mi | 3/2.0 | 1,652 (+8%) | 1mo | $375,000 | $227 | 64 |
| 521 Big Bend Pkwy | 0.48mi | 3/2.0 | 1,606 (+6%) | 1mo | $289,990 | $181 | 64 |
| 215 N 2nd St | 0.40mi | 3/2.0 | 1,380 (-9%) | 1mo | $245,000 | $178 | 61 |
| 205 Griffith Dr | 0.70mi | 3/2.5 | 1,521 (-0%) | 2mo | $244,980 | $161 | 60 |
| 204 Griffith | 0.70mi | 3/2.0 | 1,431 (-6%) | 3mo | $229,970 | $161 | 51 |
| 211 Griffith Dr | 0.71mi | 3/2.5 | 1,431 (-6%) | 2mo | $229,970 | $161 | 50 |
| 1117 Windermere Way | 0.63mi | 3/2.0 | 1,399 (-8%) | 5mo | $333,900 | $239 | 49 |
| 209 Timber Dr | 0.66mi | 3/2.0 | 1,664 (+9%) | 3mo | $274,900 | $165 | 48 |
| 418 Wydown Dr | 0.45mi | 4/2.0 (+1) | 1,718 (+13%) | 5mo | $294,990 | $172 | 45 |
| 203 Griffith Dr | 0.69mi | 4/2.5 (+1) | 1,651 (+8%) | 1mo | $249,980 | $151 | 42 |
| 232 Town Park Ave | 0.74mi | 3/2.0 | 1,381 (-9%) | 6mo | $289,980 | $210 | 41 |
Match score weights: distance 35% · size 25% · config 20% · recency 20%. Top-matched comps best support the ARV.
Projected returns pro-forma
-3.0% appreciation · 0.0% rent growth · sell at horizon
- IRR
- -2.6%
- Equity multiple
- 0.91×
- Total profit
- $-4,168
- Equity at exit
- $23,857
- IRR
- 3.3%
- Equity multiple
- 1.21×
- Total profit
- $9,324
- Equity at exit
- $13,834
Cash invested: $44,800 (down + closing). Projections, not guarantees.
Landlord ↔ Tenant lean methodology
- Overall (STATE)
- 87 Strongly Landlord-Friendly
- State Texas
- 87 Strongly Landlord-Friendly · R+5
- County
- — inherits STATE
- City
- — inherits STATE
ZIP-level market 75407
- Home prices YoY
- -30.3%
- Rents YoY
- -1.0%
- Active inventory
- 1404
- Price-to-rent
- 6.6×
Monthly cashflow live
- Estimated rent
- $2,019 high interval (Pro) →
- Mortgage (P&I)
- −$839
- Tax from tax record
- −$255 /mo · $3,065/yr
- Insurance
- −$67
- HOA
- −$0
- Vacancy / Maint / Mgmt
- −$424
- Net cashflow
- $434
Break-even live
Sensitivity live
| Price | -10% $524 | -5% $479 | +0% $434 | +5% $388 | +10% $343 |
|---|---|---|---|---|---|
| Rent | -10% $274 | -5% $354 | +0% $434 | +5% $513 | +10% $593 |
| Rate | -1.0pp $514 | -0.5pp $474 | base $434 | +0.5pp $392 | +1.0pp $350 |
UW: 25.0% down · 7.5% · 30yr · 1.5% tax · 5.0% vac · 8.0% maint · 8.0% mgmt
Financing live
Cash to close
- Down payment
- $40,000
- Closing costs
- $4,800
- Reserves months
- —
- Total cash needed
- —
Loan-product check · same deal, 3 products live
Conventional
25% down · 7.5% · 30yr
- Down + closing
- —
- Monthly P&I
- —
- Monthly cashflow
- —
- DSCR
- —
- Eligible?
- —
Personal DTI + credit; lowest rate.
DSCR
20% down · 8.5% · 30yr
- Down + closing
- —
- Monthly P&I
- —
- Monthly cashflow
- —
- DSCR
- —
- Eligible?
- —
No personal income docs; deal must DSCR.
Hard money
10% down · 12.0% · 12mo
- Down + closing
- —
- Monthly P&I
- —
- Monthly cashflow
- —
- DSCR
- —
- Eligible?
- —
Short-term bridge; refi at stabilization.
Rent comps 40 comps
| Address | Beds | Baths | Sqft | Rent | $/sqft | DOM | Units | Dist |
|---|---|---|---|---|---|---|---|---|
| 912 N 4th St Princeton, TX | 4.0 | 2.0 | 1448 | $2,249 | $1.55 | 13d | 1 | 0.16mi |
| 1008 N 4th St Princeton, TX | 3.0 | 2.0 | 1245 | $1,776 | $1.43 | 6d | 1 | 0.18mi |
| 712 Prairie Creek Dr Princeton, TX | 4.0 | 3.0 | 2049 | $2,350 | $1.15 | 44d | 1 | 0.21mi |
| 236 Cr-454 Princeton, TX | 3.0 | 2.5 | 1680 | $2,025 | $1.21 | 4d | 1 | 0.26mi |
| 600 Jefferson Ave Princeton, TX | 3.0 | 2.0 | 1300 | $1,800 | $1.38 | 19d | 1 | 0.39mi |
| 704 E College St Princeton, TX | 4.0 | 2.0 | 1710 | $1,575 | $0.92 | 44d | 1 | 0.39mi |
| 406 Kingsbury Ave Princeton, TX | 3.0 | 2.0 | 1810 | $2,095 | $1.16 | 44d | 1 | 0.39mi |
| 418 Kingsbury Ave Princeton, TX | 4.0 | 2.0 | 1810 | $2,095 | $1.16 | 44d | 1 | 0.42mi |
| 101 Teakwood Dr Princeton, TX | 4.0 | 2.0 | 1812 | $2,000 | $1.10 | 22d | 1 | 0.42mi |
| 228 N 4th St Princeton, TX | 3.0 | 2.0 | 1466 | $1,450 | $0.99 | 44d | 1 | 0.43mi |
| 100 E Brown St Princeton, TX | 3.0 | 1.0 | 1196 | $2,870 | $2.40 | 2d | 1 | 0.45mi |
| 604 Princeton Hts Princeton, TX | 3.0–5.0 | 2.0–2.5 | 1882 | $2,045 | $1.09 | 2d | 1 | 0.47mi |
| 806 Parkplace Rdg Princeton, TX | 4.0 | 2.5 | 1600 | $1,500 | $0.94 | 19d | 1 | 0.48mi |
| 812 Parkplace Rdg Princeton, TX | 4.0 | 2.5 | 1514 | $1,575 | $1.04 | 13d | 1 | 0.50mi |
| 819 Parkplace Rdg Princeton, TX | 3.0 | 2.5 | 1669 | $1,700 | $1.02 | 44d | 1 | 0.50mi |
| 804 Princeton Hts Princeton, TX | 3.0 | 2.5 | 2232 | $2,225 | $1.00 | 6d | 1 | 0.54mi |
| 1001 Weiss Ave Princeton, TX | 3.0 | 2.0 | 1209 | $1,595 | $1.32 | 44d | 1 | 0.56mi |
| 837 E College St Princeton, TX | 4.0 | 2.5 | 1575 | $1,500 | $0.95 | 44d | 1 | 0.56mi |
| 907 Princeton Hts Princeton, TX | 3.0 | 2.5 | 1627 | $1,995 | $1.23 | 25d | 1 | 0.57mi |
| 1106 Parkway Trl Princeton, TX | 3.0 | 2.5 | 1404 | $1,500 | $1.07 | 44d | 1 | 0.61mi |
| 1106 Princeton Hts Princeton, TX | 3.0 | 2.0 | 1399 | $1,795 | $1.28 | 2d | 1 | 0.68mi |
| 412 Stonecreek Dr Princeton, TX | 3.0 | 2.0 | 1763 | $1,950 | $1.11 | 44d | 1 | 0.69mi |
| 1605 Fox DR Princeton, TX | 3.0 | 2.0 | 1435 | $2,208 | $1.54 | 2d | 11 | 0.70mi |
| 217 Creekwood Dr Princeton, TX | 3.0 | 2.0 | 1754 | $1,825 | $1.04 | 13d | 1 | 0.70mi |
| 515 Creekside Dr Princeton, TX | 3.0 | 2.0 | 1540 | $1,900 | $1.23 | 44d | 1 | 0.71mi |
| 1702 Chapel Hill Rd Princeton, TX | 4.0 | 2.5 | 2121 | $1,995 | $0.94 | 8d | 1 | 0.71mi |
| 1206 Dye Blvd Princeton, TX | 4.0 | 6.0 | 1845 | $2,199 | $1.19 | 44d | 1 | 0.71mi |
| 1104 Witherspoon Ln Princeton, TX | 4.0 | 3.0 | 1845 | $2,200 | $1.19 | 44d | 1 | 0.73mi |
| 1709 Chapel Hill Rd Princeton, TX | 3.0 | 2.5 | 1633 | $1,695 | $1.04 | 44d | 1 | 0.73mi |
| 1708 Chapel Hill Rd Princeton, TX | 3.0 | 2.5 | 1826 | $1,850 | $1.01 | 4d | 1 | 0.73mi |
| 1658 Palladio Loop Unit 1658 Princeton, TX | 3.0 | 3.5 | 1994 | $1,950 | $0.98 | 21d | 1 | 0.73mi |
| 1210 Bullock Dr Princeton, TX | 3.0 | 3.0 | 1627 | $1,850 | $1.14 | 44d | 1 | 0.73mi |
| 1710 Washington St Princeton, TX | 3.0 | 2.0 | 1437 | $1,770 | $1.23 | 2d | 1 | 0.74mi |
| 1211 Princeton Hts Princeton, TX | 3.0 | 2.0 | 1401 | $1,995 | $1.42 | 44d | 1 | 0.74mi |
| 1211 Princeton Hts Princeton, TX | 3.0 | 2.0 | 1401 | $1,770 | $1.26 | 18d | 1 | 0.74mi |
| 1215 Bullock Dr Princeton, TX | 4.0 | 2.5 | 1836 | $2,095 | $1.14 | 44d | 1 | 0.74mi |
| 414 E Hazelwood St Princeton, TX | 3.0 | 2.0 | 1328 | $1,595 | $1.20 | 25d | 1 | 0.76mi |
| 1414 Windermere Way Princeton, TX | 3.0 | 2.5 | 1635 | $1,995 | $1.22 | 21d | 1 | 0.77mi |
| 1802 Washington St Princeton, TX | 3.0 | 2.5 | 1920 | $1,950 | $1.02 | 25d | 1 | 0.77mi |
| 226 Griffith Dr Princeton, TX | 3.0 | 2.5 | 1339 | $1,675 | $1.25 | 25d | 1 | 0.78mi |
Listing history 15 events
-
2026-03-30price $160,000 404-char remark
Show marketing remark (404 chars)
Spanning 1,522 sq. ft., this residence offers a solid foundation and a functional layout, including ceiling fans for year-round comfort. While the home is in fair condition and requires some TLC, it presents a fantastic opportunity for a new buyer to customize and update the space to their exact taste. Please note the property is sold without appliances and features a driveway for parking. Sold as-is.
-
2026-03-17price $169,500 404-char remark
Show marketing remark (404 chars)
Spanning 1,522 sq. ft., this residence offers a solid foundation and a functional layout, including ceiling fans for year-round comfort. While the home is in fair condition and requires some TLC, it presents a fantastic opportunity for a new buyer to customize and update the space to their exact taste. Please note the property is sold without appliances and features a driveway for parking. Sold as-is.
-
2026-03-02$179,500 Active 404-char remark
Show marketing remark (404 chars)
Spanning 1,522 sq. ft., this residence offers a solid foundation and a functional layout, including ceiling fans for year-round comfort. While the home is in fair condition and requires some TLC, it presents a fantastic opportunity for a new buyer to customize and update the space to their exact taste. Please note the property is sold without appliances and features a driveway for parking. Sold as-is.
-
2024-08-09soldstatus
-
2012-03-27soldstatus Closed 340-char remark
Show marketing remark (340 chars)
2 bedroom, 1 bath home with covered front porch and screened-in side porch on large corner lot. Fenced yard along back and storage building in back yard. Case # 491-778225. More properties may be found on www. hudhomestore.com. HUD homes are sold AS_IS. Visit www. mmrem.com for information. Information deemed reliable but not guaranteed.
-
2012-02-28status Pending 340-char remark
Show marketing remark (340 chars)
2 bedroom, 1 bath home with covered front porch and screened-in side porch on large corner lot. Fenced yard along back and storage building in back yard. Case # 491-778225. More properties may be found on www. hudhomestore.com. HUD homes are sold AS_IS. Visit www. mmrem.com for information. Information deemed reliable but not guaranteed.
-
2012-02-24$24,000 Active 340-char remark
Show marketing remark (340 chars)
2 bedroom, 1 bath home with covered front porch and screened-in side porch on large corner lot. Fenced yard along back and storage building in back yard. Case # 491-778225. More properties may be found on www. hudhomestore.com. HUD homes are sold AS_IS. Visit www. mmrem.com for information. Information deemed reliable but not guaranteed.
-
2012-01-27soldstatus
-
2011-05-12historical
-
2011-04-11price $75,000
-
2011-03-21price $79,900
-
2011-01-14$85,000 Active
-
2002-11-20soldstatus
-
2001-03-13soldstatus
-
1999-04-07soldstatus
ⓘ Source: listings_history table (triggers on properties + properties_extension) + one-shot
backfill from property_details.listing_events for pre-trigger history.
Tax reassessment forecast TX · Resets to sale price
- Current annual tax
- $3,065 · $255/mo
- Projected year-2 tax
- $3,065 · $255/mo
- Expected delta
- $0/yr ($0/mo · 0.0%)
ⓘ Screening estimate from a state-policy table — verify with the county assessor before closing.
Climate risk First Street
- Flood 1/10 Low FEMA zone X (unshaded) · 0% chance over 30 yrs
- Wildfire 5/10 Major
- Heat 7/10 Severe 7 d/yr ≥110°F today · 23 d/yr by 30 yrs out
- Wind 6/10 Major 27% chance of damaging wind over 30 yrs
- Air quality 3/10 Moderate 3 unhealthy d/yr today · 3 by 30 yrs out
Nearby sold comps map
Loading sold comps map…
Walkable amenities ~0.75 mi
Loading nearby amenities…
Taxation est. · year 1
- Rental income
- $24,222
- − Mortgage interest
- −$8,962
- − Property taxes
- −$3,065
- − Insurance
- −$800
- − Repairs & maintenance
- −$1,938
- − Management
- −$1,938
- − Depreciation
- −$4,655
- Taxable income
- $2,865
- Est. tax owed @ 24.0%
- −$688
- After-tax cash flow
- $4,514/yr
For passive investors: Depreciation is non-cash, so a rental often shows a tax loss while cash-flowing — sheltering income. Rental losses are passive: they offset passive income freely, and up to $25,000/yr can offset ordinary (W-2) income if you actively participate and your MAGI is under $100k (phasing out to $0 by $150k); unused losses carry forward. On sale, claimed depreciation is recaptured at up to 25%, and gains may owe capital-gains tax (a 1031 exchange can defer both). Figures are a year-1 estimate at your 24.0% rate — not tax advice; consult a CPA.
Schools (NCES district)
- District
- Princeton ISD
- NCES district ID
- 4835850
- Math proficiency
- 51% ▼ -8.00%
- Reading proficiency
- 47% ▬ 0.00%
- Median HH income
- $54,827
- Composite
- 42.44/100
- National rank
- #3226
- State rank
- #188 of 826 in TX
Livability — Princeton
- Score
- 62/100
- State rank
- #969
- US rank
- #17215
Category grades
Schools grade is shown separately in the Schools card above.
Census & demographics
- Census place
- Princeton, TX
- County
- Collin County · 1,159,394 people
- City population
- 34,171
- Metro
- Dallas-Fort Worth-Arlington, TX
- Population (ZIP)
- 34,171
- Household income
- $100,037
- Rent vs Own
- Severe rent burden
- 368.0
Population outlook (Collin County) Hauer SSP2
- Today (2025)
- 1,210,074 people
- By 2030
- 1,358,201 · +12.2%
- By 2040
- 1,654,061 · +36.7%
- By 2050
- 1,937,359 · +60.1%
- By 2075
- 2,567,039 · +112.1%
- By 2100
- 2,952,048 · +144.0%
Race, ethnicity, and origin ACS 2023
- Neighborhood character
- Diverse neighborhood (Simpson 0.66)
- Race & ethnicity
- White 47% Hispanic / Latino 30% Black 17% Two or more races 10% Asian 4% Native American 1%
- Hispanic origin (detail)
- Mexican 26%
- Common ancestry
- Lithuanian 2% Romanian 1% Russian 1%
- Foreign-born
- 15% · Canada, China, Mexico
- Languages at home
- 70% English-only · Spanish 22% Other Indo-European 2% Other Asian/Pacific 1%
Political lean MEDSL · Collin
- 2024 margin
- R (+11.1) · D 43.1% · R 54.3% · Other 2.6%
- 2008→2024 swing
- +14.4pp toward D · 2008: -25.6pp · 2024: -11.1pp
- All cycles
- 2024: R+11.1 2020: R+4.3 2016: R+17.0 2012: R+31.6 2008: R+25.6
Not yet ingested
- Civics
- —
Market trends
- HPI YoY
- ▼ -103.99%
- Current HPI
- 238.9373
- Rent YoY
- ▼ -1.02%
- Metro
- Dallas-Fort Worth-Arlington, TX
- State GDP YoY
- ▲ 3.95%
- F500 in state
- 110
Industry mix (Fortune 500 HQ in TX)
| Industry | F500 HQs | Revenue |
|---|---|---|
| Energy | 16 | $1,198B |
|
||
| Technology | 5 | $198B |
|
||
| Engineering / Construction | 4 | $72B |
|
||
| Energy Services | 3 | $60B |
|
||
| Utilities | 3 | $41B |
|
||
| Healthcare | 2 | $330B |
|
||
Price history
+88.2% since first listed15 events — show timeline
- 2026-03-30 Price Changed $160,000 NTREIS
- 2026-03-17 Price Changed $169,500 NTREIS
- 2026-03-02 Listed $179,500 NTREIS
- 2024-08-09 Sold (Public Records) — Public Records
- 2012-03-27 Sold (MLS) — NTREIS
- 2012-02-28 Pending — NTREIS
- 2012-02-24 Listed $24,000 NTREIS
- 2012-01-27 Sold (Public Records) — Public Records
- 2011-05-12 Listing Removed — NTREIS
- 2011-04-11 Price Changed $75,000 NTREIS
- 2011-03-21 Price Changed $79,900 NTREIS
- 2011-01-14 Listed $85,000 NTREIS
- 2002-11-20 Sold (Public Records) — Public Records
- 2001-03-13 Sold (Public Records) — Public Records
- 1999-04-07 Sold (Public Records) — Public Records
Property tax history
+2.7%/yrLatest (2025): $3,065 · -2.6% YoY. Source: county tax records.
Cash-flow waterfall
monthlySold comps — $/sqft
last 12 mo · ≤1 miLoading sold comps…