7805 Rice Dr · Rowlett, TX
Flood risk 1/10 · Minimal
- FEMA flood zone
- X (unshaded)
- Chance of flooding over 30 yrs
- 0.0%
- Est. flood insurance / yr
- $507 – $1,088
Fire risk 1/10 · Minimal
- Est. fire insurance / yr
- $1,222 – $2,270
Heat risk 8/10 · Major
- Hot days now (above 110°F)
- 7 days/yr
- Hot days in 30 yrs
- 25 days/yr
Wind risk 6/10 · Moderate
- Chance of severe wind over 30 yrs
- 27.0%
Air-quality risk 2/10 · Minimal
- Unhealthy air days now
- 2 days/yr
- Unhealthy air days in 30 yrs
- 2 days/yr
Risk factors via First Street. Map © Google.
Why this score? — see what drove the D+ grade
The composite is a weighted blend of 9 inputs, each scored 0–100. Each bar is that input's sub-score; the figure is the points it added to the 100-point composite (weight × sub-score).
- ARV discount +15.0/15.0
- Cash flow +9.7/30.0
- 1% rule +5.4/10.0
- Livability +3.8/5.0
- Schools +2.9/10.0
- DSCR +2.8/10.0
- Condition / age +2.5/5.0
- Rent growth +2.2/5.0
- Appreciation +1.6/10.0
$230,000
🖨 Deal sheet (PDF) 📄 Offer letter ✓ Due diligence
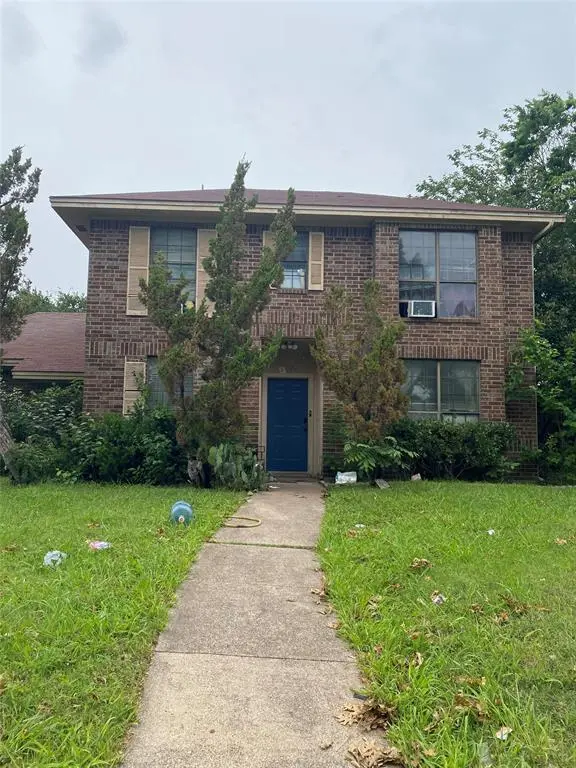
Listing remarks
INVESTOR SPECIAL. Sold AS-IS. Property needs TLC. No Survey. Total sq footage 2327 with garage conversion
Key facts
- 7,231 sq ft lot
- Garage
- Built 1986
Property features AI
Finance
- Other: Property type: Residential (Single Family Residence); Parking/garage details indicate converted garage and zero listed garage spaces; Fireplace: One wood-burning fireplace
- Financial info: Listing terms: Cash; Loan type: Treat As Clear; No second mortgage indicated
- HOA & community: No association
Exterior
- Parking: Converted garage; No garage or covered/carport spaces
- Utilities: City water; City sewer; No municipal utility district
- Home design: Single family residence; Attached property; Built in 1986
- Construction: Year built: 1986
- Exterior features: Lot under 0.5 acre (approximately 0.166 acres); Subdivision: College Park 02; Directions: Exit Dalrock, turn left, left on Miller, left on Auburn, left on Rice
Interior
- Kitchen: Disposal
- Bedrooms: Four bedrooms total; Primary bedroom on level 2
- Bathrooms: Two full bathrooms; One half bathroom
- Interior features: Cable TV available; Two living areas; One dining area; Two levels
- Laundry & utility: No washer/dryer specified
Neighborhood map
What this means for you Summary
Snapshot
- This is a 3-bed/2.0-bath single-family listed at $230k.
Deal economics
- At list price, monthly cash flow is $-150 ($-2k/yr) — negative.
- To cash-flow at today's rent, offer at most $204k (11.5% below list).
- Meets the 1% rule at list price ($2k rent vs $230k).
- Recommended offer: $204k (11.5% below list) — sets the bar for cash-flow.
- Cap rate 5.5% vs local median 3.2% in Rowlett — top-decile yield for the area; either an underpriced asset or a hidden risk that comps aren't pricing in. Stress-test before assuming the spread holds.
Location & tenants
- Location reads 75/100 on livability (#147 in TX, #4,150 nationally) — a middle-class / working-renter tenant base. Strengths: employment A+, housing A+, crime A-; Watch: amenities F, commute F, health & safety D-.
- Garland ISD (suburban): math 27% / reading 37% proficiency, ranked #553 of 826 in TX (top 67%) — families likely to look elsewhere, expect single-tenant / working-renter base with shorter leases.
- Market conditions: Rents soft (-1.2%/yr); 295 active listings in the ZIP; 40 comparable units currently listed for rent nearby; rentals at typical pace (median 23d on market — plan ~3-4 weeks tenant-placement turnaround); solid renter incomes; 12,577 units permitted in Dallas County in 2024 (6,829 in 5+ unit buildings).
Forward outlook
- Local home prices are declining (-3.0%/yr); year-one equity from $2k of loan paydown is wiped out by about $7k of value loss. Plan a longer hold.
- Dallas County population projected at +35% by 2050 — long-run rental-demand tailwind backs the buy-and-hold thesis.
Negotiation context
- It's been on market 47 days — a 3% lower offer ($223k) is reasonable based on typical stale-listing flexibility.
- 2 sale attempts with the ask held roughly flat each time — persistent listings suggest the price (not the market) is what's stuck; bring a comps-based counter.
Risks & watch-outs
- Watch-outs: property tax is 3.9% of price.
- Climate carrying-cost: major wind risk, 27% chance of damaging wind over 30y; extreme-heat days projected 7→25/yr by 2055 (HVAC capex compounding) — expect insurance premiums to compound above CPI over the hold.
Questions for the listing agent
- What do current leases actually rent for vs. the listed asking? Can we see a recent rent roll and the last 12 months of T-12 income?
- It's been on market 47 days. Have you received any prior offers? Is the seller open to a 11% concession, seller financing, or rate buy-down credit?
- Property tax is high relative to price — has the assessment been appealed recently, and will the sale trigger a re-assessment?
- Is there a deadline driving the sale (1031 exchange, divorce, estate, relocation)? That informs how much negotiation room exists.
- The area grade is low — what's the realistic commute time and amenity access for the typical tenant pool here? Any planned neighborhood developments (good or bad) we should know about?
- What's the average days-on-market for RENTAL listings here right now (not sales)? A rising rental-DOM trend means longer vacancies and softer asking-rent achievability than the comps imply.
- What's the recent tenant-quality profile in this submarket — average credit score on applications, eviction rate, late-payment / NSF rate, and stable-employment percentage? A property-management company in the area should have these aggregated.
- How much new for-sale + rental construction is in the pipeline within 1–3 miles? Heavy new supply typically softens prices + rents 12–24 months out; constrained supply supports both.
Investment metrics
- 1% rule
- 1.04% ✓
- Cap rate
- 5.51%
- Cash-on-cash
- -2.79%
- DSCR
- 0.88
- GRM
- 8.0
CMA / ARV
- ARV (median comp)
- $335,774
- List price
- $230,000
- Delta
- -31.50%
- Verdict
- UNDERPRICED
- Comps
- 20 within 1.0 mi
Show comp detail 12 sales within ~0.75 mi
| Address | Dist | Beds/Ba | Sqft | Sold | Price | $/sf | Match |
|---|---|---|---|---|---|---|---|
| 3305 Lake Highlands Dr | 0.35mi | 3/2.0 | 2,225 (-0%) | 3mo | $399,900 | $180 | 81 |
| 3413 Lake Highlands Dr | 0.40mi | 4/2.0 (+1) | 2,284 (+2%) | 0mo | $439,000 | $192 | 73 |
| 8301 Martha Ln | 0.47mi | 4/2.0 (+1) | 2,240 (+0%) | 3mo | $422,900 | $189 | 71 |
| 7609 Redondo Dr | 0.52mi | 3/3.0 | 2,269 (+2%) | 2mo | $450,000 | $198 | 67 |
| 7505 Sunset Blvd | 0.64mi | 3/2.5 | 2,388 (+7%) | 1mo | $509,990 | $214 | 56 |
| 1922 Waterwalk Dr | 0.66mi | 3/2.5 | 2,364 (+6%) | 3mo | $439,490 | $186 | 55 |
| 7002 Garner Rd | 0.52mi | 3/2.5 | 1,980 (-11%) | 0mo | $399,000 | $202 | 54 |
| 7801 Cousteau Dr | 0.74mi | 3/2.5 | 2,150 (-4%) | 4mo | $330,000 | $153 | 53 |
| 7601 Tidewater Dr | 0.56mi | 4/2.5 (+1) | 2,060 (-8%) | 2mo | $395,000 | $192 | 52 |
| 3305 Bridgewater Dr | 0.40mi | 4/2.0 (+1) | 1,910 (-15%) | 4mo | $389,500 | $204 | 49 |
| 7204 Bayhill Ln | 0.53mi | 4/3.5 (+1) | 2,485 (+11%) | 3mo | $439,990 | $177 | 43 |
| 7613 Tidewater Dr | 0.56mi | 4/3.5 (+1) | 2,570 (+15%) | 2mo | $329,900 | $128 | 36 |
Match score weights: distance 35% · size 25% · config 20% · recency 20%. Top-matched comps best support the ARV.
Projected returns pro-forma
-3.0% appreciation · 0.0% rent growth · sell at horizon
- IRR
- -25.3%
- Equity multiple
- 0.17×
- Total profit
- $-53,516
- Equity at exit
- $34,294
- IRR
- -41.2%
- Equity multiple
- -0.32×
- Total profit
- $-84,763
- Equity at exit
- $19,886
Cash invested: $64,400 (down + closing). Projections, not guarantees.
Landlord ↔ Tenant lean methodology
- Overall (STATE)
- 87 Strongly Landlord-Friendly
- State Texas
- 87 Strongly Landlord-Friendly · R+5
- County
- — inherits STATE
- City
- — inherits STATE
ZIP-level market 75088
- Home prices YoY
- -2.0%
- Rents YoY
- -1.2%
- Active inventory
- 295
- Price-to-rent
- 8.0×
Monthly cashflow live
- Estimated rent
- $2,399 high interval (Pro) →
- Mortgage (P&I)
- −$1,206
- Tax from tax record
- −$743 /mo · $8,917/yr
- Insurance
- −$96
- HOA
- −$0
- Vacancy / Maint / Mgmt
- −$504
- Net cashflow
- $-150
Break-even live
Sensitivity live
| Price | -10% $-19 | -5% $-85 | +0% $-150 | +5% $-215 | +10% $-280 |
|---|---|---|---|---|---|
| Rent | -10% $-339 | -5% $-244 | +0% $-150 | +5% $-55 | +10% $40 |
| Rate | -1.0pp $-34 | -0.5pp $-91 | base $-150 | +0.5pp $-209 | +1.0pp $-270 |
UW: 25.0% down · 7.5% · 30yr · 1.5% tax · 5.0% vac · 8.0% maint · 8.0% mgmt
Financing live
Cash to close
- Down payment
- $57,500
- Closing costs
- $6,900
- Reserves months
- —
- Total cash needed
- —
Loan-product check · same deal, 3 products live
Conventional
25% down · 7.5% · 30yr
- Down + closing
- —
- Monthly P&I
- —
- Monthly cashflow
- —
- DSCR
- —
- Eligible?
- —
Personal DTI + credit; lowest rate.
DSCR
20% down · 8.5% · 30yr
- Down + closing
- —
- Monthly P&I
- —
- Monthly cashflow
- —
- DSCR
- —
- Eligible?
- —
No personal income docs; deal must DSCR.
Hard money
10% down · 12.0% · 12mo
- Down + closing
- —
- Monthly P&I
- —
- Monthly cashflow
- —
- DSCR
- —
- Eligible?
- —
Short-term bridge; refi at stabilization.
Rent comps 40 comps
| Address | Beds | Baths | Sqft | Rent | $/sqft | DOM | Units | Dist |
|---|---|---|---|---|---|---|---|---|
| 7916 Rice Dr Rowlett, TX | 4.0 | 2.5 | 2052 | $2,245 | $1.09 | 5d | 1 | 0.11mi |
| 7921 Rice Dr Rowlett, TX | 3.0 | 2.0 | 1847 | $2,131 | $1.15 | 0d | 1 | 0.13mi |
| 7601 Cornell Dr Rowlett, TX | 3.0 | 2.5 | 1801 | $2,400 | $1.33 | 44d | 1 | 0.14mi |
| 3305 Bucknell Dr Rowlett, TX | 3.0 | 2.0 | 1596 | $2,500 | $1.57 | 44d | 1 | 0.15mi |
| 8008 Cornell Dr Rowlett, TX | 3.0 | 2.0 | 1679 | $2,225 | $1.33 | 0d | 1 | 0.20mi |
| 7714 Straits Dr Rowlett, TX | 3.0 | 2.0 | 2346 | $1,200 | $0.51 | 3d | 1 | 0.21mi |
| 3205 Hillcrest Dr Rowlett, TX | 4.0 | 2.0 | 1776 | $2,299 | $1.29 | 3d | 1 | 0.35mi |
| 2509 Stanford St Unit A Rowlett, TX | 2.0 | 2.0 | 1834 | $1,750 | $0.95 | 22d | 1 | 0.36mi |
| 7301 Seascape Dr Rowlett, TX | 4.0 | 2.0 | 1608 | $1,275 | $0.79 | 2d | 1 | 0.40mi |
| 2305 Randi Rd Rowlett, TX | 3.0 | 2.0 | 1527 | $2,145 | $1.40 | 44d | 1 | 0.42mi |
| 7623 Coronado Dr Rowlett, TX | 3.0 | 3.0 | 2030 | $2,795 | $1.38 | 3d | 1 | 0.43mi |
| 3621 Geoffrey Trl Rowlett, TX | 4.0 | 2.5 | 1926 | $2,750 | $1.43 | 44d | 1 | 0.44mi |
| 8014 Meadowlark Ln Rowlett, TX | 4.0 | 2.0 | 1706 | $2,195 | $1.29 | 0d | 1 | 0.45mi |
| 2130 Argolis Dr Rowlett, TX | 4.0 | 3.5 | 2239 | $3,299 | $1.47 | 17d | 1 | 0.46mi |
| 7617 Dockside Dr Rowlett, TX | 3.0 | 2.0 | 1968 | $2,300 | $1.17 | 44d | 1 | 0.48mi |
| 2217 Laguna Dr Rowlett, TX | 3.0 | 4.0 | 2500 | $3,200 | $1.28 | 8d | 1 | 0.50mi |
| 2302 Dana Dr Rowlett, TX | 4.0 | 3.5 | 2223 | $2,900 | $1.30 | 8d | 1 | 0.51mi |
| 7843 Manilla Dr Rowlett, TX | 3.0 | 3.5 | 2273 | $3,100 | $1.36 | 13d | 1 | 0.51mi |
| 7813 Sunset Blvd Rowlett, TX | 3.0 | 3.5 | 2223 | $2,800 | $1.26 | 44d | 1 | 0.53mi |
| 2221 Tangleridge Ln Rowlett, TX | 3.0 | 2.0 | 1415 | $1,995 | $1.41 | 3d | 1 | 0.59mi |
| 2008 Naples Rowlett, TX | 3.0 | 2.5 | 2217 | $2,695 | $1.22 | 3d | 1 | 0.59mi |
| 2000 Naples Rowlett, TX | 3.0 | 2.5 | 2273 | $3,000 | $1.32 | 44d | 1 | 0.60mi |
| 7421 Sunset Blvd Rowlett, TX | 3.0 | 2.5 | 2460 | $2,995 | $1.22 | 44d | 1 | 0.61mi |
| 2218 Fuqua Rd Rowlett, TX | 4.0 | 2.0 | 1705 | $2,300 | $1.35 | 8d | 1 | 0.62mi |
| 1926 Chiesa Rd Rowlett, TX | 3.0 | 2.0 | 1550 | $2,400 | $1.55 | 44d | 1 | 0.63mi |
| 1926 Chiesa Rd Rowlett, TX | 3.0 | 2.0 | 1550 | $2,400 | $1.55 | 25d | 1 | 0.63mi |
| 7207 Daytona Mews Rowlett, TX | 3.0 | 2.5 | 2449 | $3,100 | $1.27 | 25d | 1 | 0.64mi |
| 7005 Sunset Blvd Rowlett, TX | 3.0 | 2.5 | 2208 | $3,200 | $1.45 | 44d | 1 | 0.67mi |
| 7009 Sunset Blvd Rowlett, TX | 3.0 | 2.5 | 2522 | $3,400 | $1.35 | 8d | 1 | 0.67mi |
| 4113 Starboard Trl Rowlett, TX | 3.0 | 2.5 | 1974 | $2,290 | $1.16 | 44d | 1 | 0.71mi |
| 1801 Bayside Dr Rowlett, TX | 1.0–4.0 | 1.0–4.0 | 1226 | $2,144 | $1.75 | 0d | 36 | 0.80mi |
| 8400 Sunset Blvd Rowlett, TX | 1.0–4.0 | 1.0–4.0 | 1303 | $2,019 | $1.55 | 0d | 33 | 0.89mi |
| 4522 Horizon Dr Rowlett, TX | 4.0 | 2.0 | 1572 | $2,205 | $1.40 | 44d | 1 | 0.91mi |
| 4702 Mariner Dr Rowlett, TX | 4.0 | 2.0 | 2094 | $2,500 | $1.19 | 44d | 1 | 0.98mi |
| 8405 Greenspoint Dr Rowlett, TX | 3.0 | 2.0 | 2283 | $2,995 | $1.31 | 5d | 1 | 0.99mi |
| 4617 Carmel Ln Rowlett, TX | 3.0 | 2.0 | 1402 | $1,999 | $1.43 | 25d | 1 | 0.99mi |
| 7621 Pebble Beach Dr Rowlett, TX | 3.0 | 2.0 | 1544 | $1,895 | $1.23 | 44d | 1 | 1.00mi |
| 8805 Bayshore Ln Rowlett, TX | 3.0 | 2.5 | 2148 | $1,600 | $0.74 | 5d | 1 | 1.06mi |
| 8902 Bayshore Ln Rowlett, TX | 4.0 | 2.5 | 1953 | $2,525 | $1.29 | 25d | 1 | 1.08mi |
| 4321 Duck Pond Ln Rowlett, TX | 3.0 | 2.5 | 1956 | $2,500 | $1.28 | 44d | 1 | 1.12mi |
Listing history 17 events
-
2026-06-18days on market $230,000 Active 47 DOM
-
2026-06-17days on market $230,000 Active 46 DOM
-
2026-06-16days on market $230,000 Active 45 DOM
-
2026-06-15days on market $230,000 Active 44 DOM
-
2026-06-13days on market $230,000 Active 42 DOM
-
2026-06-09days on market $230,000 Active 38 DOM
-
2026-06-08days on market $230,000 Active 37 DOM
-
2026-06-07days on market $230,000 Active 36 DOM
-
2026-06-04days on market $230,000 Active 33 DOM
-
2026-06-03days on market $230,000 Active 32 DOM
-
2026-06-02days on market $230,000 Active 31 DOM
-
2026-06-01days on market $230,000 Active 30 DOM
-
2026-05-31days on market $230,000 Active 29 DOM
-
2026-05-15status Active 105-char remark
-
2026-05-11historical Active Option Contract 105-char remark
-
2026-05-02$230,000 Active 105-char remark
-
1986-09-26soldstatus
ⓘ Source: listings_history table (triggers on properties + properties_extension) + one-shot
backfill from property_details.listing_events for pre-trigger history.
Tax reassessment forecast TX · Resets to sale price
- Current annual tax
- $8,917 · $743/mo
- Projected year-2 tax
- $8,917 · $743/mo
- Expected delta
- $0/yr ($0/mo · 0.0%)
ⓘ Screening estimate from a state-policy table — verify with the county assessor before closing.
Climate risk First Street
- Flood 1/10 Low FEMA zone X (unshaded) · 0% chance over 30 yrs
- Wildfire 1/10 Low
- Heat 8/10 Severe 7 d/yr ≥110°F today · 25 d/yr by 30 yrs out
- Wind 6/10 Major 27% chance of damaging wind over 30 yrs
- Air quality 2/10 Low 2 unhealthy d/yr today · 2 by 30 yrs out
Nearby sold comps map
Loading sold comps map…
Walkable amenities ~0.75 mi
Loading nearby amenities…
Taxation est. · year 1
- Rental income
- $28,792
- − Mortgage interest
- −$12,884
- − Property taxes
- −$8,917
- − Insurance
- −$1,150
- − Repairs & maintenance
- −$2,303
- − Management
- −$2,303
- − Depreciation
- −$6,691
- Taxable loss
- −$5,457
- Est. tax savings @ 24.0%
- +$1,310
- After-tax cash flow
- $-486/yr
For passive investors: Depreciation is non-cash, so a rental often shows a tax loss while cash-flowing — sheltering income. Rental losses are passive: they offset passive income freely, and up to $25,000/yr can offset ordinary (W-2) income if you actively participate and your MAGI is under $100k (phasing out to $0 by $150k); unused losses carry forward. On sale, claimed depreciation is recaptured at up to 25%, and gains may owe capital-gains tax (a 1031 exchange can defer both). Figures are a year-1 estimate at your 24.0% rate — not tax advice; consult a CPA.
Schools (NCES district)
- District
- Garland ISD
- NCES district ID
- 4820340
- Math proficiency
- 27% ▼ -23.00%
- Reading proficiency
- 37% ▼ -10.00%
- Median HH income
- $58,392
- Composite
- 28.63/100
- National rank
- #6706
- State rank
- #553 of 826 in TX
Livability — Rowlett
- Score
- 75/100
- State rank
- #147
- US rank
- #4150
Category grades
Schools grade is shown separately in the Schools card above.
Census & demographics
- Census place
- Rowlett, TX
- County
- Dallas County · 2,612,404 people
- City population
- 35,619
- Metro
- Dallas-Fort Worth-Arlington, TX
- Population (ZIP)
- 28,075
- Household income
- $105,313
- Rent vs Own
- Severe rent burden
- 626.0
Population outlook (Dallas County) Hauer SSP2
- Today (2025)
- 2,979,839 people
- By 2030
- 3,191,823 · +7.1%
- By 2040
- 3,619,611 · +21.5%
- By 2050
- 4,026,915 · +35.1%
- By 2075
- 4,957,073 · +66.4%
- By 2100
- 5,508,725 · +84.9%
Race, ethnicity, and origin ACS 2023
- Neighborhood character
- Diverse neighborhood (Simpson 0.62)
- Race & ethnicity
- White 56% Hispanic / Latino 19% Black 18% Two or more races 10% Asian 4%
- Hispanic origin (detail)
- Mexican 15%
- Common ancestry
- Slovak 3% Italian 2% Romanian 2%
- Foreign-born
- 10% · Canada, Vietnam
- Languages at home
- 84% English-only · Spanish 11% Other Indo-European 1% Other Asian/Pacific 1%
Political lean MEDSL · Dallas
- 2024 margin
- Strong D (+22.2) · D 60.2% · R 38.0% · Other 1.8%
- 2008→2024 swing
- +6.9pp toward D · 2008: 15.3pp · 2024: 22.2pp
- All cycles
- 2024: D+22.2 2020: D+31.6 2016: D+26.2 2012: D+15.4 2008: D+15.3
Not yet ingested
- Civics
- —
Market trends
- HPI YoY
- ▼ -6.72%
- Current HPI
- 328.27
- Rent YoY
- ▼ -1.22%
- Metro
- Dallas-Fort Worth-Arlington, TX
- State GDP YoY
- ▲ 3.95%
- F500 in state
- 110
Industry mix (Fortune 500 HQ in TX)
| Industry | F500 HQs | Revenue |
|---|---|---|
| Energy | 16 | $1,198B |
|
||
| Technology | 5 | $198B |
|
||
| Engineering / Construction | 4 | $72B |
|
||
| Energy Services | 3 | $60B |
|
||
| Utilities | 3 | $41B |
|
||
| Healthcare | 2 | $330B |
|
||
Price history
4 events — show timeline
- 2026-05-15 Relisted — NTREIS
- 2026-05-11 Contingent — NTREIS
- 2026-05-02 Listed $230,000 NTREIS
- 1986-09-26 Sold (Public Records) — Public Records
Property tax history
+7.5%/yrLatest (2025): $8,917 · +6.8% YoY. Source: county tax records.
Cash-flow waterfall
monthlySold comps — $/sqft
last 12 mo · ≤1 miLoading sold comps…