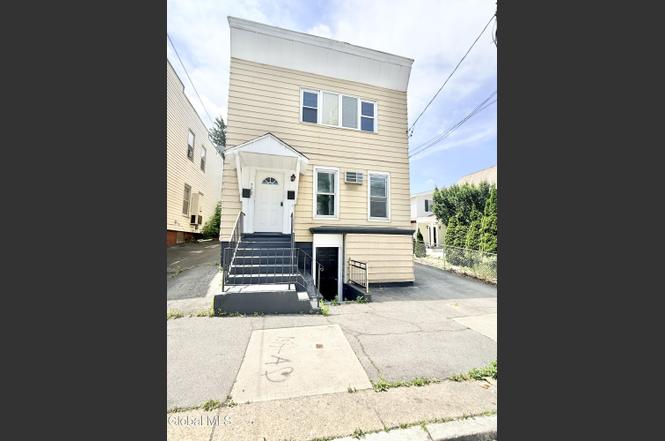
 Duplex
772 Eastern Ave · Schenectady, NY
Flood risk 1/10 · Minimal
- FEMA flood zone
- X (unshaded)
- Chance of flooding over 30 yrs
- 0.0%
- Est. flood insurance / yr
- $473 – $860
Fire risk 1/10 · Minimal
- Est. fire insurance / yr
- $691 – $1,283
Heat risk 3/10 · Minor
- Hot days now (above 95°F)
- 7 days/yr
- Hot days in 30 yrs
- 16 days/yr
Wind risk 2/10 · Minimal
- Chance of severe wind over 30 yrs
- 4.0%
Air-quality risk 1/10 · Minimal
- Unhealthy air days now
- 0 days/yr
- Unhealthy air days in 30 yrs
- 0 days/yr
Risk factors via First Street. Map © Google.
Why this score? — see what drove the D+ grade
The composite is a weighted blend of 9 inputs, each scored 0–100. Each bar is that input's sub-score; the figure is the points it added to the 100-point composite (weight × sub-score).
- Cash flow +21.0/30.0
- DSCR +6.7/10.0
- 1% rule +6.1/10.0
- Livability +3.9/5.0
- Schools +3.0/10.0
- Rent growth +2.5/5.0
- Condition / age +2.5/5.0
- ARV discount +0.0/15.0
- Appreciation +0.0/10.0
$260,000
🖨 Deal sheet 📄 Offer letter ✓ Due diligence
Multi-family units
County records classify this as Multi-Family (2-4 Unit). Listing-text estimate: 2 units. confirmed
Listing remarks MLS
"SAME" -- Excellent Condition
Key facts
- 2 family property
- Easy access
- Near ellis hospital
Tags
Property features AI
Exterior
- Parking: Driveway; 10 total parking spaces
- Utilities: 100 amp electric service; Public water; Public sewer and septic tank
- Home design: Duplex; Living area approximately 1,760 (total)
- Construction: Aluminum siding
- Exterior features: Rolled/Hot Mop roof; Rubber roof
Interior
- Bedrooms: Unit 1 has 3 bedrooms; Unit 2 has 2 bedrooms
- Flooring: Vinyl; Tile; Carpet
- Bathrooms: Two full bathrooms (one on the 1st level and one on the 2nd level)
- Heating & cooling: Baseboard heating; Electric heating; Hot water heating
- Interior features: Vinyl, tile and carpet flooring; Unfinished basement
Neighborhood map
What this means for you Summary
Snapshot
- This is a 2 × 2-bed/1.0-bath units multifamily listed at $260k.
Deal economics
- At list price, monthly cash flow is $369 ($4k/yr) — positive. Per door: $184/mo.
- The deal already cash-flows at list — no discount required.
- Meets the 1% rule at list price ($3k rent vs $260k).
- Cap rate 8.0% vs local median 6.3% in Schenectady — meaningfully above typical; check what's discounted (condition, days-on-market, listing class) to confirm the premium yield is real.
Location & tenants
- Location reads 78/100 on livability (#167 in NY, #2,597 nationally) — a middle-class / working-renter tenant base. Strengths: commute A+, health & safety A+, cost of living A; Watch: employment D+, crime F.
- Schenectady City School District (urban): math 38% / reading 34% proficiency, ranked #556 of 590 in NY (top 94%) — families likely to look elsewhere, expect single-tenant / working-renter base with shorter leases; 65% free/reduced lunch — lower-income household profile, screen leases tightly.
- Zoned schools: Schenectady High School (math 75% / reading 90%, grade A, #446 of 1,100 statewide, top 41%, 2,743 students, 71% FRL).
- Zoned-school proficiency averages 82% at this address vs 36% district-wide (+46 pts) — the actual schools serving this property are materially stronger than the Schenectady City School District average implies; a family-tenant draw the district grade alone would hide.
- Market conditions: 78 active listings in the ZIP; 8 comparable units currently listed for rent nearby; rentals lingering (median 44d on market — plan ~5-8 weeks vacancy on turnover, expect pricing pressure); 50% of comp listings sitting > 30 days — soft ceiling on asking rent; 154 units permitted in Schenectady County in 2024 (54 in 5+ unit buildings).
- At $2,879/mo this rent would consume 54% of the median local household income ($63k/yr) (locally 1016% of renters already pay >50% of income on rent) — very limited rent-growth headroom before tenants either downsize or default.
Forward outlook
- Local home prices are declining (-3.0%/yr); year-one equity from $2k of loan paydown is wiped out by about $8k of value loss. Plan a longer hold.
- Schenectady County population projected to shrink 4% by 2050 — rents likely to lag national; underwrite the cash flow, not the appreciation.
Negotiation context
- Only 7 days on market — expect competitive offers; lowballing is unlikely to land.
- 3 sale attempts since 24y ago with the ask held roughly flat each time — persistent listings suggest the price (not the market) is what's stuck; bring a comps-based counter.
- Current owner paid $70k; list at $260k implies a 269% gain — meaningful room to come down on a strong offer.
Risks & watch-outs
- Watch-outs: built in 1900 — expect roof / HVAC / electrical / plumbing capex.
Questions for the listing agent
- Can we see the unit-by-unit rent roll, current vacancy, and any below-market leases? What's the average tenancy length?
- What capital expenditures (roof, boiler, parking lot, exteriors) have been made in the last 5 years, and what's planned in the next 2?
- Built in 1900 — when were the roof, HVAC, electrical panel, plumbing, and water heater last replaced?
- Is there a deadline driving the sale (1031 exchange, divorce, estate, relocation)? That informs how much negotiation room exists.
- Crime grade is F in this area — have there been break-ins, vandalism, or insurance claims at this property in the last 3 years? What carrier currently insures it and at what premium?
- The area grade is low — what's the realistic commute time and amenity access for the typical tenant pool here? Any planned neighborhood developments (good or bad) we should know about?
- What's the average days-on-market for RENTAL listings here right now (not sales)? A rising rental-DOM trend means longer vacancies and softer asking-rent achievability than the comps imply.
- What's the recent tenant-quality profile in this submarket — average credit score on applications, eviction rate, late-payment / NSF rate, and stable-employment percentage? A property-management company in the area should have these aggregated.
- How much new apartment / multifamily construction is in the pipeline within 1–3 miles? Heavy new supply (>2% of stock underway) typically softens rents 12–24 months out; light construction supports rent growth.
Investment metrics
- 1% rule
- 1.11% ✓
- Cap rate
- 7.99%
- Cash-on-cash
- 6.07%
- DSCR
- 1.27
- GRM
- 7.5
CMA / ARV
- ARV (on-the-fly)
- $190,080
- Comps found
- 12
Show comp detail 12 sales within ~0.75 mi
| Address | Dist | Beds/Ba | Sqft | Sold | Price | $/sf | Match |
|---|---|---|---|---|---|---|---|
| 11 Mynderse St | 0.37mi | 4/2.0 | 1,686 (-4%) | 1mo | $140,000 | $83 | 75 |
| 37 Swan St | 0.57mi | 4/2.0 | 1,768 (+0%) | 6mo | $240,000 | $136 | 68 |
| 112 Porter St | 0.12mi | 4/2.0 | 1,556 (-12%) | 12mo | $255,000 | $164 | 65 |
| 1156-1158 Hilderbrandt Ave | 0.46mi | 4/2.0 | 1,768 (+0%) | 17mo | $20,000 | $11 | 64 |
| 1039 Wendell Ave | 0.29mi | 4/2.0 | 1,984 (+13%) | 4mo | $220,000 | $111 | 62 |
| 701 Windsor Ter | 0.11mi | 4/2.0 | 1,560 (-11%) | 22mo | $45,100 | $29 | 57 |
| 136 Elmer Ave | 0.46mi | 3/2.0 (-1) | 1,646 (-6%) | 11mo | $228,000 | $139 | 53 |
| 1524 Devine St | 0.61mi | 4/2.0 | 1,728 (-2%) | 22mo | $165,000 | $95 | 50 |
| 35 Swan St | 0.57mi | 4/2.0 | 1,548 (-12%) | 5mo | $2,570 | $2 | 49 |
| 212 Hulett St | 0.49mi | 4/2.0 | 1,892 (+8%) | 19mo | $90,000 | $48 | 49 |
| 34 Columbia St | 0.42mi | 5/3.0 (+1) | 1,600 (-9%) | 20mo | $250,000 | $156 | 40 |
| 11 John St | 0.75mi | 5/2.0 (+1) | 1,992 (+13%) | 20mo | $215,000 | $108 | 21 |
Match score weights: distance 35% · size 25% · config 20% · recency 20%. Top-matched comps best support the ARV.
Projected returns pro-forma
-3.0% appreciation · 3.0% rent growth · sell at horizon
- IRR
- -6.9%
- Equity multiple
- 0.75×
- Total profit
- $-18,550
- Equity at exit
- $38,767
- IRR
- 2.8%
- Equity multiple
- 1.20×
- Total profit
- $14,518
- Equity at exit
- $22,480
Cash invested: $72,800 (down + closing). Projections, not guarantees.
Landlord ↔ Tenant lean methodology
- Overall (STATE)
- 15 Strongly Tenant-Friendly
- State New York
- 15 Strongly Tenant-Friendly · D+10
- County
- — inherits STATE
- City
- — inherits STATE
ZIP-level market 12308
- Home prices YoY
- -14.6%
- Active inventory
- 78
- Price-to-rent
- 15.0×
Monthly cashflow live
- Estimated rent
- $2,879 high interval (Pro) →
- Mortgage (P&I)
- −$1,363
- Tax from tax record
- −$434 /mo · $5,209/yr
- Insurance
- −$108
- HOA
- −$0
- Vacancy / Maint / Mgmt
- −$605
- Net cashflow
- $369
Break-even live
2-unit breakdown (identical units grouped — click to expand)
| Units | Beds | Baths | Est. rent |
|---|---|---|---|
| 2× units | 2 | 1 | $2,880 |
| #1 | 2 | 1 | $1,440 |
| #2 | 2 | 1 | $1,440 |
| Total (2 units) | $2,879 | ||
UW: 25.0% down · 7.5% · 30yr · 1.5% tax · 5.0% vac · 8.0% maint · 8.0% mgmt
Financing live
Cash to close
- Down payment
- $65,000
- Closing costs
- $7,800
- Reserves months
- —
- Total cash needed
- —
Loan-product check · same deal, 3 products live
Conventional
25% down · 7.5% · 30yr
- Down + closing
- —
- Monthly P&I
- —
- Monthly cashflow
- —
- DSCR
- —
- Eligible?
- —
Personal DTI + credit; lowest rate.
DSCR
20% down · 8.5% · 30yr
- Down + closing
- —
- Monthly P&I
- —
- Monthly cashflow
- —
- DSCR
- —
- Eligible?
- —
No personal income docs; deal must DSCR.
Hard money
10% down · 12.0% · 12mo
- Down + closing
- —
- Monthly P&I
- —
- Monthly cashflow
- —
- DSCR
- —
- Eligible?
- —
Short-term bridge; refi at stabilization.
Rent comps 8 comps
| Address | Beds | Baths | Sqft | Rent | $/sqft | DOM | Units | Dist |
|---|---|---|---|---|---|---|---|---|
| 509 Nott St Unit 507 Schenectady, NY | 4.0 | 1.0 | 1400 | $1,695 | $1.21 | 43d | 1 | 0.54mi |
| 901 Nott St Unit 1R Schenectady, NY | 3.0 | 1.0 | 1500 | $1,250 | $0.83 | 23d | 1 | 0.61mi |
| 1347 Union St Schenectady, NY | 4.0 | 1.5 | 2188 | $3,750 | $1.71 | 43d | 1 | 0.71mi |
| 1673 Van Vranken Ave Schenectady, NY | 3.0 | 1.0 | 1335 | $1,750 | $1.31 | 43d | 1 | 0.78mi |
| 1687 Avenue A Schenectady, NY | 4.0 | 1.0 | 1672 | $2,300 | $1.38 | 43d | 1 | 0.81mi |
| 117 Washington Ave Schenectady, NY | 2.0–4.0 | 1.0–2.0 | 1033 | $2,163 | $2.09 | 14d | 9 | 0.96mi |
| 1747 Oneida St Schenectady, NY | 4.0 | 2.0 | 1620 | $2,700 | $1.67 | 14d | 1 | 1.03mi |
| 100 Reserve Ct Schenectady, NY | 1.0–3.0 | 1.0–2.0 | 1106 | $2,445 | $2.21 | 14d | 1 | 1.48mi |
Listing history 7 events
-
2026-06-18days on market $260,000 Active 7 DOM
-
2026-06-17days on market $260,000 Active 6 DOM
-
2026-06-16days on market $260,000 Active 5 DOM
-
2026-06-15days on market $260,000 Active 4 DOM
-
2026-06-14days on market $260,000 Active 2 DOM
-
2026-06-13remarks 472-char remark
-
2026-06-13$260,000 Active 1 DOM
ⓘ Source: listings_history table (triggers on properties + properties_extension) + one-shot
backfill from property_details.listing_events for pre-trigger history.
Tax reassessment forecast NY · Partial reset (capped growth)
- Current annual tax
- $5,209 · $434/mo
- Projected year-2 tax
- $5,209 · $434/mo
- Expected delta
- $0/yr ($0/mo · 0.0%)
ⓘ Screening estimate from a state-policy table — verify with the county assessor before closing.
Climate risk First Street
- Flood 1/10 Low FEMA zone X (unshaded) · 0% chance over 30 yrs
- Wildfire 1/10 Low
- Heat 3/10 Moderate 7 d/yr ≥95°F today · 16 d/yr by 30 yrs out
- Wind 2/10 Low 4% chance of damaging wind over 30 yrs
- Air quality 1/10 Low 0 unhealthy d/yr today · 0 by 30 yrs out
Nearby sold comps map
Loading sold comps map…
Walkable amenities ~0.75 mi
Loading nearby amenities…
Taxation est. · year 1
- Rental income
- $34,548
- − Mortgage interest
- −$14,564
- − Property taxes
- −$5,209
- − Insurance
- −$1,300
- − Repairs & maintenance
- −$2,764
- − Management
- −$2,764
- − Depreciation
- −$7,564
- Taxable income
- $383
- Est. tax owed @ 24.0%
- −$92
- After-tax cash flow
- $4,330/yr
For passive investors: Depreciation is non-cash, so a rental often shows a tax loss while cash-flowing — sheltering income. Rental losses are passive: they offset passive income freely, and up to $25,000/yr can offset ordinary (W-2) income if you actively participate and your MAGI is under $100k (phasing out to $0 by $150k); unused losses carry forward. On sale, claimed depreciation is recaptured at up to 25%, and gains may owe capital-gains tax (a 1031 exchange can defer both). Figures are a year-1 estimate at your 24.0% rate — not tax advice; consult a CPA.
Schools (NCES district)
- District
- Schenectady City School District
- NCES district ID
- 3626010
- Math proficiency
- 38% ▲ 12.00%
- Reading proficiency
- 34% ▲ 2.00%
- Median HH income
- $39,453
- Composite
- 30.2/100
- National rank
- #6309
- State rank
- #556 of 590 in NY
Livability — Schenectady
- Score
- 78/100
- State rank
- #167
- US rank
- #2597
Category grades
Schools grade is shown separately in the Schools card above.
Census & demographics
- Census place
- Schenectady, NY
- County
- Schenectady County · 141,369 people
- City population
- 141,369
- Metro
- Albany-Schenectady-Troy, NY
- Population (ZIP)
- 15,511
- Household income
- $63,434
- Rent vs Own
- Severe rent burden
- 1016.0
Population outlook (Schenectady County) Hauer SSP2
- Today (2025)
- 155,046 people
- By 2030
- 154,322 · -0.5%
- By 2040
- 151,796 · -2.1%
- By 2050
- 148,621 · -4.1%
- By 2075
- 141,229 · -8.9%
- By 2100
- 126,014 · -18.7%
Race, ethnicity, and origin ACS 2023
- Neighborhood character
- Diverse neighborhood (Simpson 0.63)
- Race & ethnicity
- White 57% Black 17% Hispanic / Latino 13% Two or more races 7% Asian 3%
- Hispanic origin (detail)
- Mexican 2% Puerto Rican 8%
- Common ancestry
- Lithuanian 4% Romanian 4% Slovak 3%
- Foreign-born
- 10% · Canada
- Languages at home
- 89% English-only · Spanish 5% Other Indo-European 2% Arabic 1%
Political lean MEDSL · Schenectady
- 2024 margin
- D (+10.8) · D 55.4% · R 44.6%
- 2008→2024 swing
- -1.8pp toward R · 2008: 12.7pp · 2024: 10.8pp
- All cycles
- 2024: D+10.8 2020: D+15.7 2016: D+5.8 2012: D+15.4 2008: D+12.7
Not yet ingested
- Civics
- —
Market trends
- HPI YoY
- ▼ -59.17%
- Current HPI
- 344.8675
- Rent YoY
- —
- Metro
- Albany-Schenectady-Troy, NY
- State GDP YoY
- ▲ 2.60%
- F500 in state
- 92
Industry mix (Fortune 500 HQ in NY)
| Industry | F500 HQs | Revenue |
|---|---|---|
| Financial Services | 10 | $950B |
|
||
| Consumer Goods | 9 | $162B |
|
||
| Insurance | 4 | $225B |
|
||
| Telecommunications | 2 | $144B |
|
||
| Pharmaceuticals | 2 | $112B |
|
||
| Media / Entertainment | 2 | $69B |
|
||
Price history
+334.1% since first listed9 events — show timeline
- 2026-06-11 Listed $260,000 Global MLS
- 2003-06-20 Sold (MLS) $70,500 Global MLS
- 2003-06-16 Sold (Public Records) $70,500 Public Records
- 2003-03-27 Listing Removed — Global MLS
- 2003-03-17 Listed $70,000 Global MLS
- 2002-12-18 Sold (Public Records) $52,500 Public Records
- 2002-12-17 Sold (MLS) $52,500 Global MLS
- 2002-12-16 Listing Removed — Global MLS
- 2002-07-24 Listed $59,900 Global MLS
Property tax history
+0.7%/yrLatest (2025): $5,209 · +3.8% YoY. Source: county tax records.
Cash-flow waterfall
monthlySold comps — $/sqft
last 12 mo · ≤1 miLoading sold comps…