2131 E Union Hills Dr Unit M6 · Phoenix, AZ
Flood risk 1/10 · Minimal
- FEMA flood zone
- X (shaded)
- Chance of flooding over 30 yrs
- 0.0%
- Est. flood insurance / yr
- $507 – $1,088
Fire risk 4/10 · Minor
- Est. fire insurance / yr
- $610 – $1,132
Heat risk 8/10 · Major
- Hot days now (above 110°F)
- 7 days/yr
- Hot days in 30 yrs
- 18 days/yr
Wind risk 1/10 · Minimal
- Chance of severe wind over 30 yrs
- —
Air-quality risk 3/10 · Minor
- Unhealthy air days now
- 3 days/yr
- Unhealthy air days in 30 yrs
- 5 days/yr
Risk factors via First Street. Map © Google.
Why this score? — see what drove the B- grade
The composite is a weighted blend of 9 inputs, each scored 0–100. Each bar is that input's sub-score; the figure is the points it added to the 100-point composite (weight × sub-score).
- Cash flow +28.7/30.0
- DSCR +10.0/10.0
- 1% rule +8.0/10.0
- ARV discount +7.5/15.0
- Schools +3.8/10.0
- Livability +3.8/5.0
- Condition / age +3.8/5.0
- Rent growth +2.9/5.0
- Appreciation +0.0/10.0
$119,000
🖨 Deal sheet 📄 Offer letter ✓ Due diligence
Listing remarks
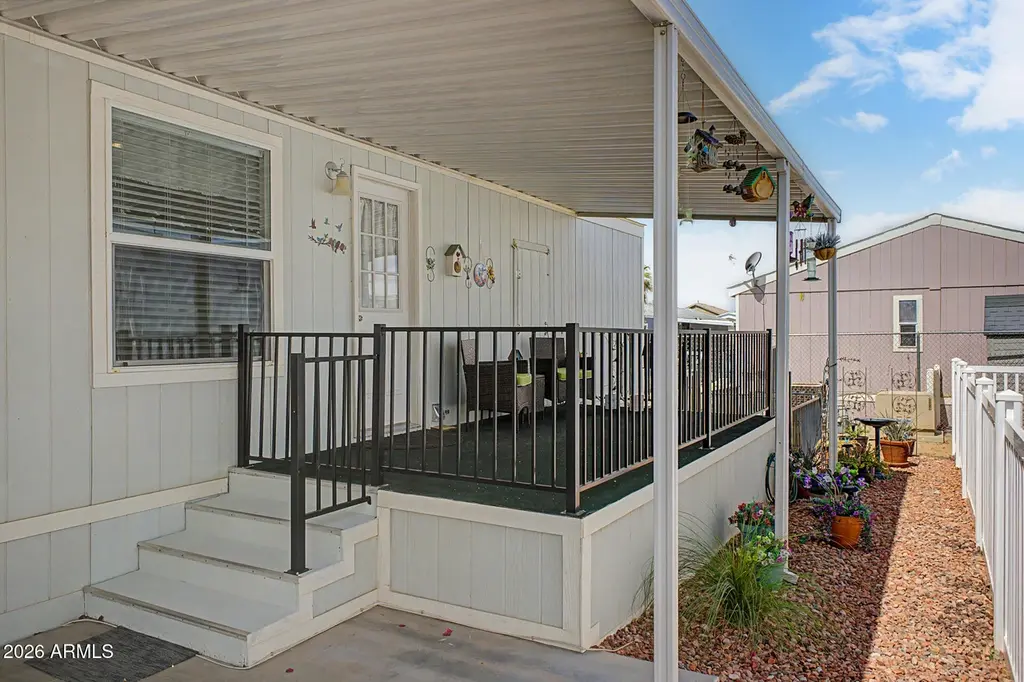
Seize the chance to own this charming 2-bedroom mobile home in Buffalo Ridge-Melody Ridge MH Park! You're greeted by an inviting front porch perfect for enjoying morning coffee. Inside, the appealing open layout features vaulted ceilings, a soothing palette, blinds, and wood-look flooring. The kitchen opens to great room area and includes an eat in kitchen, recessed lighting, built-in appliances, and a peninsula with a breakfast bar. Large bedrooms. Meticulously maintained. Turn key! . The Community offers a refreshing pool, playground, dog park, basketball court and well-maintained common areas. Don't miss out on this fantastic opportunity!
Key facts
- Built-in appliances
- Front porch
- Eat in kitchen
Tags
Property features AI
Finance
- Other: Lot approximately 4,356 sqft
- HOA & community: Land lease community; Land lease fee $790 monthly; No additional association fees
Exterior
- Parking: 2 covered parking spaces; 2 carport spaces
- Utilities: City water; Public sewer
- Home design: Manufactured / mobile home; Leasehold ownership
- Construction: Vertical siding; Wood frame construction; Painted exterior; Composition roof
- Exterior features: Gravel/stone front; Mountain views; Private maintained road; Community pool; Playground; Biking/walking path
Interior
- Kitchen: Built-in microwave; Dishwasher; Garbage disposal; Laminate counters
- Bedrooms: 2 possible bedrooms
- Flooring: Carpet; Tile
- Bathrooms: 2 full bathrooms
- Heating & cooling: Has heating; Ceiling fan(s); Has cooling
- Interior features: High-speed internet; Master bedroom on main level; Eat-in kitchen; Breakfast bar; No interior steps (single-level entry); Vaulted ceilings; 3/4 bath in master bedroom; Laminate countertops; Lever door handles; Bath lever faucets
- Laundry & utility: Indoor laundry; Washer/dryer hookup only
Neighborhood map
What this means for you Summary
Snapshot
- This is a 2-bed/2.0-bath manufactured listed at $119k. Condition is rated good.
Deal economics
- At list price, monthly cash flow is $397 ($5k/yr) — positive.
- The deal already cash-flows at list — no discount required.
- Meets the 1% rule at list price ($2k rent vs $119k).
- Recommended offer: $117k (1.5% below list) — sets the bar for market timing.
- Cap rate 10.3% vs local median 3.3% in Phoenix — top-decile yield for the area; either an underpriced asset or a hidden risk that comps aren't pricing in. Stress-test before assuming the spread holds.
Location & tenants
- Location reads 75/100 on livability (#16 in AZ, #3,924 nationally) — a middle-class / working-renter tenant base. Strengths: amenities A+, commute A+, housing A+; Watch: health & safety C-, crime F.
- Paradise Valley Unified District (4241) (urban): math 39% / reading 46% proficiency, ranked #56 of 249 in AZ (top 22%) — families likely to look elsewhere, expect single-tenant / working-renter base with shorter leases.
- Zoned schools: Echo Mountain Primary School (math 22% / reading 22%, grade F, #687 of 1,109 statewide, top 65%, 530 students, 74% FRL); Vista Verde Middle School (math 13% / reading 26%, grade F, #134 of 218 statewide, top 63%, 544 students, 71% FRL); North Canyon High School (math 13% / reading 23%, grade F, #242 of 381 statewide, top 64%, 1,842 students, 55% FRL) — zoned schools average 66% FRL vs 29% district-wide (37 pts higher); higher-poverty schools than district average — tighter screening recommended.
- Zoned-school proficiency averages 20% at this address vs 42% district-wide (-23 pts) — the specific schools serving this property underperform the Paradise Valley Unified District (4241) average; the district grade overstates school quality for this exact location.
- Market conditions: Rents rising (+1.4%/yr); 201 active listings in the ZIP; 33 comparable units currently listed for rent nearby; rentals at typical pace (median 17d on market — plan ~3-4 weeks tenant-placement turnaround); solid renter incomes; 36,011 units permitted in Maricopa County in 2024 (12,801 in 5+ unit buildings).
- This rent is only 17% of the median local income ($107k/yr) — well below the 30% rent-burden line; pricing power to push rent on renewal without tenant pushback.
Forward outlook
- Local home prices are declining (-3.0%/yr); year-one equity from $823 of loan paydown is wiped out by about $4k of value loss. Plan a longer hold.
- Maricopa County population projected at +38% by 2050 — long-run rental-demand tailwind backs the buy-and-hold thesis.
- At projected returns (-3.0% appreciation + 1.4% rent growth), your $33k cash investment doubles in ~10 years — after that, you're playing with house money.
Negotiation context
- It's been on market 30 days — a 2% lower offer ($117k) is reasonable based on typical stale-listing flexibility.
Risks & watch-outs
- Climate carrying-cost: extreme-heat days projected 7→18/yr by 2055 (HVAC capex compounding) — expect insurance premiums to compound above CPI over the hold.
Questions for the listing agent
- Is there a deadline driving the sale (1031 exchange, divorce, estate, relocation)? That informs how much negotiation room exists.
- Crime grade is F in this area — have there been break-ins, vandalism, or insurance claims at this property in the last 3 years? What carrier currently insures it and at what premium?
- What's the average days-on-market for RENTAL listings here right now (not sales)? A rising rental-DOM trend means longer vacancies and softer asking-rent achievability than the comps imply.
- What's the recent tenant-quality profile in this submarket — average credit score on applications, eviction rate, late-payment / NSF rate, and stable-employment percentage? A property-management company in the area should have these aggregated.
- How much new for-sale + rental construction is in the pipeline within 1–3 miles? Heavy new supply typically softens prices + rents 12–24 months out; constrained supply supports both.
Investment metrics
- 1% rule
- 1.30% ✓
- Cap rate
- 10.30%
- Cash-on-cash
- 14.30%
- DSCR
- 1.64
- GRM
- 6.4
CMA / ARV
- ARV (on-the-fly)
- $50,490
- Comps found
- 12
Show comp detail 12 sales within ~0.75 mi
| Address | Dist | Beds/Ba | Sqft | Sold | Price | $/sf | Match |
|---|---|---|---|---|---|---|---|
| 2140 E Michigan Ave #35 | 0.21mi | 3/2.0 (+1) | 990 (0%) | 1mo | $98,000 | $99 | 84 |
| 18026 N Cave Creek Rd #125 | 0.31mi | 2/1.0 | 960 (-3%) | 1mo | $35,000 | $36 | 76 |
| 18026 N Cave Creek Rd #16 | 0.32mi | 2/1.0 | 952 (-4%) | 3mo | $49,000 | $51 | 72 |
| 2233 E Behrend Dr #152 | 0.68mi | 2/2.0 | 980 (-1%) | 3mo | $42,500 | $43 | 64 |
| 1939 E Libby St | 0.53mi | 2/2.0 | 980 (-1%) | 13mo | $175,000 | $179 | 63 |
| 2233 E Behrend Dr #81 | 0.68mi | 2/2.0 | 1,040 (+5%) | 2mo | $52,000 | $50 | 58 |
| 2701 E Utopia Rd #66 | 0.60mi | 2/2.0 | 1,024 (+3%) | 10mo | $50,000 | $49 | 58 |
| 2701 E Utopia Rd #8 | 0.60mi | 3/2.0 (+1) | 984 (-1%) | 14mo | $72,000 | $73 | 54 |
| 1926 E Grovers Ave | 0.57mi | 2/2.0 | 924 (-7%) | 11mo | $260,000 | $281 | 53 |
| 2233 E Behrend Dr #92 | 0.68mi | 2/2.0 | 1,056 (+7%) | 5mo | $20,000 | $19 | 53 |
| 2233 E Behrend Dr #93 | 0.69mi | 2/2.0 | 1,056 (+7%) | 6mo | $47,000 | $45 | 52 |
| 17827 N 19th St | 0.54mi | 3/2.0 (+1) | 1,096 (+11%) | 12mo | $130,000 | $119 | 42 |
Match score weights: distance 35% · size 25% · config 20% · recency 20%. Top-matched comps best support the ARV.
Projected returns pro-forma
-3.0% appreciation · 1.44% rent growth · sell at horizon
- IRR
- 2.9%
- Equity multiple
- 1.11×
- Total profit
- $3,646
- Equity at exit
- $17,743
- IRR
- 10.9%
- Equity multiple
- 1.79×
- Total profit
- $26,348
- Equity at exit
- $10,289
Cash invested: $33,320 (down + closing). Projections, not guarantees.
Landlord ↔ Tenant lean methodology
- Overall (STATE)
- 87 Strongly Landlord-Friendly
- State Arizona
- 87 Strongly Landlord-Friendly · R+3
- County
- — inherits STATE
- City
- — inherits STATE
ZIP-level market 85024
- Home prices YoY
- -21.0%
- Rents YoY
- 1.4%
- Active inventory
- 201
- Price-to-rent
- 6.4×
Monthly cashflow live
- Estimated rent
- $1,544 high interval (Pro) →
- Mortgage (P&I)
- −$624
- Tax est. 1.5%
- −$149 /mo · $1,785/yr
- Insurance
- −$50
- HOA
- −$0
- Vacancy / Maint / Mgmt
- −$324
- Net cashflow
- $397
Break-even live
UW: 25.0% down · 7.5% · 30yr · 1.5% tax · 5.0% vac · 8.0% maint · 8.0% mgmt
Financing live
Cash to close
- Down payment
- $29,750
- Closing costs
- $3,570
- Reserves months
- —
- Total cash needed
- —
Loan-product check · same deal, 3 products live
Conventional
25% down · 7.5% · 30yr
- Down + closing
- —
- Monthly P&I
- —
- Monthly cashflow
- —
- DSCR
- —
- Eligible?
- —
Personal DTI + credit; lowest rate.
DSCR
20% down · 8.5% · 30yr
- Down + closing
- —
- Monthly P&I
- —
- Monthly cashflow
- —
- DSCR
- —
- Eligible?
- —
No personal income docs; deal must DSCR.
Hard money
10% down · 12.0% · 12mo
- Down + closing
- —
- Monthly P&I
- —
- Monthly cashflow
- —
- DSCR
- —
- Eligible?
- —
Short-term bridge; refi at stabilization.
Rent comps 33 comps
| Address | Beds | Baths | Sqft | Rent | $/sqft | DOM | Units | Dist |
|---|---|---|---|---|---|---|---|---|
| 18416 N Cave Creek Rd Unit 6 Phoenix, AZ | 1.0 | 1.0 | 748 | $1,250 | $1.67 | 7d | 1 | 0.16mi |
| 18660 N Cave Creek Rd Phoenix, AZ | 1.0–3.0 | 1.0–2.0 | 961 | $1,622 | $1.69 | 2d | 11 | 0.20mi |
| 18416 N Cave Creek Rd Phoenix, AZ | 2.0 | 1.0–2.0 | 786 | $3,000 | $3.81 | 4d | 9 | 0.23mi |
| 18202 N Cave Creek Rd Phoenix, AZ | 1.0–3.0 | 1.0–2.0 | 722 | $1,148 | $1.59 | 4d | 7 | 0.31mi |
| 2077 E Charleston Ave Phoenix, AZ | 2.0 | 1.0 | 720 | $1,295 | $1.80 | 24d | 1 | 0.42mi |
| 2067 E Charleston Ave Phoenix, AZ | 2.0 | 2.0 | 840 | $1,395 | $1.66 | 24d | 1 | 0.42mi |
| 2554 E Villa Rita Dr Phoenix, AZ | 2.0 | 1.0 | 1118 | $2,750 | $2.46 | 24d | 1 | 0.59mi |
| 17602 N Cave Creek Rd Phoenix, AZ | 2.0 | 1.0–2.0 | 650 | $1,625 | $2.50 | 2d | 13 | 0.61mi |
| 19635 N Cave Creek Rd Phoenix, AZ | 3.0 | 1.0–2.0 | 999 | $1,643 | $1.64 | 1d | 22 | 0.83mi |
| 1814 E Bell Rd Phoenix, AZ | 1.0–2.0 | 1.0–2.0 | 1003 | $1,637 | $1.63 | 1d | 12 | 0.91mi |
| 20050 N Cave Creek Rd Phoenix, AZ | 1.0–2.0 | 1.0–2.0 | 909 | $1,770 | $1.95 | 1d | 10 | 0.92mi |
| 2500 E Marco Polo Rd Phoenix, AZ | 2.0 | 1.0–2.0 | 918 | $2,390 | $2.60 | 2d | 16 | 0.94mi |
| 2220 E Beardsley Rd Phoenix, AZ | 4.0 | 1.0–2.0 | 855 | $1,694 | $1.98 | 2d | 62 | 1.06mi |
| 1750 E Bell Rd Phoenix, AZ | 1.0–2.0 | 1.0 | 700 | $1,349 | $1.93 | 24d | 1 | 1.08mi |
| 16801 N 26th St Apt 17 Phoenix, AZ | 2.0 | 1.0 | 800 | $1,195 | $1.49 | 24d | 1 | 1.23mi |
| 16627 N 25th St Unit 23 Phoenix, AZ | 2.0 | 1.0 | 765 | $1,145 | $1.50 | 24d | 1 | 1.24mi |
| 1450 E Bell Rd Phoenix, AZ | 1.0–3.0 | 1.0–2.0 | 957 | $1,555 | $1.62 | 2d | 93 | 1.25mi |
| 16621 N 25th St Phoenix, AZ | 1.0 | 1.0 | 570 | $899 | $1.58 | 7d | 1 | 1.27mi |
| 3301 E Wescott Dr Phoenix, AZ | 3.0 | 2.0 | 1101 | $1,995 | $1.81 | 24d | 1 | 1.37mi |
| 2424 E Grandview Rd Phoenix, AZ | 2.0 | 1.0 | 700 | $1,159 | $1.66 | 24d | 1 | 1.37mi |
| 2424 E Grandview Rd Phoenix, AZ | 2.0 | 1.0 | 700 | $942 | $1.35 | 21d | 1 | 1.37mi |
| 2424 E Grandview Rd Phoenix, AZ | 2.0 | 1.0 | 575 | $942 | $1.64 | 4d | 6 | 1.37mi |
| 2424 E Grandview Rd Apt 310 Phoenix, AZ | 2.0 | 1.0 | 700 | $942 | $1.35 | 24d | 1 | 1.37mi |
| 2424 E Grandview Rd Unit 112 Phoenix, AZ | 1.0 | 1.0 | 550 | $856 | $1.56 | 24d | 1 | 1.37mi |
| 2424 E Grandview Rd Unit 107 Phoenix, AZ | 2.0 | 1.0 | 700 | $829 | $1.18 | 24d | 1 | 1.37mi |
| 2424 E Grandview Rd Unit 312 Phoenix, AZ | 1.0 | 1.0 | 550 | $856 | $1.56 | 21d | 1 | 1.37mi |
| 16816 N 29th St Apt 202 Phoenix, AZ | 2.0 | 2.0 | 800 | $1,100 | $1.38 | 7d | 1 | 1.37mi |
| 1130 E Grovers Ave Phoenix, AZ | 2.0 | 2.0 | 934 | $1,336 | $1.43 | 2d | 12 | 1.38mi |
| 1032 E Villa Maria Dr Phoenix, AZ | 2.0 | 2.0 | 1097 | $1,850 | $1.69 | 20d | 1 | 1.38mi |
| 1032 E Villa Maria Dr Phoenix, AZ | 2.0 | 2.0 | 1097 | $1,850 | $1.69 | 7d | 1 | 1.38mi |
| 16815 N 29th St Apt 146 Phoenix, AZ | 2.0 | 1.0 | 850 | $999 | $1.18 | 24d | 1 | 1.40mi |
| 16815 N 29th St Phoenix, AZ | 2.0 | 1.0 | 850 | $1,199 | $1.41 | 24d | 1 | 1.43mi |
| 16815 N 29th St Phoenix, AZ | 2.0 | 1.0 | 850 | $1,050 | $1.23 | 16d | 3 | 1.43mi |
Listing history 15 events
-
2026-06-18days on market $119,000 Active 30 DOM
-
2026-06-17days on market $119,000 Active 29 DOM
-
2026-06-16days on market $119,000 Active 28 DOM
-
2026-06-15days on market $119,000 Active 27 DOM
-
2026-06-13days on market $119,000 Active 25 DOM
-
2026-06-13days on market $119,000 Active 24 DOM
-
2026-06-09days on market $119,000 Active 21 DOM
-
2026-06-08days on market $119,000 Active 20 DOM
-
2026-06-07days on market $119,000 Active 19 DOM
-
2026-06-04days on market $119,000 Active 16 DOM
-
2026-06-03days on market $119,000 Active 15 DOM
-
2026-06-02days on market $119,000 Active 14 DOM
-
2026-06-01days on market $119,000 Active 13 DOM
-
2026-05-31days on market $119,000 Active 12 DOM
-
2026-05-19$119,000 Active
ⓘ Source: listings_history table (triggers on properties + properties_extension) + one-shot
backfill from property_details.listing_events for pre-trigger history.
Climate risk First Street
- Flood 1/10 Low FEMA zone X (shaded) · 0% chance over 30 yrs
- Wildfire 4/10 Moderate
- Heat 8/10 Severe 7 d/yr ≥110°F today · 18 d/yr by 30 yrs out
- Wind 1/10 Low
- Air quality 3/10 Moderate 3 unhealthy d/yr today · 5 by 30 yrs out
Nearby sold comps map
Loading sold comps map…
Walkable amenities ~0.75 mi
Loading nearby amenities…
Taxation est. · year 1
- Rental income
- $18,524
- − Mortgage interest
- −$6,666
- − Property taxes
- −$1,785
- − Insurance
- −$595
- − Repairs & maintenance
- −$1,482
- − Management
- −$1,482
- − Depreciation
- −$3,462
- Taxable income
- $3,052
- Est. tax owed @ 24.0%
- −$733
- After-tax cash flow
- $4,033/yr
For passive investors: Depreciation is non-cash, so a rental often shows a tax loss while cash-flowing — sheltering income. Rental losses are passive: they offset passive income freely, and up to $25,000/yr can offset ordinary (W-2) income if you actively participate and your MAGI is under $100k (phasing out to $0 by $150k); unused losses carry forward. On sale, claimed depreciation is recaptured at up to 25%, and gains may owe capital-gains tax (a 1031 exchange can defer both). Figures are a year-1 estimate at your 24.0% rate — not tax advice; consult a CPA.
Condition & rehab AI · 21 photos
This charming 2-bedroom mobile home in Buffalo Ridge-Melody Ridge MH Park is in good condition with a good condition score of 75. It features an open layout, wood-look flooring, and a community pool. The home is move-in ready and has a good ROI potential.
Value-add opportunities
- Both Paint exterior — Enhances curb appeal and value
- Both Replace blinds — Improves natural light and aesthetics
- Both Upgrade flooring — Enhances overall look and value
- Both Upgrade appliances — Improves functionality and value
Renovation cost estimate screening
Value-add ROI direction
- Both Paint exterior — Enhances curb appeal and value ↑
- Both Replace blinds — Improves natural light and aesthetics ↑
- Both Upgrade flooring — Enhances overall look and value ↑
- Both Upgrade appliances — Improves functionality and value ↑
ⓘ Cost ranges are severity-bucket heuristics (US national rule-of-thumb). Get contractor quotes + a written scope before underwriting a rehab budget.
Schools (NCES district)
- District
- Paradise Valley Unified District (4241)
- NCES district ID
- 0405930
- Math proficiency
- 39% ▼ -11.00%
- Reading proficiency
- 46% ▼ -7.00%
- Median HH income
- $64,106
- Composite
- 37.89/100
- National rank
- #4316
- State rank
- #56 of 249 in AZ
Livability — Phoenix
- Score
- 75/100
- State rank
- #16
- US rank
- #3924
Category grades
Schools grade is shown separately in the Schools card above.
Census & demographics
- Census place
- Phoenix, AZ
- County
- Maricopa County · 4,537,380 people
- City population
- 1,500,198
- Metro
- Phoenix-Mesa-Chandler, AZ
- Population (ZIP)
- 26,199
- Household income
- $106,724
- Rent vs Own
- Severe rent burden
- 547.0
Population outlook (Maricopa County) Hauer SSP2
- Today (2025)
- 4,979,203 people
- By 2030
- 5,378,229 · +8.0%
- By 2040
- 6,156,598 · +23.6%
- By 2050
- 6,872,376 · +38.0%
- By 2075
- 8,401,270 · +68.7%
- By 2100
- 9,247,439 · +85.7%
Race, ethnicity, and origin ACS 2023
- Neighborhood character
- Predominantly White (71%)
- Race & ethnicity
- White 71% Hispanic / Latino 16% Two or more races 12% Asian 6% Black 2%
- Hispanic origin (detail)
- Mexican 13% Puerto Rican 1%
- Common ancestry
- Romanian 3% Italian 3% Portuguese 3%
- Foreign-born
- 12% · Canada, China, South Korea
- Languages at home
- 78% English-only · Spanish 10% Other Indo-European 4% Russian/Polish/Slavic 1%
Political lean MEDSL · Maricopa
- 2024 margin
- Toss-up / Even · D 47.7% · R 51.2% · Other 1.1%
- 2008→2024 swing
- +7.1pp toward D · 2008: -10.6pp · 2024: -3.5pp
- All cycles
- 2024: R+3.5 2020: D+2.2 2016: R+3.5 2012: R+12.0 2008: R+10.6
Not yet ingested
- Civics
- —
Market trends
- HPI YoY
- ▼ -82.95%
- Current HPI
- 312.7238
- Rent YoY
- ▲ 1.44%
- Metro
- Phoenix-Mesa-Chandler, AZ
- State GDP YoY
- ▲ 4.54%
- F500 in state
- 20
Industry mix (Fortune 500 HQ in AZ)
| Industry | F500 HQs | Revenue |
|---|---|---|
| Technology | 2 | $13B |
|
||
| Mining / Metals | 1 | $23B |
|
||
| Environmental Services | 1 | $16B |
|
||
| Metals / Steel | 1 | $14B |
|
||
| Technology Distribution | 1 | $9B |
|
||
| Homebuilding | 1 | $8B |
|
||
Price history
1 event — show timeline
- 2026-05-19 Listed $119,000 ARMLS
Cash-flow waterfall
monthlySold comps — $/sqft
last 12 mo · ≤1 miLoading sold comps…