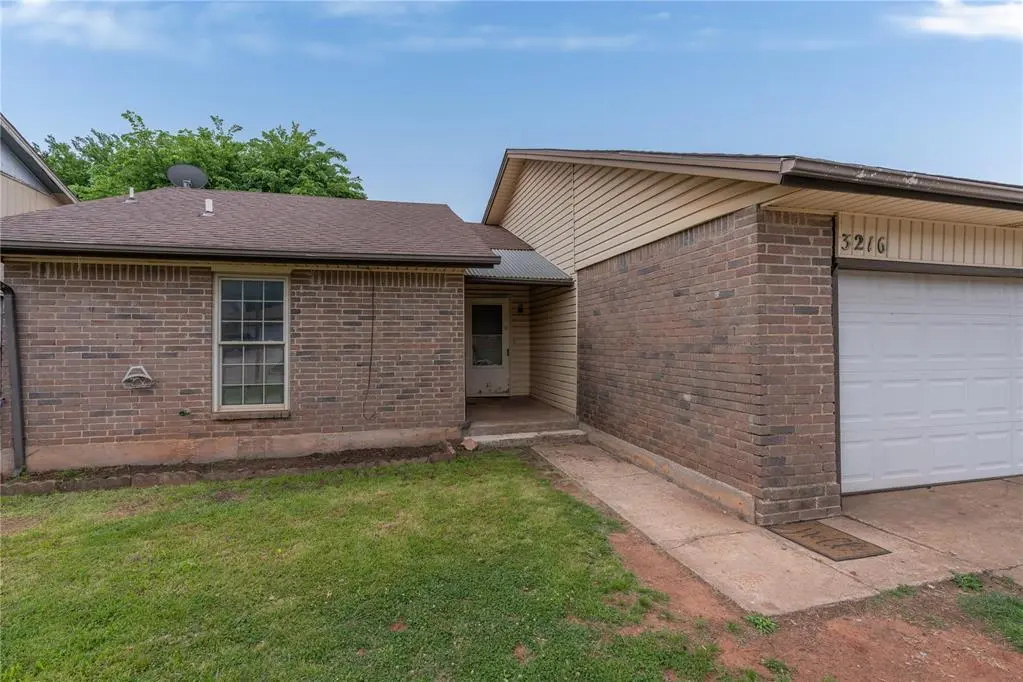
3216 SE 57th St · Oklahoma City, OK
Flood risk 1/10 · Minimal
- FEMA flood zone
- X (unshaded)
- Chance of flooding over 30 yrs
- 0.0%
- Est. flood insurance / yr
- $507 – $1,088
Fire risk 1/10 · Minimal
- Est. fire insurance / yr
- $2,463 – $4,575
Heat risk 6/10 · Moderate
- Hot days now (above 107°F)
- 7 days/yr
- Hot days in 30 yrs
- 20 days/yr
Wind risk 2/10 · Minimal
- Chance of severe wind over 30 yrs
- 4.0%
Air-quality risk 1/10 · Minimal
- Unhealthy air days now
- 0 days/yr
- Unhealthy air days in 30 yrs
- 0 days/yr
Risk factors via First Street. Map © Google.
Why this score? — see what drove the B+ grade
The composite is a weighted blend of 9 inputs, each scored 0–100. Each bar is that input's sub-score; the figure is the points it added to the 100-point composite (weight × sub-score).
- Cash flow +30.0/30.0
- ARV discount +15.0/15.0
- DSCR +10.0/10.0
- 1% rule +9.2/10.0
- Livability +4.0/5.0
- Rent growth +3.7/5.0
- Condition / age +2.5/5.0
- Schools +0.7/10.0
- Appreciation +0.0/10.0
$100,000
🖨 Deal sheet 📄 Offer letter ✓ Due diligence
Listing remarks
This 3-bedroom, 2-bathroom home is perfectly positioned in an established Southeast Oklahoma City community, offering unbeatable proximity to I-240 and I-35 for a fast commute to Tinker Air Force Base or Downtown OKC. Located near the Sunnylane shopping corridor and the recreational trails of Lake Stanley Draper, this property features a functional floor plan and an attached 2-car garage. The home has been well-maintained and serves as a fantastic blank canvas for someone looking to bring their own creative vision; it is a wonderful opportunity to add personal cosmetic touches and build immediate equity in a high-demand area.
Key facts
- 6,656 sq ft lot
- 2 garage spots
- Built 1978
Property features AI
Finance
- Other: Located in Oakcliff Sec 14; No storm shelter; Interior lot size approximately 0.1528 acres; Directions: Se 59th and Bryant, head north to SE 5th, turn east to property; Unoccupied and active listing
- Financial info: Assumable loan available; Qualifies for financing; Property listed at $100,000
- HOA & community: No mandatory association dues
Exterior
- Parking: 2-car garage
- Utilities: Homestead exemption applied
- Home design: Single family residence; Residential property; Entry level: One
- Construction: Brick and frame construction; Composition roof; Slab foundation; Existing property
- Exterior features: Interior lot
Interior
- Bedrooms: 3 bedrooms
- Bathrooms: 1 full bathroom; 1 half bathroom
- Interior features: One-level home; Living area present; Dining area present; No fireplace
Neighborhood map
What this means for you Summary
Snapshot
- This is a 3-bed/2.0-bath single-family listed at $100k.
Deal economics
- At list price, monthly cash flow is $432 ($5k/yr) — positive.
- The deal already cash-flows at list — no discount required.
- Meets the 1% rule at list price ($1k rent vs $100k).
- Cap rate 11.5% vs local median 3.7% in Oklahoma City — top-decile yield for the area; either an underpriced asset or a hidden risk that comps aren't pricing in. Stress-test before assuming the spread holds.
Location & tenants
- Location reads 80/100 on livability (#3 in OK, #1,635 nationally) — a professional / high-income tenant draw. Strengths: amenities A+, commute A+, cost of living A+; Watch: crime F.
- Oklahoma City (urban): math 7% / reading 10% proficiency, ranked #254 of 270 in OK (top 94%) — low school quality limits family demand, transient renter base, plan for 1-2y turnover; 82% free/reduced lunch — lower-income household profile, screen leases tightly.
- Zoned schools: Bodine Es (math 2% / reading 2%, grade F, #802 of 845 statewide, top 100%, 638 students, 0% FRL); Capitol Hill Hs (math 2% / reading 4%, grade F, #444 of 447 statewide, top 99%, 1,455 students, 0% FRL) — zoned schools average 0% FRL vs 82% district-wide (82 pts lower); this property's tenant base skews higher-income than the district average.
- Market conditions: Rents rising fast (+4.8%/yr); 89 active listings in the ZIP; 30 comparable units currently listed for rent nearby; rentals leasing fast (median 5d on market — plan ~1-2 weeks tenant-placement turnaround); 5,365 units permitted in Oklahoma County in 2024 (569 in 5+ unit buildings).
Forward outlook
- Local home prices are declining (-3.0%/yr); year-one equity from $691 of loan paydown is wiped out by about $3k of value loss. Plan a longer hold.
- Oklahoma County population projected at +41% by 2050 — long-run rental-demand tailwind backs the buy-and-hold thesis.
- At projected returns (-3.0% appreciation + 4.8% rent growth), your $28k cash investment doubles in ~6 years — after that, you're playing with house money.
Negotiation context
- Only 2 days on market — expect competitive offers; lowballing is unlikely to land.
- 3 sale attempts since 17y ago with the ask held roughly flat each time — persistent listings suggest the price (not the market) is what's stuck; bring a comps-based counter.
- Current owner paid $40k; list at $100k implies a 149% gain — meaningful room to come down on a strong offer.
Risks & watch-outs
- Climate carrying-cost: extreme-heat days projected 7→20/yr by 2055 (HVAC capex compounding) — expect insurance premiums to compound above CPI over the hold.
Questions for the listing agent
- Built in 1978 — when were the roof, HVAC, electrical panel, plumbing, and water heater last replaced?
- Is there a deadline driving the sale (1031 exchange, divorce, estate, relocation)? That informs how much negotiation room exists.
- Schools are F-rated, which usually means shorter tenancies and higher turnover. Who's the typical renter profile here, and what's been the actual vacancy rate?
- Crime grade is F in this area — have there been break-ins, vandalism, or insurance claims at this property in the last 3 years? What carrier currently insures it and at what premium?
- What's the average days-on-market for RENTAL listings here right now (not sales)? A rising rental-DOM trend means longer vacancies and softer asking-rent achievability than the comps imply.
- What's the recent tenant-quality profile in this submarket — average credit score on applications, eviction rate, late-payment / NSF rate, and stable-employment percentage? A property-management company in the area should have these aggregated.
- How much new for-sale + rental construction is in the pipeline within 1–3 miles? Heavy new supply typically softens prices + rents 12–24 months out; constrained supply supports both.
Investment metrics
- 1% rule
- 1.42% ✓
- Cap rate
- 11.48%
- Cash-on-cash
- 18.53%
- DSCR
- 1.82
- GRM
- 5.9
CMA / ARV
- ARV (on-the-fly)
- $182,428
- Comps found
- 12
Show comp detail 12 sales within ~0.75 mi
| Address | Dist | Beds/Ba | Sqft | Sold | Price | $/sf | Match |
|---|---|---|---|---|---|---|---|
| 3117 SE 57th St | 0.06mi | 3/2.0 | 1,648 (+7%) | 12mo | $165,000 | $100 | 76 |
| 5312 Evanbrook Ter | 0.40mi | 3/1.5 | 1,641 (+6%) | 2mo | $167,900 | $102 | 67 |
| 5121 Keith Dr | 0.55mi | 3/2.0 | 1,470 (-5%) | 2mo | $195,000 | $133 | 65 |
| 5517 S Karen St | 0.63mi | 3/1.5 | 1,549 (+0%) | 8mo | $160,000 | $103 | 62 |
| 5201 Keith Dr | 0.53mi | 3/2.0 | 1,422 (-8%) | 2mo | $175,000 | $123 | 60 |
| 5204 Shalimar Dr | 0.49mi | 3/1.5 | 1,476 (-4%) | 10mo | $172,000 | $117 | 59 |
| 5413 Evanbrook Ter | 0.33mi | 3/2.0 | 1,336 (-14%) | 8mo | $146,600 | $110 | 56 |
| 3113 SE 54th St | 0.21mi | 4/1.5 (+1) | 1,334 (-14%) | 6mo | $164,000 | $123 | 55 |
| 5104 N Oak Valley Rd | 0.64mi | 3/2.0 | 1,426 (-8%) | 3mo | $172,000 | $121 | 55 |
| 5008 Keith Dr | 0.65mi | 3/2.0 | 1,442 (-7%) | 10mo | $175,000 | $121 | 50 |
| 5516 S Kathy Dr | 0.60mi | 3/2.0 | 1,759 (+14%) | 4mo | $175,000 | $99 | 45 |
| 5004 S Briarwood Dr | 0.57mi | 4/1.5 (+1) | 1,352 (-12%) | 2mo | $160,000 | $118 | 44 |
Match score weights: distance 35% · size 25% · config 20% · recency 20%. Top-matched comps best support the ARV.
Projected returns pro-forma
-3.0% appreciation · 4.76% rent growth · sell at horizon
- IRR
- 12.2%
- Equity multiple
- 1.50×
- Total profit
- $13,917
- Equity at exit
- $14,910
- IRR
- 22.5%
- Equity multiple
- 3.09×
- Total profit
- $58,576
- Equity at exit
- $8,646
Cash invested: $28,000 (down + closing). Projections, not guarantees.
Landlord ↔ Tenant lean methodology
- Overall (STATE)
- 83 Strongly Landlord-Friendly
- State Oklahoma
- 83 Strongly Landlord-Friendly · R+20
- County
- — inherits STATE
- City
- — inherits STATE
ZIP-level market 73135
- Home prices YoY
- -8.0%
- Rents YoY
- 4.8%
- Active inventory
- 89
- Price-to-rent
- 5.9×
Monthly cashflow live
- Estimated rent
- $1,424 high interval (Pro) →
- Mortgage (P&I)
- −$524
- Tax from tax record
- −$127 /mo · $1,518/yr
- Insurance
- −$42
- HOA
- −$0
- Vacancy / Maint / Mgmt
- −$299
- Net cashflow
- $432
Break-even live
UW: 25.0% down · 7.5% · 30yr · 1.5% tax · 5.0% vac · 8.0% maint · 8.0% mgmt
Financing live
Cash to close
- Down payment
- $25,000
- Closing costs
- $3,000
- Reserves months
- —
- Total cash needed
- —
Loan-product check · same deal, 3 products live
Conventional
25% down · 7.5% · 30yr
- Down + closing
- —
- Monthly P&I
- —
- Monthly cashflow
- —
- DSCR
- —
- Eligible?
- —
Personal DTI + credit; lowest rate.
DSCR
20% down · 8.5% · 30yr
- Down + closing
- —
- Monthly P&I
- —
- Monthly cashflow
- —
- DSCR
- —
- Eligible?
- —
No personal income docs; deal must DSCR.
Hard money
10% down · 12.0% · 12mo
- Down + closing
- —
- Monthly P&I
- —
- Monthly cashflow
- —
- DSCR
- —
- Eligible?
- —
Short-term bridge; refi at stabilization.
Rent comps 30 comps
| Address | Beds | Baths | Sqft | Rent | $/sqft | DOM | Units | Dist |
|---|---|---|---|---|---|---|---|---|
| 3205 SE 55th St Oklahoma City, OK | 3.0 | 1.5 | 1119 | $1,300 | $1.16 | 44d | 1 | 0.12mi |
| 3424 Parker Dr Oklahoma City, OK | 3.0 | 1.0 | 1125 | $450 | $0.40 | 44d | 1 | 0.16mi |
| 5609 Evanbrook Ter Oklahoma City, OK | 3.0 | 2.0 | 1175 | $1,395 | $1.19 | 2d | 1 | 0.23mi |
| 5609 Evanbrook Ter Oklahoma City, OK | 3.0 | 2.0 | 1175 | $1,395 | $1.19 | 24d | 1 | 0.23mi |
| 5305 Brookdale St Oklahoma City, OK | 3.0 | 2.0 | 1205 | $1,195 | $0.99 | 12d | 1 | 0.27mi |
| 5012 Creekwood Ter Oklahoma City, OK | 3.0 | 1.5 | 1250 | $1,395 | $1.12 | 44d | 1 | 0.48mi |
| 3808 Oakcliff Dr Oklahoma City, OK | 3.0 | 2.0 | 1715 | $1,475 | $0.86 | 2d | 1 | 0.70mi |
| 2908 SE 47th St Oklahoma City, OK | 3.0 | 1.0 | 1100 | $1,350 | $1.23 | 2d | 1 | 0.71mi |
| 3741 SE 48th Pl Oklahoma City, OK | 3.0 | 2.0 | 1370 | $1,225 | $0.89 | 2d | 1 | 0.82mi |
| 4700 Clendon Way Oklahoma City, OK | 3.0 | 2.0 | 1434 | $1,450 | $1.01 | 14d | 1 | 0.85mi |
| 2532 SE 47th St Oklahoma City, OK | 4.0 | 1.0 | 1215 | $1,550 | $1.28 | 2d | 1 | 0.86mi |
| 4008 SE 47th St Oklahoma City, OK | 3.0 | 1.5 | 1082 | $1,145 | $1.06 | 3d | 1 | 0.90mi |
| 3916 SE 46th St Oklahoma City, OK | 3.0 | 1.5 | 1220 | $1,295 | $1.06 | 24d | 1 | 0.91mi |
| 4016 SE 47th St Oklahoma City, OK | 3.0 | 1.5 | 1245 | $1,199 | $0.96 | 4d | 1 | 0.91mi |
| 4900 S Dimple Dr Oklahoma City, OK | 3.0 | 1.5 | 1463 | $1,025 | $0.70 | 3d | 1 | 0.93mi |
| 4220 SE 49th St Oklahoma City, OK | 3.0 | 2.0 | 1223 | $1,175 | $0.96 | 24d | 1 | 0.94mi |
| 4909 Cinderella Dr Oklahoma City, OK | 3.0 | 2.0 | 1113 | $1,150 | $1.03 | 3d | 1 | 0.95mi |
| 4912 S Fairmont Ave Oklahoma City, OK | 3.0 | 2.0 | 1330 | $1,450 | $1.09 | 3d | 1 | 0.96mi |
| 3451 SE 44th St Oklahoma City, OK | 1.0–3.0 | 1.0–2.0 | 974 | $950 | $0.98 | 12d | 4 | 0.97mi |
| 4816 S Fairmont Ave Oklahoma City, OK | 3.0 | 2.0 | 1091 | $1,275 | $1.17 | 24d | 1 | 0.99mi |
| 3920 Dentwood Ter Del City, OK | 4.0 | 1.5 | 1624 | $1,395 | $0.86 | 2d | 1 | 1.03mi |
| 4104 SE 45th Ter Oklahoma City, OK | 4.0 | 1.5 | 1111 | $1,275 | $1.15 | 2d | 1 | 1.06mi |
| 3224 Lazy Ln Oklahoma City, OK | 3.0 | 2.0 | 1440 | $1,300 | $0.90 | 24d | 1 | 1.06mi |
| 4309 SE 48th Ter Oklahoma City, OK | 3.0 | 2.0 | 1458 | $1,525 | $1.05 | 2d | 1 | 1.06mi |
| 4900 Sunny Ct Oklahoma City, OK | 3.0 | 2.0 | 1281 | $1,600 | $1.25 | 3d | 1 | 1.11mi |
| 4716 SE 47th St Oklahoma City, OK | 3.0 | 2.0 | 1973 | $1,500 | $0.76 | 4d | 1 | 1.35mi |
| 4116 Overland Dr Oklahoma City, OK | 3.0 | 2.0 | 1363 | $1,500 | $1.10 | 2d | 1 | 1.41mi |
| 5004 SE 52nd St Oklahoma City, OK | 3.0 | 2.0 | 1538 | $1,900 | $1.24 | 3d | 1 | 1.44mi |
| 3024 Hillside Dr Oklahoma City, OK | 4.0 | 2.0 | 1686 | $1,550 | $0.92 | 10d | 1 | 1.47mi |
| 4825 Eric Dr Oklahoma City, OK | 3.0 | 2.0 | 1488 | $1,695 | $1.14 | 14d | 1 | 1.48mi |
Listing history 8 events
-
2026-05-07status Pending
-
2026-05-05$100,000 Active
-
2014-07-01historical
-
2014-03-31$82,500
-
2009-03-27soldstatus $40,150
-
2009-02-12$37,100
-
2006-01-04soldstatus $88,000
-
1990-03-21soldstatus $30,125
ⓘ Source: listings_history table (triggers on properties + properties_extension) + one-shot
backfill from property_details.listing_events for pre-trigger history.
Tax reassessment forecast OK · Resets to sale price
- Current annual tax
- $1,518 · $127/mo
- Projected year-2 tax
- $1,518 · $127/mo
- Expected delta
- $0/yr ($0/mo · 0.0%)
ⓘ Screening estimate from a state-policy table — verify with the county assessor before closing.
Climate risk First Street
- Flood 1/10 Low FEMA zone X (unshaded) · 0% chance over 30 yrs
- Wildfire 1/10 Low
- Heat 6/10 Major 7 d/yr ≥107°F today · 20 d/yr by 30 yrs out
- Wind 2/10 Low 4% chance of damaging wind over 30 yrs
- Air quality 1/10 Low 0 unhealthy d/yr today · 0 by 30 yrs out
Nearby sold comps map
Loading sold comps map…
Walkable amenities ~0.75 mi
Loading nearby amenities…
Taxation est. · year 1
- Rental income
- $17,087
- − Mortgage interest
- −$5,602
- − Property taxes
- −$1,518
- − Insurance
- −$500
- − Repairs & maintenance
- −$1,367
- − Management
- −$1,367
- − Depreciation
- −$2,909
- Taxable income
- $3,824
- Est. tax owed @ 24.0%
- −$918
- After-tax cash flow
- $4,270/yr
For passive investors: Depreciation is non-cash, so a rental often shows a tax loss while cash-flowing — sheltering income. Rental losses are passive: they offset passive income freely, and up to $25,000/yr can offset ordinary (W-2) income if you actively participate and your MAGI is under $100k (phasing out to $0 by $150k); unused losses carry forward. On sale, claimed depreciation is recaptured at up to 25%, and gains may owe capital-gains tax (a 1031 exchange can defer both). Figures are a year-1 estimate at your 24.0% rate — not tax advice; consult a CPA.
Schools (NCES district)
- District
- Oklahoma City
- NCES district ID
- 4022770
- Math proficiency
- 7% ▼ -5.00%
- Reading proficiency
- 10% ▼ -6.00%
- Median HH income
- $35,606
- Composite
- 7.0/100
- National rank
- #9970
- State rank
- #254 of 270 in OK
Livability — Oklahoma City
- Score
- 80/100
- State rank
- #3
- US rank
- #1635
Category grades
Schools grade is shown separately in the Schools card above.
Census & demographics
- Census place
- Oklahoma City, OK
- County
- Oklahoma County · 771,644 people
- City population
- 498,656
- Metro
- Oklahoma City, OK
- Population (ZIP)
- 22,022
- Household income
- $63,478
- Rent vs Own
- Severe rent burden
- 1083.0
Population outlook (Oklahoma County) Hauer SSP2
- Today (2025)
- 911,875 people
- By 2030
- 982,413 · +7.7%
- By 2040
- 1,130,468 · +24.0%
- By 2050
- 1,288,422 · +41.3%
- By 2075
- 1,711,482 · +87.7%
- By 2100
- 2,088,448 · +129.0%
Race, ethnicity, and origin ACS 2023
- Neighborhood character
- Highly diverse neighborhood (Simpson 0.73)
- Race & ethnicity
- White 41% Black 25% Hispanic / Latino 19% Two or more races 15% Asian 6% Native American 2%
- Hispanic origin (detail)
- Mexican 15%
- Common ancestry
- Italian 1% Lithuanian 1% Slovak 1%
- Foreign-born
- 9% · Canada, Vietnam
- Languages at home
- 83% English-only · Spanish 11% Vietnamese 3% Other Asian/Pacific 1%
Political lean MEDSL · Oklahoma
- 2024 margin
- Toss-up / Even · D 48.0% · R 49.7% · Other 2.3%
- 2008→2024 swing
- +15.1pp toward D · 2008: -16.8pp · 2024: -1.7pp
- All cycles
- 2024: R+1.7 2020: R+1.1 2016: R+10.5 2012: R+16.7 2008: R+16.8
Not yet ingested
- Civics
- —
Market trends
- HPI YoY
- ▼ -20.17%
- Current HPI
- 232.4241
- Rent YoY
- ▲ 4.76%
- Metro
- Oklahoma City, OK
- State GDP YoY
- ▲ 1.55%
- F500 in state
- 6
Industry mix (Fortune 500 HQ in OK)
| Industry | F500 HQs | Revenue |
|---|---|---|
| Energy | 3 | $48B |
|
||
Price history
+232.0% since first listed8 events — show timeline
- 2026-05-07 Pending — MLSOK
- 2026-05-05 Listed $100,000 MLSOK
- 2014-07-01 Listing Removed — MLSOK
- 2014-03-31 Listed $82,500 MLSOK
- 2009-03-27 Sold (MLS) $40,150 MLSOK
- 2009-02-12 Listed $37,100 MLSOK
- 2006-01-04 Sold (Public Records) $88,000 Public Records
- 1990-03-21 Sold (Public Records) $30,125 Public Records
Property tax history
+4.6%/yrLatest (2025): $1,518 · +4.2% YoY. Source: county tax records.
Cash-flow waterfall
monthlySold comps — $/sqft
last 12 mo · ≤1 miLoading sold comps…