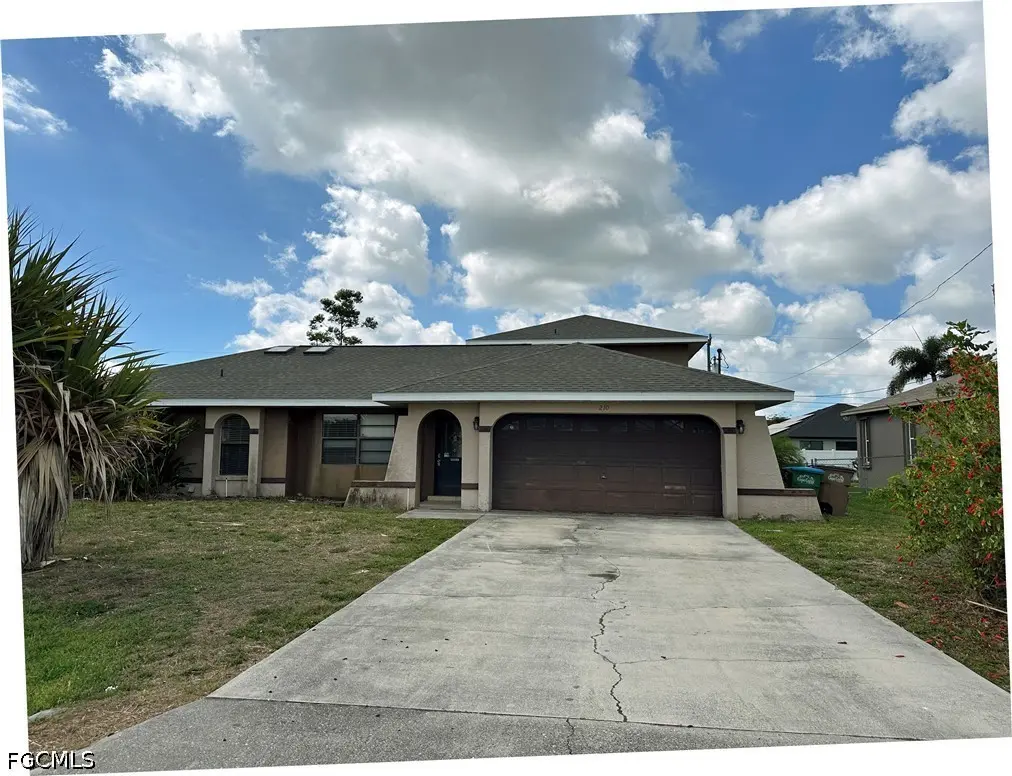
210 SE 4th St · Cape Coral, FL
Flood risk 5/10 · Moderate
- FEMA flood zone
- X (unshaded)
- Chance of flooding over 30 yrs
- 0.24%
- Est. flood insurance / yr
- $507 – $1,088
Fire risk 1/10 · Minimal
- Est. fire insurance / yr
- $947 – $1,759
Heat risk 10/10 · Severe
- Hot days now (above 106°F)
- 7 days/yr
- Hot days in 30 yrs
- 29 days/yr
Wind risk 10/10 · Severe
- Chance of severe wind over 30 yrs
- 99.0%
Air-quality risk 2/10 · Minimal
- Unhealthy air days now
- 1 days/yr
- Unhealthy air days in 30 yrs
- 1 days/yr
Risk factors via First Street. Map © Google.
Why this score? — see what drove the D grade
The composite is a weighted blend of 9 inputs, each scored 0–100. Each bar is that input's sub-score; the figure is the points it added to the 100-point composite (weight × sub-score).
- Cash flow +13.2/30.0
- ARV discount +7.5/15.0
- 1% rule +4.7/10.0
- Schools +4.1/10.0
- DSCR +3.9/10.0
- Livability +3.9/5.0
- Condition / age +2.5/5.0
- Rent growth +0.7/5.0
- Appreciation +0.0/10.0
$239,900
🖨 Deal sheet 📄 Offer letter ✓ Due diligence
Listing remarks MLS
Wanting to customize this home? Ask us about our special financing available for this home. Need space? Well here it is! This place offers 5 possible bedrooms, 3.5 bath home located near Sun Splash Family Water Park and Saratoga Lake Park. Kitchen offers new cabinets with granite counter tops, large commercial look refrigerator, tile floors and even a fenced yard. Two master suites/in law suite: one on the ground level and one upstairs, perfect for any situation. Home requires a little tlc but certainly the perfect start for the space.
Key facts
- 0.24 acre lot
- 2 garage spots
- Built 1987
Property features AI
Finance
- Financial info: Pets allowed
- HOA & community: Non-gated community; Association fee listed as 0
Exterior
- Parking: Attached garage with 2 spaces; Assigned parking; Garage door opener; Covered parking (2 spaces)
- Utilities: Cable available; Sewer assessment paid; Water assessment paid
- Home design: Single-family residence (resale); 2 stories; Faces north; Has a view
- Construction: Built with block, concrete, stucco, and wood frame; Shingle roof
- Exterior features: Fence; Automatic sprinklers; Lanai; Porch; Screened patio/porch; South exposure; Publicly maintained road; Rectangular lot
Interior
- Kitchen: Freezer; Microwave; Range; Refrigerator
- Bedrooms: Den; Screened porch
- Flooring: Carpet; Laminate; Tile
- Bathrooms: 3 full bathrooms; 1 half bathroom
- Heating & cooling: Central heating (electric); Central air conditioning (electric); Ceiling fan(s)
- Interior features: Breakfast bar; Bathtub; Dual sinks; Living/dining room; Separate shower; Upper-level primary; Single-hung windows; Unfurnished
- Laundry & utility: Laundry inside
Neighborhood map
What this means for you Summary
Snapshot
- This is a 3-bed/2.0-bath single-family listed at $240k.
Deal economics
- At list price, monthly cash flow is $-6 ($-77/yr) — negative.
- To cash-flow at today's rent, offer at most $239k (0.5% below list).
- To meet the 1% rule (rent ≥ 1% of price), the offer needs to be $234k (2.6% below list).
- Recommended offer: $234k (2.6% below list) — sets the bar for 1% rule.
- Cap rate 6.3% vs local median 3.1% in Cape Coral — top-decile yield for the area; either an underpriced asset or a hidden risk that comps aren't pricing in. Stress-test before assuming the spread holds.
Location & tenants
- Location reads 77/100 on livability (#208 in FL, #3,098 nationally) — a middle-class / working-renter tenant base. Strengths: housing A+, health & safety A+, amenities B+; Watch: commute F.
- Lee (suburban): math 47% / reading 50% proficiency, ranked #42 of 73 in FL (top 58%) — families likely to look elsewhere, expect single-tenant / working-renter base with shorter leases.
- Market conditions: Rents falling (-7.1%/yr); 467 active listings in the ZIP; 27 comparable units currently listed for rent nearby; rentals at typical pace (median 16d on market — plan ~3-4 weeks tenant-placement turnaround); 15,411 units permitted in Lee County in 2024 (4,686 in 5+ unit buildings).
- This rent runs 40% of the median local income ($71k/yr) — at the standard rent-burdened threshold; future hikes will face affordability resistance.
Forward outlook
- Local home prices are declining (-3.0%/yr); year-one equity from $2k of loan paydown is wiped out by about $7k of value loss. Plan a longer hold.
- Lee County population projected at +44% by 2050 — long-run rental-demand tailwind backs the buy-and-hold thesis.
Negotiation context
- Only 5 days on market — expect competitive offers; lowballing is unlikely to land.
- 6 sale attempts since 11y ago with the ask held roughly flat each time — persistent listings suggest the price (not the market) is what's stuck; bring a comps-based counter.
Risks & watch-outs
- Climate carrying-cost: moderate flood risk; severe wind risk, 99% chance of damaging wind over 30y; extreme-heat days projected 7→29/yr by 2055 (HVAC capex compounding) — expect insurance premiums to compound above CPI over the hold.
Questions for the listing agent
- What do current leases actually rent for vs. the listed asking? Can we see a recent rent roll and the last 12 months of T-12 income?
- Is there a deadline driving the sale (1031 exchange, divorce, estate, relocation)? That informs how much negotiation room exists.
- Schools are B-rated — typically a magnet for longer-tenancy family renters. What's the average tenant stay here, and is there a school-zone premium baked into asking?
- The area grade is low — what's the realistic commute time and amenity access for the typical tenant pool here? Any planned neighborhood developments (good or bad) we should know about?
- What's the average days-on-market for RENTAL listings here right now (not sales)? A rising rental-DOM trend means longer vacancies and softer asking-rent achievability than the comps imply.
- What's the recent tenant-quality profile in this submarket — average credit score on applications, eviction rate, late-payment / NSF rate, and stable-employment percentage? A property-management company in the area should have these aggregated.
- How much new for-sale + rental construction is in the pipeline within 1–3 miles? Heavy new supply typically softens prices + rents 12–24 months out; constrained supply supports both.
Investment metrics
- 1% rule
- 0.97% ✗
- Cap rate
- 6.26%
- Cash-on-cash
- -0.12%
- DSCR
- 0.99
- GRM
- 8.6
CMA / ARV
No comps found within radius.
Projected returns pro-forma
-3.0% appreciation · 0.0% rent growth · sell at horizon
- IRR
- -20.3%
- Equity multiple
- 0.32×
- Total profit
- $-45,977
- Equity at exit
- $35,770
- IRR
- -23.2%
- Equity multiple
- 0.01×
- Total profit
- $-66,398
- Equity at exit
- $20,742
Cash invested: $67,172 (down + closing). Projections, not guarantees.
Landlord ↔ Tenant lean methodology
- Overall (STATE)
- 87 Strongly Landlord-Friendly
- State Florida
- 87 Strongly Landlord-Friendly · R+3
- County
- — inherits STATE
- City
- — inherits STATE
ZIP-level market 33990
- Rents YoY
- -7.1%
- Active inventory
- 467
- Price-to-rent
- 8.6×
Monthly cashflow live
- Estimated rent
- $2,336 high interval (Pro) →
- Mortgage (P&I)
- −$1,258
- Tax from tax record
- −$494 /mo · $5,931/yr
- Insurance
- −$100
- HOA
- −$0
- Vacancy / Maint / Mgmt
- −$491
- Net cashflow
- $-6
Break-even live
UW: 25.0% down · 7.5% · 30yr · 1.5% tax · 5.0% vac · 8.0% maint · 8.0% mgmt
Financing live
Cash to close
- Down payment
- $59,975
- Closing costs
- $7,197
- Reserves months
- —
- Total cash needed
- —
Loan-product check · same deal, 3 products live
Conventional
25% down · 7.5% · 30yr
- Down + closing
- —
- Monthly P&I
- —
- Monthly cashflow
- —
- DSCR
- —
- Eligible?
- —
Personal DTI + credit; lowest rate.
DSCR
20% down · 8.5% · 30yr
- Down + closing
- —
- Monthly P&I
- —
- Monthly cashflow
- —
- DSCR
- —
- Eligible?
- —
No personal income docs; deal must DSCR.
Hard money
10% down · 12.0% · 12mo
- Down + closing
- —
- Monthly P&I
- —
- Monthly cashflow
- —
- DSCR
- —
- Eligible?
- —
Short-term bridge; refi at stabilization.
Rent comps 27 comps
| Address | Beds | Baths | Sqft | Rent | $/sqft | DOM | Units | Dist |
|---|---|---|---|---|---|---|---|---|
| 237 SE 3rd St Cape Coral, FL | 4.0 | 2.0 | 1828 | $2,326 | $1.27 | 3d | 1 | 0.13mi |
| 410 SE 1st Ter Cape Coral, FL | 4.0 | 2.0 | 2330 | $2,600 | $1.12 | 16d | 1 | 0.35mi |
| 410 SE 1st Ter Cape Coral, FL | 4.0 | 2.0 | 2330 | $2,800 | $1.20 | 23d | 1 | 0.35mi |
| 620 SE 1st Pl Cape Coral, FL | 4.0 | 2.0 | 1828 | $1,811 | $0.99 | 3d | 1 | 0.42mi |
| 537 SE 6th Pl Unit B Cape Coral, FL | 2.0 | 2.0 | 2019 | $1,575 | $0.78 | 23d | 1 | 0.55mi |
| 30 SE 1st Pl Unit 3013 Cape Coral, FL | 4.0 | 3.0 | 2020 | $2,300 | $1.14 | 23d | 1 | 0.56mi |
| 616 SE 9th St Cape Coral, FL | 2.0 | 2.0 | 1970 | $1,400 | $0.71 | 3d | 1 | 0.82mi |
| 204 NW 1st St Cape Coral, FL | 4.0 | 3.0 | 1826 | $2,300 | $1.26 | 3d | 1 | 0.88mi |
| 610 SE 10th St Unit A Cape Coral, FL | 2.0 | 2.0 | 2188 | $1,350 | $0.62 | 3d | 1 | 0.92mi |
| 106 NE 8th Pl Cape Coral, FL | 4.0 | 3.0 | 2108 | $3,995 | $1.90 | 23d | 1 | 0.95mi |
| 433 SW 6th St Cape Coral, FL | 3.0 | 2.0 | 2437 | $2,225 | $0.91 | 2d | 1 | 0.98mi |
| 118 NW 2nd Ave Cape Coral, FL | 3.0 | 3.0 | 1932 | $3,600 | $1.86 | 16d | 1 | 1.00mi |
| 409 SW 8th St Cape Coral, FL | 4.0 | 2.0 | 2108 | $3,500 | $1.66 | 16d | 1 | 1.04mi |
| 203 NE 9th Ave Cape Coral, FL | 3.0 | 2.0 | 1756 | $1,715 | $0.98 | 16d | 1 | 1.08mi |
| 1119 SE 1st Ter Cape Coral, FL | 3.0 | 3.0 | 2256 | $5,000 | $2.22 | 23d | 1 | 1.10mi |
| 221 NW 3rd Pl Cape Coral, FL | 4.0 | 2.0 | 2204 | $2,600 | $1.18 | 16d | 1 | 1.11mi |
| 227 NW 3rd Ter Cape Coral, FL | 3.0 | 2.0 | 1975 | $2,300 | $1.16 | 21d | 1 | 1.17mi |
| 1312 SE 2nd Pl Cape Coral, FL | 3.0 | 2.0 | 2344 | $1,395 | $0.60 | 23d | 1 | 1.17mi |
| 526 NW 1st Ln Cape Coral, FL | 4.0 | 2.0 | 1793 | $2,000 | $1.12 | 23d | 1 | 1.20mi |
| 603 SE 13th Ter Cape Coral, FL | 2.0 | 2.0 | 2398 | $1,750 | $0.73 | 23d | 1 | 1.27mi |
| 713 SW 4th Ter Cape Coral, FL | 3.0 | 2.0 | 1756 | $2,085 | $1.19 | 2d | 1 | 1.29mi |
| 213 NW 5th St Cape Coral, FL | 4.0 | 2.0 | 1809 | $2,195 | $1.21 | 3d | 1 | 1.32mi |
| 220 SE 14th Ter Cape Coral, FL | 4.0 | 2.0 | 1828 | $1,721 | $0.94 | 3d | 1 | 1.34mi |
| 607 SE 14th Ter Cape Coral, FL | 3.0 | 2.0 | 2418 | $1,650 | $0.68 | 23d | 1 | 1.40mi |
| 1320 SE 2nd St Cape Coral, FL | 3.0 | 2.0 | 1918 | $1,870 | $0.97 | 16d | 1 | 1.41mi |
| 1327 SW 3rd Ave Cape Coral, FL | 3.0 | 2.0 | 1882 | $2,800 | $1.49 | 23d | 1 | 1.45mi |
| 314 SE 15th Ter Cape Coral, FL | 4.0 | 2.0 | 2010 | $3,000 | $1.49 | 23d | 1 | 1.46mi |
Listing history 22 events
-
2026-05-20status Pending
-
2026-05-16status Active
-
2026-05-16historical
-
2026-05-15$239,900 Active
-
2026-04-05historical $3,249
-
2026-04-03$3,249
-
2016-04-12price $215,000 541-char remark
Show marketing remark (541 chars)
Wanting to customize this home? Ask us about our special financing available for this home. Need space? Well here it is! This place offers 5 possible bedrooms, 3.5 bath home located near Sun Splash Family Water Park and Saratoga Lake Park. Kitchen offers new cabinets with granite counter tops, large commercial look refrigerator, tile floors and even a fenced yard. Two master suites/in law suite: one on the ground level and one upstairs, perfect for any situation. Home requires a little tlc but certainly the perfect start for the space.
-
2016-04-08price $220,000 541-char remark
Show marketing remark (541 chars)
Wanting to customize this home? Ask us about our special financing available for this home. Need space? Well here it is! This place offers 5 possible bedrooms, 3.5 bath home located near Sun Splash Family Water Park and Saratoga Lake Park. Kitchen offers new cabinets with granite counter tops, large commercial look refrigerator, tile floors and even a fenced yard. Two master suites/in law suite: one on the ground level and one upstairs, perfect for any situation. Home requires a little tlc but certainly the perfect start for the space.
-
2016-04-08soldstatus $215,000 Sold 541-char remark
Show marketing remark (541 chars)
Wanting to customize this home? Ask us about our special financing available for this home. Need space? Well here it is! This place offers 5 possible bedrooms, 3.5 bath home located near Sun Splash Family Water Park and Saratoga Lake Park. Kitchen offers new cabinets with granite counter tops, large commercial look refrigerator, tile floors and even a fenced yard. Two master suites/in law suite: one on the ground level and one upstairs, perfect for any situation. Home requires a little tlc but certainly the perfect start for the space.
-
2016-04-08soldstatus $215,000
Show marketing remark (541 chars)
Wanting to customize this home? Ask us about our special financing available for this home. Need space? Well here it is! This place offers 5 possible bedrooms, 3.5 bath home located near Sun Splash Family Water Park and Saratoga Lake Park. Kitchen offers new cabinets with granite counter tops, large commercial look refrigerator, tile floors and even a fenced yard. Two master suites/in law suite: one on the ground level and one upstairs, perfect for any situation. Home requires a little tlc but certainly the perfect start for the space.
-
2016-03-14status Pending 541-char remark
Show marketing remark (541 chars)
Wanting to customize this home? Ask us about our special financing available for this home. Need space? Well here it is! This place offers 5 possible bedrooms, 3.5 bath home located near Sun Splash Family Water Park and Saratoga Lake Park. Kitchen offers new cabinets with granite counter tops, large commercial look refrigerator, tile floors and even a fenced yard. Two master suites/in law suite: one on the ground level and one upstairs, perfect for any situation. Home requires a little tlc but certainly the perfect start for the space.
-
2016-02-01$220,000 Active 541-char remark
Show marketing remark (541 chars)
Wanting to customize this home? Ask us about our special financing available for this home. Need space? Well here it is! This place offers 5 possible bedrooms, 3.5 bath home located near Sun Splash Family Water Park and Saratoga Lake Park. Kitchen offers new cabinets with granite counter tops, large commercial look refrigerator, tile floors and even a fenced yard. Two master suites/in law suite: one on the ground level and one upstairs, perfect for any situation. Home requires a little tlc but certainly the perfect start for the space.
-
2016-01-31historical
-
2015-11-10price $229,900
-
2015-10-06price $234,900
-
2015-09-16status Active
-
2015-08-31status Pending
-
2015-07-09$237,900 Active
-
2013-09-17price $129,000
-
2010-08-20soldstatus $137,000
-
2010-08-18soldstatus $137,000
-
1998-03-27soldstatus $75,900
ⓘ Source: listings_history table (triggers on properties + properties_extension) + one-shot
backfill from property_details.listing_events for pre-trigger history.
Tax reassessment forecast FL · Resets to sale price
- Current annual tax
- $5,931 · $494/mo
- Projected year-2 tax
- $5,931 · $494/mo
- Expected delta
- $0/yr ($0/mo · 0.0%)
ⓘ Screening estimate from a state-policy table — verify with the county assessor before closing.
Climate risk First Street
- Flood 5/10 Major FEMA zone X (unshaded) · 24% chance over 30 yrs
- Wildfire 1/10 Low
- Heat 10/10 Extreme 7 d/yr ≥106°F today · 29 d/yr by 30 yrs out
- Wind 10/10 Extreme 99% chance of damaging wind over 30 yrs
- Air quality 2/10 Low 1 unhealthy d/yr today · 1 by 30 yrs out
Nearby sold comps map
Loading sold comps map…
Walkable amenities ~0.75 mi
Loading nearby amenities…
Taxation est. · year 1
- Rental income
- $28,038
- − Mortgage interest
- −$13,438
- − Property taxes
- −$5,931
- − Insurance
- −$1,200
- − Repairs & maintenance
- −$2,243
- − Management
- −$2,243
- − Depreciation
- −$6,979
- Taxable loss
- −$3,996
- Est. tax savings @ 24.0%
- +$959
- After-tax cash flow
- $882/yr
For passive investors: Depreciation is non-cash, so a rental often shows a tax loss while cash-flowing — sheltering income. Rental losses are passive: they offset passive income freely, and up to $25,000/yr can offset ordinary (W-2) income if you actively participate and your MAGI is under $100k (phasing out to $0 by $150k); unused losses carry forward. On sale, claimed depreciation is recaptured at up to 25%, and gains may owe capital-gains tax (a 1031 exchange can defer both). Figures are a year-1 estimate at your 24.0% rate — not tax advice; consult a CPA.
Schools (NCES district)
- District
- Lee
- NCES district ID
- 1201080
- Math proficiency
- 47% ▼ -11.00%
- Reading proficiency
- 50% ▼ -4.00%
- Median HH income
- $49,518
- Composite
- 41.49/100
- National rank
- #3458
- State rank
- #42 of 73 in FL
Livability — Cape Coral
- Score
- 77/100
- State rank
- #208
- US rank
- #3098
Category grades
Schools grade is shown separately in the Schools card above.
Census & demographics
- Census place
- Cape Coral, FL
- County
- Lee County · 788,662 people
- City population
- 217,388
- Metro
- Cape Coral-Fort Myers, FL
- Population (ZIP)
- 34,713
- Household income
- $70,665
- Rent vs Own
- Severe rent burden
- 1246.0
Population outlook (Lee County) Hauer SSP2
- Today (2025)
- 871,946 people
- By 2030
- 955,468 · +9.6%
- By 2040
- 1,113,587 · +27.7%
- By 2050
- 1,256,891 · +44.1%
- By 2075
- 1,560,270 · +78.9%
- By 2100
- 1,726,848 · +98.0%
Race, ethnicity, and origin ACS 2023
- Neighborhood character
- Majority White (64%)
- Race & ethnicity
- White 64% Hispanic / Latino 26% Two or more races 17% Asian 3% Black 3%
- Hispanic origin (detail)
- Mexican 4% Puerto Rican 5% Cuban 8% Dominican 2%
- Common ancestry
- Romanian 3% Lithuanian 3% Italian 3%
- Foreign-born
- 20% · Canada, Jamaica, China
- Languages at home
- 74% English-only · Spanish 20% Other Indo-European 2% Russian/Polish/Slavic 1%
Political lean MEDSL · Lee
- 2024 margin
- Strong R (+28.4) · D 35.5% · R 63.9%
- 2008→2024 swing
- -18.0pp toward R · 2008: -10.4pp · 2024: -28.4pp
- All cycles
- 2024: R+28.4 2020: R+19.2 2016: R+20.4 2012: R+16.6 2008: R+10.4
Not yet ingested
- Civics
- —
Market trends
- HPI YoY
- ▼ -196.42%
- Current HPI
- 289.1969
- Rent YoY
- ▼ -7.11%
- Metro
- Cape Coral-Fort Myers, FL
- State GDP YoY
- ▲ 3.28%
- F500 in state
- 36
Industry mix (Fortune 500 HQ in FL)
| Industry | F500 HQs | Revenue |
|---|---|---|
| Industrial Technology | 2 | $29B |
|
||
| Insurance | 2 | $17B |
|
||
| Retail | 1 | $60B |
|
||
| Technology Distribution | 1 | $58B |
|
||
| Homebuilding | 1 | $35B |
|
||
| Technology Manufacturing | 1 | $35B |
|
||
Price history
+216.1% since first listed22 events — show timeline
- 2026-05-20 Pending — FORTMLS
- 2026-05-16 Relisted — FORTMLS
- 2026-05-16 Listing Removed — FORTMLS
- 2026-05-15 Listed $239,900 FORTMLS
- 2026-04-05 Rental Removed $3,249 Tricon
- 2026-04-03 Listed for Rent $3,249 Tricon
- 2016-04-12 Price Changed $215,000 FORTMLS
- 2016-04-08 Sold (Public Records) $215,000 Public Records
- 2016-04-08 Sold (MLS) $215,000 FORTMLS
- 2016-04-08 Price Changed $220,000 FORTMLS
- 2016-03-14 Pending — FORTMLS
- 2016-02-01 Listed $220,000 FORTMLS
- 2016-01-31 Listing Removed — FORTMLS
- 2015-11-10 Price Changed $229,900 FORTMLS
- 2015-10-06 Price Changed $234,900 FORTMLS
- 2015-09-16 Relisted — FORTMLS
- 2015-08-31 Pending — FORTMLS
- 2015-07-09 Listed $237,900 FORTMLS
- 2013-09-17 Price Changed $129,000 FORTMLS
- 2010-08-20 Sold (Public Records) $137,000 Public Records
- 2010-08-18 Sold (MLS) $137,000 FORTMLS
- 1998-03-27 Sold (Public Records) $75,900 Public Records
Property tax history
+8.3%/yrLatest (2025): $5,931 · -2.0% YoY. Source: county tax records.
Cash-flow waterfall
monthlySold comps — $/sqft
last 12 mo · ≤1 miLoading sold comps…