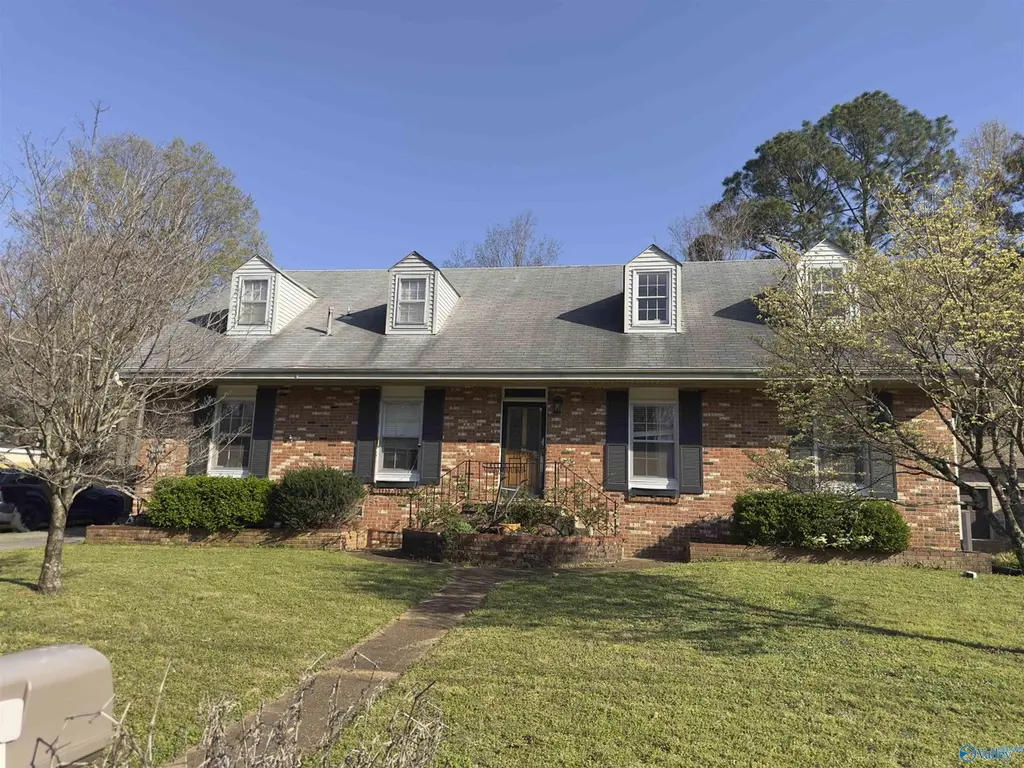
11036 Louis Dr SE · Huntsville, AL
Flood risk 1/10 · Minimal
- FEMA flood zone
- X (unshaded)
- Chance of flooding over 30 yrs
- 0.0%
- Est. flood insurance / yr
- $507 – $1,088
Fire risk 1/10 · Minimal
- Est. fire insurance / yr
- $916 – $1,700
Heat risk 6/10 · Moderate
- Hot days now (above 104°F)
- 7 days/yr
- Hot days in 30 yrs
- 20 days/yr
Wind risk 4/10 · Minor
- Chance of severe wind over 30 yrs
- 22.0%
Air-quality risk 2/10 · Minimal
- Unhealthy air days now
- 1 days/yr
- Unhealthy air days in 30 yrs
- 2 days/yr
Risk factors via First Street. Map © Google.
Why this score? — see what drove the D grade
The composite is a weighted blend of 9 inputs, each scored 0–100. Each bar is that input's sub-score; the figure is the points it added to the 100-point composite (weight × sub-score).
- ARV discount +15.0/15.0
- Cash flow +10.7/30.0
- Livability +4.1/5.0
- Rent growth +3.4/5.0
- DSCR +3.1/10.0
- 1% rule +2.9/10.0
- Schools +2.9/10.0
- Condition / age +2.5/5.0
- Appreciation +0.0/10.0
$260,000
🖨 Deal sheet 📄 Offer letter ✓ Due diligence
Listing remarks
Sold Prior to publication
Key facts
- 0.29 acre lot
- Garage
Property features AI
Finance
- Other: Living area reported as 2,874 square feet
- Financial info: No financial details provided
- HOA & community: No homeowners association; Subdivision: Lily Flagg Acres
Exterior
- Parking: Attached garage; Detached garage
- Security: No security features listed
- Utilities: Public sewer
- Home design: Single-family residence; Two levels; Residential property; Not new construction
- Construction: No year built provided; No construction materials or foundation details provided; No roof details provided
- Exterior features: Lot approximately 90 x 140; Public water
Interior
- Kitchen: No kitchen appliance details provided
- Bedrooms: 9 total rooms (bedroom count not specified)
- Flooring: No flooring details provided
- Bathrooms: 2 full bathrooms
- Heating & cooling: Central heating; Central cooling
- Interior features: Crawl space basement; Gas log fireplace
- Laundry & utility: No laundry or utility appliances listed
Neighborhood map
What this means for you Summary
Snapshot
- This is a 4-bed/1.0-bath single-family listed at $260k.
Deal economics
- At list price, monthly cash flow is $-122 ($-1k/yr) — negative.
- To cash-flow at today's rent, offer at most $238k (8.3% below list).
- To meet the 1% rule (rent ≥ 1% of price), the offer needs to be $204k (21.4% below list).
- Recommended offer: $204k (21.4% below list) — sets the bar for 1% rule.
- Cap rate 5.7% vs local median 3.8% in Huntsville — top-decile yield for the area; either an underpriced asset or a hidden risk that comps aren't pricing in. Stress-test before assuming the spread holds.
Location & tenants
- Location reads 82/100 on livability (#3 in AL, #1,082 nationally) — a professional / high-income tenant draw. Strengths: commute A+, cost of living A+, housing A+; Watch: crime F.
- Huntsville City (urban): math 21% / reading 46% proficiency, ranked #48 of 129 in AL (top 37%) — families likely to look elsewhere, expect single-tenant / working-renter base with shorter leases.
- Zoned schools: Weatherly Heights Elementary School (math 27% / reading 62%, grade F, #171 of 627 statewide, top 31%, 481 students, 42% FRL); Mountain Gap Middle School (math 27% / reading 63%, grade D, #38 of 257 statewide, top 14%, 419 students, 44% FRL); Virgil Grissom High School (math 34% / reading 40%, grade F, #39 of 305 statewide, top 13%, 1,974 students, 43% FRL) — zoned schools at 43% FRL track the district average.
- Market conditions: Rents rising (+3.7%/yr); 280 active listings in the ZIP; 15 comparable units currently listed for rent nearby; rentals lingering (median 44d on market — plan ~5-8 weeks vacancy on turnover, expect pricing pressure); 60% of comp listings sitting > 30 days — soft ceiling on asking rent; solid renter incomes; 4,709 units permitted in Madison County in 2024 (1,186 in 5+ unit buildings).
Forward outlook
- Local home prices are declining (-3.0%/yr); year-one equity from $2k of loan paydown is wiped out by about $8k of value loss. Plan a longer hold.
- Madison County population projected at +18% by 2050 — long-run rental-demand tailwind backs the buy-and-hold thesis.
Negotiation context
- Only 1 days on market — expect competitive offers; lowballing is unlikely to land.
- Current owner paid $190k; 37% above their basis — modest negotiation headroom, anchor on the comps not their cost.
Risks & watch-outs
- Climate carrying-cost: extreme-heat days projected 7→20/yr by 2055 (HVAC capex compounding) — expect insurance premiums to compound above CPI over the hold.
Questions for the listing agent
- What do current leases actually rent for vs. the listed asking? Can we see a recent rent roll and the last 12 months of T-12 income?
- Built in 1966 — when were the roof, HVAC, electrical panel, plumbing, and water heater last replaced?
- Is there a deadline driving the sale (1031 exchange, divorce, estate, relocation)? That informs how much negotiation room exists.
- Crime grade is F in this area — have there been break-ins, vandalism, or insurance claims at this property in the last 3 years? What carrier currently insures it and at what premium?
- The area grade is low — what's the realistic commute time and amenity access for the typical tenant pool here? Any planned neighborhood developments (good or bad) we should know about?
- What's the average days-on-market for RENTAL listings here right now (not sales)? A rising rental-DOM trend means longer vacancies and softer asking-rent achievability than the comps imply.
- What's the recent tenant-quality profile in this submarket — average credit score on applications, eviction rate, late-payment / NSF rate, and stable-employment percentage? A property-management company in the area should have these aggregated.
- How much new for-sale + rental construction is in the pipeline within 1–3 miles? Heavy new supply typically softens prices + rents 12–24 months out; constrained supply supports both.
Investment metrics
- 1% rule
- 0.79% ✗
- Cap rate
- 5.73%
- Cash-on-cash
- -2.01%
- DSCR
- 0.91
- GRM
- 10.6
CMA / ARV
- ARV (on-the-fly)
- $356,706
- Comps found
- 12
Show comp detail 12 sales within ~0.75 mi
| Address | Dist | Beds/Ba | Sqft | Sold | Price | $/sf | Match |
|---|---|---|---|---|---|---|---|
| 413 Cumberland Dr SE | 0.16mi | 5/3.0 (+1) | 2,405 (+0%) | 5mo | $360,000 | $150 | 75 |
| 601 SE Bain Dr | 0.14mi | 4/3.0 | 2,229 (-7%) | 1mo | $237,300 | $106 | 73 |
| 10110 Conrad Dr | 0.07mi | 4/2.5 | 2,148 (-10%) | 1mo | $380,000 | $177 | 73 |
| 418 Curtis Dr SE | 0.13mi | 4/3.0 | 2,700 (+13%) | 2mo | $375,000 | $139 | 63 |
| 11314 Woodcrest Dr | 0.53mi | 4/2.5 | 2,267 (-5%) | 4mo | $282,000 | $124 | 57 |
| 9606 Dortmund Dr SE | 0.53mi | 4/2.5 | 2,230 (-7%) | 4mo | $240,500 | $108 | 54 |
| 11026 Crestfield Dr | 0.34mi | 3/2.0 (-1) | 2,168 (-9%) | 6mo | $250,000 | $115 | 54 |
| 301 Belvidere Rd SE | 0.59mi | 4/2.5 | 2,284 (-5%) | 8mo | $339,900 | $149 | 53 |
| 11309 Woodcrest Dr SE | 0.50mi | 4/2.5 | 2,108 (-12%) | 1mo | $367,000 | $174 | 50 |
| 9628 Waldrop Dr SE | 0.74mi | 4/2.5 | 2,231 (-7%) | 6mo | $370,000 | $166 | 43 |
| 8722 Edgehill Dr | 0.73mi | 3/2.5 (-1) | 2,526 (+6%) | 7mo | $280,000 | $111 | 40 |
| 8603 Hickory Hill Ln | 0.60mi | 3/3.0 (-1) | 2,138 (-11%) | 4mo | $439,000 | $205 | 38 |
Match score weights: distance 35% · size 25% · config 20% · recency 20%. Top-matched comps best support the ARV.
Projected returns pro-forma
-3.0% appreciation · 3.72% rent growth · sell at horizon
- IRR
- -18.9%
- Equity multiple
- 0.34×
- Total profit
- $-48,409
- Equity at exit
- $38,767
- IRR
- -10.0%
- Equity multiple
- 0.37×
- Total profit
- $-45,967
- Equity at exit
- $22,480
Cash invested: $72,800 (down + closing). Projections, not guarantees.
Landlord ↔ Tenant lean methodology
- Overall (STATE)
- 90 Strongly Landlord-Friendly
- State Alabama
- 90 Strongly Landlord-Friendly · R+15
- County
- — inherits STATE
- City
- — inherits STATE
ZIP-level market 35803
- Home prices YoY
- -22.9%
- Rents YoY
- 3.7%
- Active inventory
- 280
- Price-to-rent
- 10.6×
Monthly cashflow live
- Estimated rent
- $2,043 high interval (Pro) →
- Mortgage (P&I)
- −$1,363
- Tax from tax record
- −$264 /mo · $3,170/yr
- Insurance
- −$108
- HOA
- −$0
- Vacancy / Maint / Mgmt
- −$429
- Net cashflow
- $-122
Break-even live
UW: 25.0% down · 7.5% · 30yr · 1.5% tax · 5.0% vac · 8.0% maint · 8.0% mgmt
Financing live
Cash to close
- Down payment
- $65,000
- Closing costs
- $7,800
- Reserves months
- —
- Total cash needed
- —
Loan-product check · same deal, 3 products live
Conventional
25% down · 7.5% · 30yr
- Down + closing
- —
- Monthly P&I
- —
- Monthly cashflow
- —
- DSCR
- —
- Eligible?
- —
Personal DTI + credit; lowest rate.
DSCR
20% down · 8.5% · 30yr
- Down + closing
- —
- Monthly P&I
- —
- Monthly cashflow
- —
- DSCR
- —
- Eligible?
- —
No personal income docs; deal must DSCR.
Hard money
10% down · 12.0% · 12mo
- Down + closing
- —
- Monthly P&I
- —
- Monthly cashflow
- —
- DSCR
- —
- Eligible?
- —
Short-term bridge; refi at stabilization.
Rent comps 15 comps
| Address | Beds | Baths | Sqft | Rent | $/sqft | DOM | Units | Dist |
|---|---|---|---|---|---|---|---|---|
| 10007 Camille Dr SE Huntsville, AL | 3.0 | 2.5 | 1702 | $1,781 | $1.05 | 23d | 1 | 0.36mi |
| 11207 Crestfield Dr SE Huntsville, AL | 5.0 | 2.5 | 2700 | $1,898 | $0.70 | 43d | 1 | 0.40mi |
| 11406 Crestfield Dr SE Huntsville, AL | 3.0 | 1.5 | 1809 | $1,750 | $0.97 | 23d | 1 | 0.66mi |
| 107 Strong Ct SE Huntsville, AL | 3.0 | 2.0 | 1995 | $1,775 | $0.89 | 13d | 1 | 0.74mi |
| 9802 Dolphin Dr SE Huntsville, AL | 4.0 | 2.0 | 2160 | $2,175 | $1.01 | 43d | 1 | 0.75mi |
| 8613 Camille Dr SE Huntsville, AL | 3.0 | 2.0 | 1744 | $2,100 | $1.20 | 13d | 1 | 0.78mi |
| 8711 Edgehill Dr SE Huntsville, AL | 3.0 | 2.5 | 2263 | $2,250 | $0.99 | 43d | 1 | 0.82mi |
| 1925 Lynnbrook Dr SW Huntsville, AL | 4.0 | 2.5 | 2003 | $1,900 | $0.95 | 43d | 1 | 1.04mi |
| 12005 Greenleaf Dr SE Huntsville, AL | 4.0 | 3.0 | 2150 | $2,500 | $1.16 | 43d | 1 | 1.06mi |
| 12027 Chicamauga Trl SE Huntsville, AL | 4.0 | 2.0 | 1870 | $1,700 | $0.91 | 43d | 1 | 1.07mi |
| 710 Mountain Gap Rd SE Huntsville, AL | 4.0 | 2.0 | 1801 | $1,750 | $0.97 | 43d | 1 | 1.09mi |
| 2105 Manassas Dr SW Huntsville, AL | 3.0 | 2.0 | 1920 | $1,895 | $0.99 | 43d | 1 | 1.20mi |
| 12107 Greenleaf Dr SE Huntsville, AL | 3.0 | 2.0 | 1600 | $1,500 | $0.94 | 13d | 1 | 1.30mi |
| 8033 Navios Dr SE Huntsville, AL | 5.0 | 3.5 | 3134 | $2,400 | $0.77 | 23d | 1 | 1.35mi |
| 2107 Edinburgh Dr SW Huntsville, AL | 4.0 | 2.0 | 2256 | $2,275 | $1.01 | 43d | 1 | 1.38mi |
Listing history 3 events
-
2026-04-30status Pending
-
2026-04-30$260,000 Active
-
2009-10-19soldstatus $190,062
ⓘ Source: listings_history table (triggers on properties + properties_extension) + one-shot
backfill from property_details.listing_events for pre-trigger history.
Tax reassessment forecast AL · Resets to sale price
- Current annual tax
- $3,170 · $264/mo
- Projected year-2 tax
- $3,170 · $264/mo
- Expected delta
- $0/yr ($0/mo · 0.0%)
ⓘ Screening estimate from a state-policy table — verify with the county assessor before closing.
Climate risk First Street
- Flood 1/10 Low FEMA zone X (unshaded) · 0% chance over 30 yrs
- Wildfire 1/10 Low
- Heat 6/10 Major 7 d/yr ≥104°F today · 20 d/yr by 30 yrs out
- Wind 4/10 Moderate 22% chance of damaging wind over 30 yrs
- Air quality 2/10 Low 1 unhealthy d/yr today · 2 by 30 yrs out
Nearby sold comps map
Loading sold comps map…
Walkable amenities ~0.75 mi
Loading nearby amenities…
Taxation est. · year 1
- Rental income
- $24,518
- − Mortgage interest
- −$14,564
- − Property taxes
- −$3,170
- − Insurance
- −$1,300
- − Repairs & maintenance
- −$1,961
- − Management
- −$1,961
- − Depreciation
- −$7,564
- Taxable loss
- −$6,003
- Est. tax savings @ 24.0%
- +$1,441
- After-tax cash flow
- $-22/yr
For passive investors: Depreciation is non-cash, so a rental often shows a tax loss while cash-flowing — sheltering income. Rental losses are passive: they offset passive income freely, and up to $25,000/yr can offset ordinary (W-2) income if you actively participate and your MAGI is under $100k (phasing out to $0 by $150k); unused losses carry forward. On sale, claimed depreciation is recaptured at up to 25%, and gains may owe capital-gains tax (a 1031 exchange can defer both). Figures are a year-1 estimate at your 24.0% rate — not tax advice; consult a CPA.
Schools (NCES district)
- District
- Huntsville City
- NCES district ID
- 0101800
- Math proficiency
- 21% ▼ -23.00%
- Reading proficiency
- 46% ▬ 0.00%
- Median HH income
- $48,264
- Composite
- 28.84/100
- National rank
- #6647
- State rank
- #48 of 129 in AL
Livability — Huntsville
- Score
- 82/100
- State rank
- #3
- US rank
- #1082
Category grades
Schools grade is shown separately in the Schools card above.
Census & demographics
- Census place
- Huntsville, AL
- County
- Madison County · 380,832 people
- City population
- 220,435
- Metro
- Huntsville, AL
- Population (ZIP)
- 29,197
- Household income
- $100,846
- Rent vs Own
- Severe rent burden
- 411.0
Population outlook (Madison County) Hauer SSP2
- Today (2025)
- 392,086 people
- By 2030
- 409,788 · +4.5%
- By 2040
- 440,557 · +12.4%
- By 2050
- 460,990 · +17.6%
- By 2075
- 502,872 · +28.3%
- By 2100
- 513,623 · +31.0%
Race, ethnicity, and origin ACS 2023
- Neighborhood character
- Predominantly White (82%)
- Race & ethnicity
- White 82% Hispanic / Latino 7% Two or more races 7% Black 4% Asian 3%
- Hispanic origin (detail)
- Mexican 4% Puerto Rican 1%
- Common ancestry
- Slovak 3% Italian 2% Lithuanian 2%
- Foreign-born
- 6% · Canada, China, South Korea
- Languages at home
- 92% English-only · Spanish 3% Chinese 2% German/W. Germanic 1%
Political lean MEDSL · Madison
- 2024 margin
- Lean R (+9.0) · D 44.7% · R 53.7% · Other 1.6%
- 2008→2024 swing
- +6.0pp toward D · 2008: -14.9pp · 2024: -9.0pp
- All cycles
- 2024: R+9.0 2020: R+8.0 2016: R+16.8 2012: R+18.7 2008: R+14.9
Not yet ingested
- Civics
- —
Market trends
- HPI YoY
- ▼ -110.53%
- Current HPI
- 372.1842
- Rent YoY
- ▲ 3.72%
- Metro
- Huntsville, AL
- State GDP YoY
- ▲ 2.94%
- F500 in state
- 4
Industry mix (Fortune 500 HQ in AL)
| Industry | F500 HQs | Revenue |
|---|---|---|
| Financial Services | 1 | $8B |
|
||
| Healthcare | 1 | $5B |
|
||
Price history
+36.8% since first listed3 events — show timeline
- 2026-04-30 Pending — VMLS
- 2026-04-30 Listed $260,000 VMLS
- 2009-10-19 Sold (Public Records) $190,062 Public Records
Property tax history
+13.8%/yrLatest (2024): $3,170 · +6.6% YoY. Source: county tax records.
Cash-flow waterfall
monthlySold comps — $/sqft
last 12 mo · ≤1 miLoading sold comps…