3014 Arcadia Ct · Augusta-Richmond County consolidated government (balance), GA
Flood risk 1/10 · Minimal
- FEMA flood zone
- X (unshaded)
- Chance of flooding over 30 yrs
- 0.0%
- Est. flood insurance / yr
- $507 – $1,088
Fire risk 2/10 · Minimal
- Est. fire insurance / yr
- $963 – $1,789
Heat risk 7/10 · Major
- Hot days now (above 106°F)
- 7 days/yr
- Hot days in 30 yrs
- 17 days/yr
Wind risk 6/10 · Moderate
- Chance of severe wind over 30 yrs
- 68.0%
Air-quality risk 3/10 · Minor
- Unhealthy air days now
- 3 days/yr
- Unhealthy air days in 30 yrs
- 3 days/yr
Risk factors via First Street. Map © Google.
Why this score? — see what drove the C grade
The composite is a weighted blend of 9 inputs, each scored 0–100. Each bar is that input's sub-score; the figure is the points it added to the 100-point composite (weight × sub-score).
- Cash flow +21.4/30.0
- ARV discount +15.0/15.0
- DSCR +6.8/10.0
- 1% rule +5.3/10.0
- Livability +2.5/5.0
- Condition / age +2.5/5.0
- Rent growth +2.4/5.0
- Schools +1.3/10.0
- Appreciation +0.0/10.0
$115,000
🖨 Deal sheet 📄 Offer letter ✓ Due diligence
Listing remarks
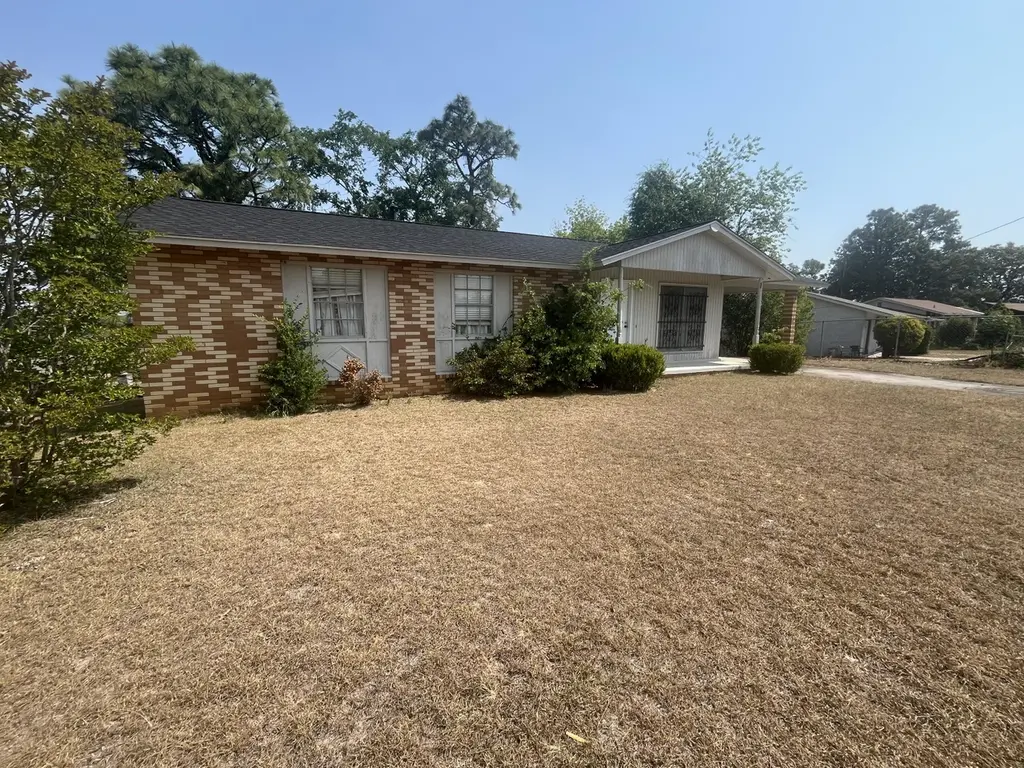
Investor Special with Tons of Potential! Don't miss this opportunity to transform a classic home into something truly special. This 3-bedroom, 1-bath property features original hardwood flooring throughout, offering a solid foundation for a charming renovation. A brand-new roof has already been installed, saving you on one of the big-ticket items. Inside, you'll find a separate dining room that adds character and flexibility to the layout--perfect for reimagining into a warm, inviting space. The home does not currently have central air and will need an HVAC system, making it ideal for investors or buyers looking to customize to their own specifications. With the right vision, this proper
Key facts
- Brand new roof
- Separate dining room
- 9,583 sq ft lot
Tags
Property features AI
Exterior
- Parking: Attached garage; Carport
- Utilities: Public water; Public sewer / sewer connected; Natural gas available; Water connected
- Home design: Single-family residence; One story; Entry level: 1
- Construction: Brick and wood siding exterior; Composition roof; Crawl space / no basement
- Exterior features: Patio; Front porch; Fenced yard; Cul-de-sac lot; Has view
Interior
- Kitchen: No specific kitchen appliance list provided
- Bedrooms: 6 total rooms (bedroom count not specified)
- Flooring: Ceramic tile; Hardwood
- Bathrooms: 1 full bathroom
- Heating & cooling: Forced air heating; Ceiling fan(s)
- Interior features: Other interior features; Gas water heater
- Laundry & utility: Washer hookup
Neighborhood map
What this means for you Summary
Snapshot
- This is a 3-bed/1.5-bath single-family listed at $115k.
Deal economics
- At list price, monthly cash flow is $171 ($2k/yr) — positive.
- The deal already cash-flows at list — no discount required.
- Meets the 1% rule at list price ($1k rent vs $115k).
- Recommended offer: $112k (3.0% below list) — sets the bar for market timing.
- Cap rate 8.1% vs local median 5.3% in Augusta-Richmond County consolidated government (balance) — top-decile yield for the area; either an underpriced asset or a hidden risk that comps aren't pricing in. Stress-test before assuming the spread holds.
Location & tenants
- Location reads: area grade C — affects rentability + tenant quality, not the cash-flow math above.
- Richmond County (urban): math 12% / reading 20% proficiency, ranked #154 of 174 in GA (top 88%) — low school quality limits family demand, transient renter base, plan for 1-2y turnover; 72% free/reduced lunch — lower-income household profile, screen leases tightly.
- Zoned schools: Glenn Hills Elementary School (math 2% / reading 8%, grade F, #1,160 of 1,228 statewide, top 98%, 393 students, 98% FRL); Glenn Hills Middle School (math 2% / reading 6%, grade F, #467 of 470 statewide, top 99%, 762 students, 98% FRL); Glenn Hills High School (math 2% / reading 2%, grade F, #421 of 424 statewide, top 100%, 883 students, 98% FRL) — zoned schools average 98% FRL vs 72% district-wide (26 pts higher); higher-poverty schools than district average — tighter screening recommended.
- Zoned-school proficiency averages 4% at this address vs 16% district-wide (-12 pts) — the specific schools serving this property underperform the Richmond County average; the district grade overstates school quality for this exact location.
- Market conditions: Rents soft (-0.2%/yr); 364 active listings in the ZIP; 22 comparable units currently listed for rent nearby; rentals at typical pace (median 24d on market — plan ~3-4 weeks tenant-placement turnaround); 45% of comp listings sitting > 30 days — soft ceiling on asking rent; 561 units permitted in Richmond County in 2024 (0 in 5+ unit buildings).
- This rent runs 31% of the median local income ($46k/yr) — at the standard rent-burdened threshold; future hikes will face affordability resistance.
Forward outlook
- Local home prices are declining (-3.0%/yr); year-one equity from $795 of loan paydown is wiped out by about $3k of value loss. Plan a longer hold.
- Richmond County population projected to shrink 5% by 2050 — rents likely to lag national; underwrite the cash flow, not the appreciation.
Negotiation context
- It's been on market 38 days — a 3% lower offer ($112k) is reasonable based on typical stale-listing flexibility.
- 2 sale attempts with the ask held roughly flat each time — persistent listings suggest the price (not the market) is what's stuck; bring a comps-based counter.
Risks & watch-outs
- Climate carrying-cost: major wind risk, 68% chance of damaging wind over 30y; extreme-heat days projected 7→17/yr by 2055 (HVAC capex compounding) — expect insurance premiums to compound above CPI over the hold.
Questions for the listing agent
- It's been on market 38 days. Have you received any prior offers? Is the seller open to a 3% concession, seller financing, or rate buy-down credit?
- Built in 1965 — when were the roof, HVAC, electrical panel, plumbing, and water heater last replaced?
- Is there a deadline driving the sale (1031 exchange, divorce, estate, relocation)? That informs how much negotiation room exists.
- What's the average days-on-market for RENTAL listings here right now (not sales)? A rising rental-DOM trend means longer vacancies and softer asking-rent achievability than the comps imply.
- What's the recent tenant-quality profile in this submarket — average credit score on applications, eviction rate, late-payment / NSF rate, and stable-employment percentage? A property-management company in the area should have these aggregated.
- How much new for-sale + rental construction is in the pipeline within 1–3 miles? Heavy new supply typically softens prices + rents 12–24 months out; constrained supply supports both.
Investment metrics
- 1% rule
- 1.03% ✓
- Cap rate
- 8.08%
- Cash-on-cash
- 6.38%
- DSCR
- 1.28
- GRM
- 8.1
CMA / ARV
- ARV (median comp)
- $157,111
- List price
- $115,000
- Delta
- -26.80%
- Verdict
- UNDERPRICED
- Comps
- 20 within 1.0 mi
Show comp detail 12 sales within ~0.75 mi
| Address | Dist | Beds/Ba | Sqft | Sold | Price | $/sf | Match |
|---|---|---|---|---|---|---|---|
| 2048 Signal Hill Ct Lot 27 | 0.37mi | 3/2.0 | 1,256 (+4%) | 1mo | $246,930 | $197 | 73 |
| 2059 Signal Hill Ct | 0.33mi | 3/2.0 | 1,256 (+4%) | 3mo | $245,930 | $196 | 73 |
| 2064 Signal Hill Ct | 0.32mi | 3/2.0 | 1,256 (+4%) | 4mo | $262,864 | $209 | 73 |
| 2040 Signal Hill Ct | 0.39mi | 3/2.0 | 1,256 (+4%) | 3mo | $247,430 | $197 | 71 |
| 2056 Signal Hill Ct | 0.36mi | 3/2.0 | 1,256 (+4%) | 5mo | $251,873 | $201 | 71 |
| 1048 Richland Crk Dr | 0.46mi | 3/2.0 | 1,256 (+4%) | 4mo | $245,430 | $195 | 66 |
| 1041 Richland Creek Dr | 0.52mi | 3/2.0 | 1,184 (-2%) | 6mo | $234,800 | $198 | 66 |
| 1049 Richland Creek Dr | 0.49mi | 3/2.0 | 1,256 (+4%) | 6mo | $246,500 | $196 | 64 |
| 1033 Richland Creek Dr | 0.52mi | 3/2.0 | 1,256 (+4%) | 6mo | $246,500 | $196 | 63 |
| 3056 Griggs Ct | 0.31mi | 3/2.0 | 1,360 (+12%) | 6mo | $154,000 | $113 | 57 |
| 3103 Fir Ct | 0.58mi | 3/1.5 | 1,122 (-7%) | 5mo | $82,500 | $74 | 57 |
| 2355 Golden Camp Rd | 0.59mi | 4/1.5 (+1) | 1,080 (-11%) | 5mo | $128,000 | $119 | 45 |
Match score weights: distance 35% · size 25% · config 20% · recency 20%. Top-matched comps best support the ARV.
Projected returns pro-forma
-3.0% appreciation · 0.0% rent growth · sell at horizon
- IRR
- -9.8%
- Equity multiple
- 0.65×
- Total profit
- $-11,208
- Equity at exit
- $17,147
- IRR
- -5.0%
- Equity multiple
- 0.72×
- Total profit
- $-9,156
- Equity at exit
- $9,943
Cash invested: $32,200 (down + closing). Projections, not guarantees.
Landlord ↔ Tenant lean methodology
- Overall (STATE)
- 90 Strongly Landlord-Friendly
- State Georgia
- 90 Strongly Landlord-Friendly · R+3
- County
- — inherits STATE
- City
- — inherits STATE
ZIP-level market 30906
- Home prices YoY
- -21.6%
- Rents YoY
- -0.2%
- Active inventory
- 364
- Price-to-rent
- 8.1×
Monthly cashflow live
- Estimated rent
- $1,186 high interval (Pro) →
- Mortgage (P&I)
- −$603
- Tax from tax record
- −$115 /mo · $1,381/yr
- Insurance
- −$48
- HOA
- −$0
- Vacancy / Maint / Mgmt
- −$249
- Net cashflow
- $171
Break-even live
UW: 25.0% down · 7.5% · 30yr · 1.5% tax · 5.0% vac · 8.0% maint · 8.0% mgmt
Financing live
Cash to close
- Down payment
- $28,750
- Closing costs
- $3,450
- Reserves months
- —
- Total cash needed
- —
Loan-product check · same deal, 3 products live
Conventional
25% down · 7.5% · 30yr
- Down + closing
- —
- Monthly P&I
- —
- Monthly cashflow
- —
- DSCR
- —
- Eligible?
- —
Personal DTI + credit; lowest rate.
DSCR
20% down · 8.5% · 30yr
- Down + closing
- —
- Monthly P&I
- —
- Monthly cashflow
- —
- DSCR
- —
- Eligible?
- —
No personal income docs; deal must DSCR.
Hard money
10% down · 12.0% · 12mo
- Down + closing
- —
- Monthly P&I
- —
- Monthly cashflow
- —
- DSCR
- —
- Eligible?
- —
Short-term bridge; refi at stabilization.
Rent comps 22 comps
| Address | Beds | Baths | Sqft | Rent | $/sqft | DOM | Units | Dist |
|---|---|---|---|---|---|---|---|---|
| 3126 Arcadia Dr Unit B Augusta, GA | 2.0 | 1.0 | 748 | $895 | $1.20 | 23d | 1 | 0.19mi |
| 3126 Arcadia Dr Unit B Augusta, GA | 2.0 | 1.0 | 748 | $1,025 | $1.37 | 44d | 1 | 0.19mi |
| 2830 Lumpkin Rd Unit A Augusta, GA | 3.0 | 1.5 | 1000 | $900 | $0.90 | 23d | 1 | 0.26mi |
| 3012 Pinewood Dr Augusta, GA | 3.0 | 2.0 | 1465 | $1,100 | $0.75 | 44d | 1 | 0.95mi |
| 3018 Acorn Rd Augusta, GA | 2.0 | 1.0 | 962 | $1,115 | $1.16 | 23d | 1 | 1.03mi |
| 2544 Dover St Unit 2544 Augusta, GA | 3.0 | 1.0 | 888 | $900 | $1.01 | 44d | 1 | 1.17mi |
| 3412 Kensington Dr N Augusta, GA | 3.0 | 2.0 | 1225 | $1,350 | $1.10 | 23d | 1 | 1.28mi |
| 2851 Rocky Creek Rd Augusta, GA | 2.0 | 1.0 | 1171 | $1,100 | $0.94 | 44d | 1 | 1.32mi |
| 2851 Rocky Creek Rd Augusta, GA | 2.0 | 1.0 | 1171 | $1,100 | $0.94 | 23d | 1 | 1.32mi |
| 1500 Champions Pines Ln Augusta, GA | 1.0–2.0 | 1.0–2.0 | 825 | $1,140 | $1.38 | 23d | 14 | 1.35mi |
| 2708 Blossom Dr Unit B Augusta, GA | 2.0 | 1.5 | 896 | $950 | $1.06 | 44d | 1 | 1.36mi |
| 1924 N Leg Rd Augusta, GA | 1.0–2.0 | 1.0 | 939 | $1,050 | $1.12 | 23d | 3 | 1.36mi |
| 2818 Gordy Rd Augusta, GA | 2.0 | 1.0 | 888 | $825 | $0.93 | 44d | 1 | 1.38mi |
| 2826 Thomas Ln Augusta, GA | 2.0 | 1.0 | 1456 | $1,095 | $0.75 | 44d | 1 | 1.39mi |
| 2826 Thomas Ln Augusta, GA | 2.0 | 1.0 | 1456 | $1,095 | $0.75 | 23d | 1 | 1.39mi |
| 2824 Thomas Ln Augusta, GA | 2.0 | 2.0 | 960 | $950 | $0.99 | 44d | 1 | 1.40mi |
| 3200 Deans Bridge Rd Augusta, GA | 1.0–4.0 | 1.0–1.5 | 1075 | $970 | $0.90 | 23d | 6 | 1.43mi |
| 101 Little Rock Dr Augusta, GA | 2.0 | 2.0 | 1031 | $1,690 | $1.64 | 44d | 1 | 1.43mi |
| 2820 Thomas Ln Augusta, GA | 2.0 | 2.0 | 960 | $950 | $0.99 | 44d | 1 | 1.43mi |
| 255 Reservation Way Augusta, GA | 2.0 | 2.0 | 1170 | $1,440 | $1.23 | 21d | 15 | 1.44mi |
| 2663 Thomas Ln Augusta, GA | 2.0–3.0 | 2.0–2.5 | 1250 | $1,446 | $1.16 | 23d | 3 | 1.46mi |
| 2816 Thomas Ln Augusta, GA | 2.0 | 2.0 | 960 | $950 | $0.99 | 14d | 1 | 1.46mi |
Listing history 17 events
-
2026-06-18days on market $115,000 Active 38 DOM
-
2026-06-17days on market $115,000 Active 37 DOM
-
2026-06-16days on market $115,000 Active 36 DOM
-
2026-06-15days on market $115,000 Active 35 DOM
-
2026-06-14days on market $115,000 Active 33 DOM
-
2026-06-10days on market $115,000 Active 30 DOM
-
2026-06-09days on market $115,000 Active 29 DOM
-
2026-06-08days on market $115,000 Active 28 DOM
-
2026-06-07days on market $115,000 Active 27 DOM
-
2026-06-03days on market $115,000 Active 23 DOM
-
2026-06-02days on market $115,000 Active 22 DOM
-
2026-06-01days on market $115,000 Active 21 DOM
-
2026-05-31days on market $115,000 Active 20 DOM
-
2026-05-30days on market $115,000 Active 19 DOM
-
2026-05-11historical
-
2026-04-24$115,000 Active
-
2026-04-24$115,000 Active 849-char remark
ⓘ Source: listings_history table (triggers on properties + properties_extension) + one-shot
backfill from property_details.listing_events for pre-trigger history.
Tax reassessment forecast GA · Resets to sale price
- Current annual tax
- $1,381 · $115/mo
- Projected year-2 tax
- $1,381 · $115/mo
- Expected delta
- $0/yr ($0/mo · 0.0%)
ⓘ Screening estimate from a state-policy table — verify with the county assessor before closing.
Climate risk First Street
- Flood 1/10 Low FEMA zone X (unshaded) · 0% chance over 30 yrs
- Wildfire 2/10 Low
- Heat 7/10 Severe 7 d/yr ≥106°F today · 17 d/yr by 30 yrs out
- Wind 6/10 Major 68% chance of damaging wind over 30 yrs
- Air quality 3/10 Moderate 3 unhealthy d/yr today · 3 by 30 yrs out
Nearby sold comps map
Loading sold comps map…
Walkable amenities ~0.75 mi
Loading nearby amenities…
Taxation est. · year 1
- Rental income
- $14,237
- − Mortgage interest
- −$6,442
- − Property taxes
- −$1,381
- − Insurance
- −$575
- − Repairs & maintenance
- −$1,139
- − Management
- −$1,139
- − Depreciation
- −$3,345
- Taxable income
- $216
- Est. tax owed @ 24.0%
- −$52
- After-tax cash flow
- $2,003/yr
For passive investors: Depreciation is non-cash, so a rental often shows a tax loss while cash-flowing — sheltering income. Rental losses are passive: they offset passive income freely, and up to $25,000/yr can offset ordinary (W-2) income if you actively participate and your MAGI is under $100k (phasing out to $0 by $150k); unused losses carry forward. On sale, claimed depreciation is recaptured at up to 25%, and gains may owe capital-gains tax (a 1031 exchange can defer both). Figures are a year-1 estimate at your 24.0% rate — not tax advice; consult a CPA.
Schools (NCES district)
- District
- Richmond County
- NCES district ID
- 1304380
- Math proficiency
- 12% ▼ -9.00%
- Reading proficiency
- 20% ▼ -6.00%
- Median HH income
- $38,069
- Composite
- 13.43/100
- National rank
- #9524
- State rank
- #154 of 174 in GA
Livability — Augusta-Richmond County consolidated government (balance)
No livability data for this city. (Only ~50 U.S. cities are tracked.)
Census & demographics
- Census place
- Augusta-Richmond County consolidated government (balance), GA
- County
- Richmond County · 190,917 people
- City population
- 154,035
- Metro
- Augusta-Richmond County, GA-SC
- Population (ZIP)
- 60,423
- Household income
- $45,999
- Rent vs Own
- Severe rent burden
- 3363.0
Population outlook (Richmond County) Hauer SSP2
- Today (2025)
- 200,753 people
- By 2030
- 200,232 · -0.3%
- By 2040
- 196,813 · -2.0%
- By 2050
- 190,347 · -5.2%
- By 2075
- 172,496 · -14.1%
- By 2100
- 146,284 · -27.1%
Race, ethnicity, and origin ACS 2023
- Neighborhood character
- Majority Black (64%)
- Race & ethnicity
- Black 64% White 27% Two or more races 5% Hispanic / Latino 5%
- Common ancestry
- Lithuanian 1%
- Foreign-born
- 2% · Canada
- Languages at home
- 95% English-only · Spanish 3% German/W. Germanic 1%
Political lean MEDSL · Richmond
- 2024 margin
- Solid D (+36.1) · D 67.8% · R 31.7%
- 2008→2024 swing
- +4.3pp toward D · 2008: 31.8pp · 2024: 36.1pp
- All cycles
- 2024: D+36.1 2020: D+37.2 2016: D+32.4 2012: D+33.8 2008: D+31.8
Not yet ingested
- Civics
- —
Market trends
- HPI YoY
- ▼ -58.99%
- Current HPI
- 213.5733
- Rent YoY
- ▼ -0.25%
- Metro
- Augusta-Richmond County, GA-SC
- State GDP YoY
- ▲ 2.66%
- F500 in state
- 28
Industry mix (Fortune 500 HQ in GA)
| Industry | F500 HQs | Revenue |
|---|---|---|
| Paper / Packaging | 2 | $29B |
|
||
| Retail | 1 | $160B |
|
||
| Transportation / Logistics | 1 | $91B |
|
||
| Airlines | 1 | $62B |
|
||
| Consumer Goods | 1 | $47B |
|
||
| Utilities | 1 | $25B |
|
||
Price history
+0.0% since first listed3 events — show timeline
- 2026-05-11 Listing Removed — Hive MLS
- 2026-04-24 Listed $115,000 Hive MLS
- 2026-04-24 Listed $115,000 Hive MLS
Property tax history
+9.5%/yrLatest (2025): $1,381 · +9.1% YoY. Source: county tax records.
Cash-flow waterfall
monthlySold comps — $/sqft
last 12 mo · ≤1 miLoading sold comps…