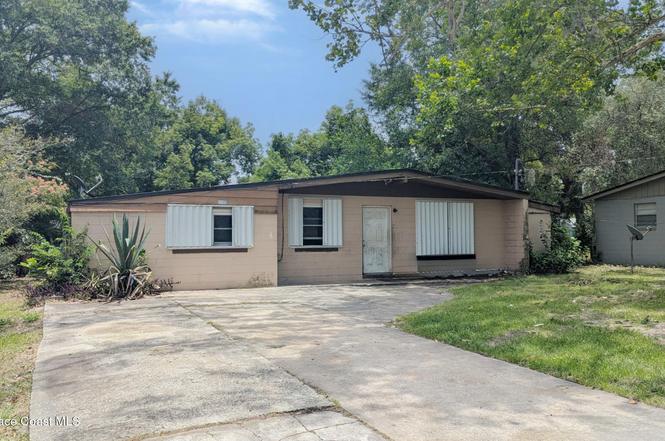
9211 Greenleaf Rd · Jacksonville, FL
Flood risk 1/10 · Minimal
- FEMA flood zone
- X (unshaded)
- Chance of flooding over 30 yrs
- 0.0%
- Est. flood insurance / yr
- $507 – $1,088
Fire risk 3/10 · Minor
- Est. fire insurance / yr
- $947 – $1,759
Heat risk 9/10 · Severe
- Hot days now (above 107°F)
- 7 days/yr
- Hot days in 30 yrs
- 20 days/yr
Wind risk 9/10 · Severe
- Chance of severe wind over 30 yrs
- 99.0%
Air-quality risk 4/10 · Minor
- Unhealthy air days now
- 6 days/yr
- Unhealthy air days in 30 yrs
- 6 days/yr
Risk factors via First Street. Map © Google.
Why this score? — see what drove the B grade
The composite is a weighted blend of 9 inputs, each scored 0–100. Each bar is that input's sub-score; the figure is the points it added to the 100-point composite (weight × sub-score).
- Cash flow +30.0/30.0
- 1% rule +10.0/10.0
- DSCR +10.0/10.0
- ARV discount +7.5/15.0
- Livability +4.2/5.0
- Schools +3.9/10.0
- Condition / age +2.5/5.0
- Rent growth +2.2/5.0
- Appreciation +0.0/10.0
$64,900
🖨 Deal sheet 📄 Offer letter ✓ Due diligence
Listing remarks
This property has been placed in an upcoming event. All bids should be submitted at Xome.com void where prohibited. Please submit any pre-auction offer received through the property details page on Xome.com. Any post-auction offers will need to be submitted directly to the listing agent. Response within 3 business days. All properties are subject to a buyer s premium pursuant to the Auction Participation Agreement and Terms & Conditions minimums will apply.
Key facts
- 9,316 sq ft lot
- Built 1959
- Listed 8 days
Property features AI
Finance
- Other: Pets allowed: cats and dogs
Exterior
- Parking: Off-street parking
- Utilities: Public sewer; Cable available; Water connected
- Home design: Single-family residence; One level (entry level 1); Faces west
- Construction: Block construction
- Exterior features: Back yard with chain link fencing; Shingle roof
Interior
- Kitchen: Electric oven
- Bedrooms: Three bedrooms (all on the first floor)
- Flooring: Vinyl flooring
- Bathrooms: One full bathroom
- Heating & cooling: Central heating (electric); Central air conditioning
- Interior features: Seven total rooms; Storm shutters
- Laundry & utility: Electric dryer hookup on the lower level
Neighborhood map
What this means for you Summary
Snapshot
- This is a 3-bed/1.0-bath single-family listed at $65k.
Deal economics
- At list price, monthly cash flow is $842 ($10k/yr) — positive.
- The deal already cash-flows at list — no discount required.
- Meets the 1% rule at list price ($2k rent vs $65k).
- Cap rate 21.9% vs local median 4.0% in Jacksonville — top-decile yield for the area; either an underpriced asset or a hidden risk that comps aren't pricing in. Stress-test before assuming the spread holds.
Location & tenants
- Location reads 83/100 on livability (#50 in FL, #911 nationally) — a professional / high-income tenant draw. Strengths: amenities A+, commute A+, housing A+.
- Duval (urban): math 46% / reading 45% proficiency, ranked #48 of 73 in FL (top 66%) — families likely to look elsewhere, expect single-tenant / working-renter base with shorter leases.
- Zoned schools: Rutledge H. Pearson Elementary School (math 62% / reading 42%, grade C-, #990 of 2,144 statewide, top 48%, 201 students, 86% FRL); Jean Ribault Middle School (math 28% / reading 24%, grade F, #506 of 571 statewide, top 89%, 679 students, 78% FRL); Jean Ribault High School (math 22% / reading 25%, grade F, #533 of 667 statewide, top 80%, 1,385 students, 71% FRL) — zoned schools average 78% FRL vs 49% district-wide (29 pts higher); higher-poverty schools than district average — tighter screening recommended.
- Market conditions: Rents soft (-1.4%/yr); 291 active listings in the ZIP; 20 comparable units currently listed for rent nearby; rentals at typical pace (median 17d on market — plan ~3-4 weeks tenant-placement turnaround); lower-income renter base — watch delinquency; 6,503 units permitted in Duval County in 2024 (1,131 in 5+ unit buildings).
- At $1,631/mo this rent would consume 47% of the median local household income ($41k/yr) (locally 1765% of renters already pay >50% of income on rent) — very limited rent-growth headroom before tenants either downsize or default.
Forward outlook
- Local home prices are declining (-3.0%/yr); year-one equity from $449 of loan paydown is wiped out by about $2k of value loss. Plan a longer hold.
- Duval County population projected at +19% by 2050 — long-run rental-demand tailwind backs the buy-and-hold thesis.
- At projected returns (-3.0% appreciation + 0.0% rent growth), your $18k cash investment doubles in ~3 years — after that, you're playing with house money.
Negotiation context
- Only 8 days on market — expect competitive offers; lowballing is unlikely to land.
- 2 sale attempts with the ask held roughly flat each time — persistent listings suggest the price (not the market) is what's stuck; bring a comps-based counter.
Risks & watch-outs
- Watch-outs: built in 1959 — expect roof / HVAC / electrical / plumbing capex.
- Climate carrying-cost: severe wind risk, 99% chance of damaging wind over 30y; extreme-heat days projected 7→20/yr by 2055 (HVAC capex compounding) — expect insurance premiums to compound above CPI over the hold.
Questions for the listing agent
- Built in 1959 — when were the roof, HVAC, electrical panel, plumbing, and water heater last replaced?
- Is there a deadline driving the sale (1031 exchange, divorce, estate, relocation)? That informs how much negotiation room exists.
- Schools are B-rated — typically a magnet for longer-tenancy family renters. What's the average tenant stay here, and is there a school-zone premium baked into asking?
- What's the average days-on-market for RENTAL listings here right now (not sales)? A rising rental-DOM trend means longer vacancies and softer asking-rent achievability than the comps imply.
- What's the recent tenant-quality profile in this submarket — average credit score on applications, eviction rate, late-payment / NSF rate, and stable-employment percentage? A property-management company in the area should have these aggregated.
- How much new for-sale + rental construction is in the pipeline within 1–3 miles? Heavy new supply typically softens prices + rents 12–24 months out; constrained supply supports both.
Investment metrics
- 1% rule
- 2.51% ✓
- Cap rate
- 21.86%
- Cash-on-cash
- 55.61%
- DSCR
- 3.47
- GRM
- 3.3
CMA / ARV
- ARV (on-the-fly)
- $186,172
- Comps found
- 12
Show comp detail 12 sales within ~0.75 mi
| Address | Dist | Beds/Ba | Sqft | Sold | Price | $/sf | Match |
|---|---|---|---|---|---|---|---|
| 9019 Greenleaf Rd | 0.14mi | 4/2.0 (+1) | 1,631 (-4%) | 4mo | $255,000 | $156 | 74 |
| 9035 Devonshire Blvd Blvd | 0.20mi | 3/2.0 | 1,550 (-9%) | 2mo | $130,000 | $84 | 70 |
| 7924 Longspur Ave | 0.34mi | 3/1.0 | 1,582 (-7%) | 5mo | $58,000 | $37 | 68 |
| 8422 Gullege Dr | 0.22mi | 4/2.0 (+1) | 1,617 (-5%) | 11mo | $117,000 | $72 | 63 |
| 5211 Arrowsmith Rd | 0.72mi | 3/1.5 | 1,664 (-3%) | 3mo | $165,000 | $99 | 58 |
| 4872 Clyde Dr | 0.52mi | 3/1.0 | 1,592 (-7%) | 8mo | $98,000 | $62 | 58 |
| 7836 Smart Ave | 0.50mi | 3/2.0 | 1,813 (+6%) | 7mo | $285,000 | $157 | 57 |
| 9408 Little John Rd | 0.43mi | 4/2.0 (+1) | 1,540 (-10%) | 9mo | $198,500 | $129 | 47 |
| 4815 Clyde Dr | 0.63mi | 4/2.0 (+1) | 1,790 (+5%) | 8mo | $195,000 | $109 | 47 |
| 5106 Roanoke Blvd | 0.37mi | 4/2.0 (+1) | 1,961 (+15%) | 7mo | $185,500 | $95 | 43 |
| 9547 Scadlocke Rd | 0.50mi | 4/2.0 (+1) | 1,907 (+12%) | 10mo | $210,000 | $110 | 40 |
| 9621 Aberdare Ave W | 0.74mi | 4/2.5 (+1) | 1,900 (+11%) | 3mo | $231,000 | $122 | 33 |
Match score weights: distance 35% · size 25% · config 20% · recency 20%. Top-matched comps best support the ARV.
Projected returns pro-forma
-3.0% appreciation · 0.0% rent growth · sell at horizon
- IRR
- 50.5%
- Equity multiple
- 3.11×
- Total profit
- $38,364
- Equity at exit
- $9,677
- IRR
- 54.7%
- Equity multiple
- 5.63×
- Total profit
- $84,094
- Equity at exit
- $5,611
Cash invested: $18,172 (down + closing). Projections, not guarantees.
Landlord ↔ Tenant lean methodology
- Overall (STATE)
- 87 Strongly Landlord-Friendly
- State Florida
- 87 Strongly Landlord-Friendly · R+3
- County
- — inherits STATE
- City
- — inherits STATE
ZIP-level market 32208
- Home prices YoY
- -33.6%
- Rents YoY
- -1.4%
- Active inventory
- 291
- Price-to-rent
- 3.3×
Monthly cashflow live
- Estimated rent
- $1,631 high interval (Pro) →
- Mortgage (P&I)
- −$340
- Tax from tax record
- −$79 /mo · $948/yr
- Insurance
- −$27
- HOA
- −$0
- Vacancy / Maint / Mgmt
- −$343
- Net cashflow
- $842
Break-even live
UW: 25.0% down · 7.5% · 30yr · 1.5% tax · 5.0% vac · 8.0% maint · 8.0% mgmt
Financing live
Cash to close
- Down payment
- $16,225
- Closing costs
- $1,947
- Reserves months
- —
- Total cash needed
- —
Loan-product check · same deal, 3 products live
Conventional
25% down · 7.5% · 30yr
- Down + closing
- —
- Monthly P&I
- —
- Monthly cashflow
- —
- DSCR
- —
- Eligible?
- —
Personal DTI + credit; lowest rate.
DSCR
20% down · 8.5% · 30yr
- Down + closing
- —
- Monthly P&I
- —
- Monthly cashflow
- —
- DSCR
- —
- Eligible?
- —
No personal income docs; deal must DSCR.
Hard money
10% down · 12.0% · 12mo
- Down + closing
- —
- Monthly P&I
- —
- Monthly cashflow
- —
- DSCR
- —
- Eligible?
- —
Short-term bridge; refi at stabilization.
Rent comps 20 comps
| Address | Beds | Baths | Sqft | Rent | $/sqft | DOM | Units | Dist |
|---|---|---|---|---|---|---|---|---|
| 8367 Tubman Ct Jacksonville, FL | 4.0 | 1.5 | 1398 | $1,790 | $1.28 | 17d | 1 | 0.20mi |
| 9340 Sibbald Rd Jacksonville, FL | 4.0 | 2.0 | 1228 | $1,606 | $1.31 | 4d | 1 | 0.28mi |
| 9504 Evesham Rd Jacksonville, FL | 4.0 | 2.0 | 1966 | $1,645 | $0.84 | 23d | 1 | 0.43mi |
| 4737 Portsmouth Ave Jacksonville, FL | 4.0 | 2.0 | 1396 | $1,148 | $0.82 | 23d | 1 | 0.49mi |
| 4895 Churchill Dr Jacksonville, FL | 3.0 | 2.0 | 1303 | $1,900 | $1.46 | 23d | 1 | 0.53mi |
| 8119 Siskin Ave Jacksonville, FL | 2.0 | 2.0 | 1102 | $1,650 | $1.50 | 23d | 1 | 0.57mi |
| 8119 Siskin Ave Jacksonville, FL | 2.0 | 2.0 | 1102 | $1,650 | $1.50 | 17d | 1 | 0.57mi |
| 4643 Williamsburg Ave Jacksonville, FL | 3.0 | 2.0 | 1209 | $1,496 | $1.24 | 3d | 1 | 0.63mi |
| 8036 Mattox Ave Jacksonville, FL | 4.0 | 2.0 | 1160 | $1,480 | $1.28 | 16d | 1 | 0.63mi |
| 8645 Samona Dr W Jacksonville, FL | 4.0 | 1.0 | 1196 | $1,250 | $1.05 | 23d | 1 | 0.64mi |
| 4662 Roanoke Blvd Jacksonville, FL | 3.0 | 2.0 | 1104 | $1,195 | $1.08 | 14d | 1 | 0.68mi |
| 4819 Arrowsmith Rd Unit 1 Jacksonville, FL | 3.0 | 2.0 | 1285 | $1,500 | $1.17 | 14d | 1 | 0.82mi |
| 8534 Addison Rd Jacksonville, FL | 4.0 | 2.0 | 1410 | $1,995 | $1.41 | 23d | 1 | 0.91mi |
| 8509 Addison Rd Jacksonville, FL | 4.0 | 2.0 | 1494 | $1,675 | $1.12 | 23d | 1 | 0.97mi |
| 8516 Bermuda Rd Jacksonville, FL | 3.0 | 2.0 | 1492 | $1,625 | $1.09 | 20d | 1 | 1.12mi |
| 3848 Soutel Dr Jacksonville, FL | 3.0 | 2.0 | 1230 | $1,541 | $1.25 | 7d | 1 | 1.20mi |
| 4910 Rhode Island Dr N Jacksonville, FL | 3.0 | 2.0 | 1300 | $1,696 | $1.30 | 23d | 1 | 1.28mi |
| 7860 Rondo Ave Jacksonville, FL | 3.0 | 2.0 | 1064 | $1,410 | $1.33 | 7d | 1 | 1.35mi |
| 6609 Miriam St Jacksonville, FL | 3.0 | 2.0 | 1200 | $1,425 | $1.19 | 7d | 1 | 1.39mi |
| 10373 Marsh Hawk Dr Jacksonville, FL | 3.0 | 2.0 | 1868 | $2,020 | $1.08 | 3d | 1 | 1.50mi |
Listing history 7 events
-
2026-06-18days on market $64,900 Active 8 DOM
-
2026-06-17days on market $64,900 Active 7 DOM
-
2026-06-16days on market $64,900 Active 6 DOM
-
2026-06-15days on market $64,900 Active 5 DOM
-
2026-06-13days on market $64,900 Active 3 DOM
-
2026-06-13remarks 463-char remark
-
2026-06-13$64,900 Active 2 DOM
ⓘ Source: listings_history table (triggers on properties + properties_extension) + one-shot
backfill from property_details.listing_events for pre-trigger history.
Tax reassessment forecast FL · Resets to sale price
- Current annual tax
- $948 · $79/mo
- Projected year-2 tax
- $948 · $79/mo
- Expected delta
- $0/yr ($0/mo · 0.0%)
ⓘ Screening estimate from a state-policy table — verify with the county assessor before closing.
Climate risk First Street
- Flood 1/10 Low FEMA zone X (unshaded) · 0% chance over 30 yrs
- Wildfire 3/10 Moderate
- Heat 9/10 Extreme 7 d/yr ≥107°F today · 20 d/yr by 30 yrs out
- Wind 9/10 Extreme 99% chance of damaging wind over 30 yrs
- Air quality 4/10 Moderate 6 unhealthy d/yr today · 6 by 30 yrs out
Nearby sold comps map
Loading sold comps map…
Walkable amenities ~0.75 mi
Loading nearby amenities…
Taxation est. · year 1
- Rental income
- $19,573
- − Mortgage interest
- −$3,635
- − Property taxes
- −$948
- − Insurance
- −$324
- − Repairs & maintenance
- −$1,566
- − Management
- −$1,566
- − Depreciation
- −$1,888
- Taxable income
- $9,645
- Est. tax owed @ 24.0%
- −$2,315
- After-tax cash flow
- $7,791/yr
For passive investors: Depreciation is non-cash, so a rental often shows a tax loss while cash-flowing — sheltering income. Rental losses are passive: they offset passive income freely, and up to $25,000/yr can offset ordinary (W-2) income if you actively participate and your MAGI is under $100k (phasing out to $0 by $150k); unused losses carry forward. On sale, claimed depreciation is recaptured at up to 25%, and gains may owe capital-gains tax (a 1031 exchange can defer both). Figures are a year-1 estimate at your 24.0% rate — not tax advice; consult a CPA.
Schools (NCES district)
- District
- Duval
- NCES district ID
- 1200480
- Math proficiency
- 46% ▼ -11.00%
- Reading proficiency
- 45% ▼ -4.00%
- Median HH income
- $48,987
- Composite
- 38.97/100
- National rank
- #4076
- State rank
- #48 of 73 in FL
Livability — Jacksonville
- Score
- 83/100
- State rank
- #50
- US rank
- #911
Category grades
Schools grade is shown separately in the Schools card above.
Census & demographics
- Census place
- Jacksonville, FL
- County
- Duval County · 1,015,274 people
- City population
- 979,034
- Metro
- Jacksonville, FL
- Population (ZIP)
- 32,699
- Household income
- $41,324
- Rent vs Own
- Severe rent burden
- 1765.0
Population outlook (Duval County) Hauer SSP2
- Today (2025)
- 1,013,010 people
- By 2030
- 1,059,228 · +4.6%
- By 2040
- 1,141,439 · +12.7%
- By 2050
- 1,205,258 · +19.0%
- By 2075
- 1,324,282 · +30.7%
- By 2100
- 1,319,620 · +30.3%
Race, ethnicity, and origin ACS 2023
- Neighborhood character
- Predominantly Black (77%)
- Race & ethnicity
- Black 77% White 16% Two or more races 4% Hispanic / Latino 3%
- Common ancestry
- Italian 1%
- Foreign-born
- 2% · Canada
- Languages at home
- 97% English-only · Spanish 2%
Political lean MEDSL · Duval
- 2024 margin
- Toss-up / Even · D 48.7% · R 50.1% · Other 1.2%
- 2008→2024 swing
- +0.4pp no change · 2008: -1.9pp · 2024: -1.5pp
- All cycles
- 2024: R+1.5 2020: D+3.8 2016: R+1.5 2012: R+3.6 2008: R+1.9
Not yet ingested
- Civics
- —
Market trends
- HPI YoY
- ▼ -110.56%
- Current HPI
- 217.9706
- Rent YoY
- ▼ -1.36%
- Metro
- Jacksonville, FL
- State GDP YoY
- ▲ 3.28%
- F500 in state
- 36
Industry mix (Fortune 500 HQ in FL)
| Industry | F500 HQs | Revenue |
|---|---|---|
| Industrial Technology | 2 | $29B |
|
||
| Insurance | 2 | $17B |
|
||
| Retail | 1 | $60B |
|
||
| Technology Distribution | 1 | $58B |
|
||
| Homebuilding | 1 | $35B |
|
||
| Technology Manufacturing | 1 | $35B |
|
||
Price history
+1198.0% since first listed2 events — show timeline
- 2026-06-10 Listed $64,900 SCMLS
- 2026-04-10 Listed $5,000 NFMLS
Property tax history
+2.5%/yrLatest (2025): $948 · +23.7% YoY. Source: county tax records.
Cash-flow waterfall
monthlySold comps — $/sqft
last 12 mo · ≤1 miLoading sold comps…