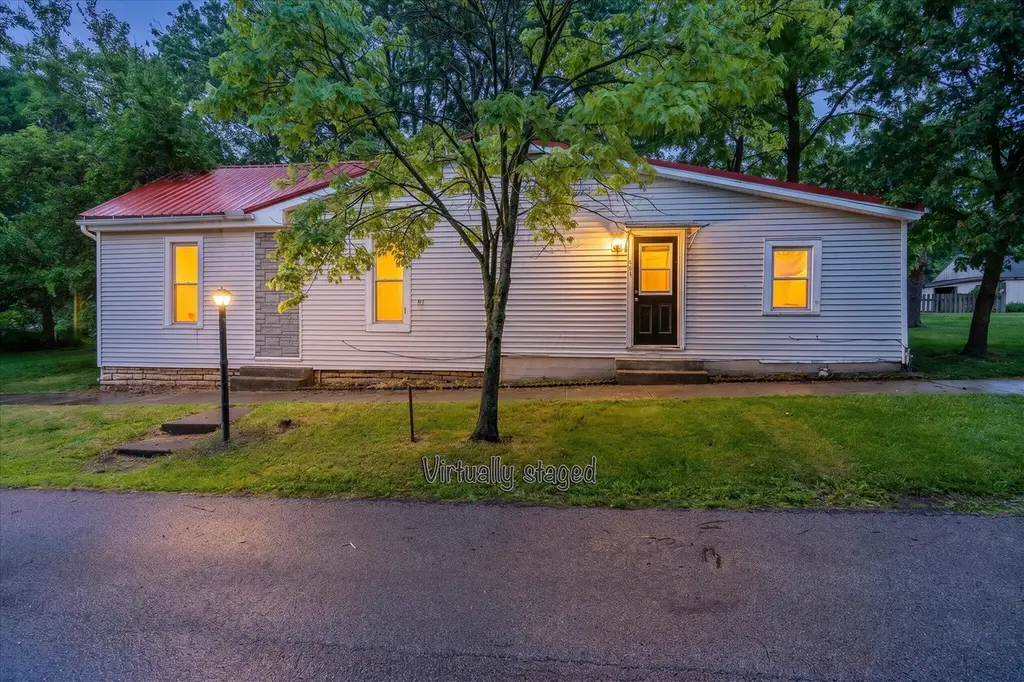
161 Bernard Rd · New Vienna, OH
Flood risk 1/10 · Minimal
- FEMA flood zone
- X (unshaded)
- Chance of flooding over 30 yrs
- 0.0%
- Est. flood insurance / yr
- $507 – $1,088
Fire risk 1/10 · Minimal
- Est. fire insurance / yr
- $713 – $1,323
Heat risk 3/10 · Minor
- Hot days now (above 98°F)
- 7 days/yr
- Hot days in 30 yrs
- 18 days/yr
Wind risk 2/10 · Minimal
- Chance of severe wind over 30 yrs
- 1.0%
Air-quality risk 3/10 · Minor
- Unhealthy air days now
- 2 days/yr
- Unhealthy air days in 30 yrs
- 3 days/yr
Risk factors via First Street. Map © Google.
Why this score? — see what drove the C- grade
The composite is a weighted blend of 9 inputs, each scored 0–100. Each bar is that input's sub-score; the figure is the points it added to the 100-point composite (weight × sub-score).
- Cash flow +15.7/30.0
- ARV discount +15.0/15.0
- DSCR +4.8/10.0
- Schools +3.9/10.0
- Livability +3.4/5.0
- 1% rule +3.1/10.0
- Rent growth +2.5/5.0
- Condition / age +2.5/5.0
- Appreciation +1.6/10.0
$149,900
🖨 Deal sheet (PDF) 📄 Offer letter ✓ Due diligence
Listing remarks MLS
This is a Fannie Mae HomePath property. Nice 1 car detached garage. Large rooms in property and public water & sewer. Close by June 30, 2011 and request up to 3.5% of the final sales price for closing cost assistance! Click for more details ask me. Eligibility restrictions apply
Key facts
- 0.33 acre lot
- Garage
- Built 1900
Property features AI
Exterior
- Parking: Detached 1-car garage
- Utilities: Public water; Public sewer
- Home design: Single-family residence; One story; Built in 1900; No shared/common walls
- Construction: Block foundation; Originally built in 1900
- Exterior features: Block foundation; Lot about one-third acre
Interior
- Bedrooms: Three main-level bedrooms
- Bathrooms: Two full bathrooms
- Heating & cooling: Baseboard heating; Window air conditioning units
- Interior features: Insulated windows throughout; Crawl space basement
Neighborhood map
What this means for you Summary
Snapshot
- This is a 3-bed/2.0-bath single-family listed at $150k.
Deal economics
- At list price, monthly cash flow is $66 ($792/yr) — positive.
- The deal already cash-flows at list — no discount required.
- To meet the 1% rule (rent ≥ 1% of price), the offer needs to be $121k (19.3% below list).
- Recommended offer: $121k (19.3% below list) — sets the bar for 1% rule.
Location & tenants
- Location reads 68/100 on livability (#549 in OH) — a middle-class / working-renter tenant base. Strengths: crime A+, cost of living A+, housing A+; Watch: amenities F, commute F, employment F.
- East Clinton Local (rural): math 41% / reading 52% proficiency, ranked #489 of 656 in OH (top 74%) — families likely to look elsewhere, expect single-tenant / working-renter base with shorter leases.
- Zoned schools: New Vienna Elementary School (math 57% / reading 67%, grade B, #590 of 1,584 statewide, top 41%, 269 students, 36% FRL); East Clinton Junior High School (math 37% / reading 41%, grade F, #526 of 654 statewide, top 81%, 276 students, 45% FRL); East Clinton High School (math 17% / reading 57%, grade F, #564 of 781 statewide, top 74%, 320 students, 45% FRL) — zoned schools at 42% FRL track the district average.
- Market conditions: 8 active listings in the ZIP; solid renter incomes; 119 units permitted in Clinton County in 2024 (0 in 5+ unit buildings).
Forward outlook
- Local home prices are declining (-3.0%/yr); year-one equity from $1k of loan paydown is wiped out by about $4k of value loss. Plan a longer hold.
- Clinton County population projected at -12% by 2050 — secular population decline; favor cash flow + early exit over multi-decade hold.
Negotiation context
- Only 6 days on market — expect competitive offers; lowballing is unlikely to land.
- 6 sale attempts since 25y ago; this cycle's ask has dropped $10k (6%) from the opening price — seller is motivated, your offer sets the floor, not the list.
- Current owner paid $8k; list at $150k implies a 1872% gain — meaningful room to come down on a strong offer.
Risks & watch-outs
- Watch-outs: built in 1900 — expect roof / HVAC / electrical / plumbing capex.
Questions for the listing agent
- Built in 1900 — when were the roof, HVAC, electrical panel, plumbing, and water heater last replaced?
- Is there a deadline driving the sale (1031 exchange, divorce, estate, relocation)? That informs how much negotiation room exists.
- Schools are B-rated — typically a magnet for longer-tenancy family renters. What's the average tenant stay here, and is there a school-zone premium baked into asking?
- What's the average days-on-market for RENTAL listings here right now (not sales)? A rising rental-DOM trend means longer vacancies and softer asking-rent achievability than the comps imply.
- What's the recent tenant-quality profile in this submarket — average credit score on applications, eviction rate, late-payment / NSF rate, and stable-employment percentage? A property-management company in the area should have these aggregated.
- How much new for-sale + rental construction is in the pipeline within 1–3 miles? Heavy new supply typically softens prices + rents 12–24 months out; constrained supply supports both.
Investment metrics
- 1% rule
- 0.81% ✗
- Cap rate
- 6.82%
- Cash-on-cash
- 1.89%
- DSCR
- 1.08
- GRM
- 10.3
CMA / ARV
- ARV (on-the-fly)
- $183,500
- Comps found
- 3
Show comp detail 3 sales within ~0.75 mi
| Address | Dist | Beds/Ba | Sqft | Sold | Price | $/sf | Match |
|---|---|---|---|---|---|---|---|
| 51 S Third St | 0.23mi | 2/1.0 (-1) | 1,344 (-8%) | 2mo | $179,900 | $134 | 65 |
| 86 West St | 0.36mi | 3/2.0 | 1,358 (-8%) | 11mo | $170,000 | $125 | 61 |
| 238 Circle Dr | 0.73mi | 3/2.0 | 1,600 (+9%) | 21mo | $149,000 | $93 | 33 |
Match score weights: distance 35% · size 25% · config 20% · recency 20%. Top-matched comps best support the ARV.
Projected returns pro-forma
-3.0% appreciation · 3.0% rent growth · sell at horizon
- IRR
- -13.4%
- Equity multiple
- 0.52×
- Total profit
- $-20,161
- Equity at exit
- $22,351
- IRR
- -4.5%
- Equity multiple
- 0.70×
- Total profit
- $-12,439
- Equity at exit
- $12,961
Cash invested: $41,972 (down + closing). Projections, not guarantees.
Landlord ↔ Tenant lean methodology
- Overall (STATE)
- 73 Landlord-Friendly
- State Ohio
- 73 Landlord-Friendly · R+6
- County
- — inherits STATE
- City
- — inherits STATE
ZIP-level market 45159
- Home prices YoY
- -2.2%
- Active inventory
- 8
- Price-to-rent
- 10.3×
Monthly cashflow live
- Estimated rent
- $1,209 medium interval (Pro) →
- Mortgage (P&I)
- −$786
- Tax from tax record
- −$41 /mo · $487/yr
- Insurance
- −$62
- HOA
- −$0
- Vacancy / Maint / Mgmt
- −$254
- Net cashflow
- $66
Break-even live
Sensitivity live
| Price | -10% $151 | -5% $108 | +0% $66 | +5% $24 | +10% $-19 |
|---|---|---|---|---|---|
| Rent | -10% $-30 | -5% $18 | +0% $66 | +5% $114 | +10% $161 |
| Rate | -1.0pp $141 | -0.5pp $104 | base $66 | +0.5pp $27 | +1.0pp $-12 |
UW: 25.0% down · 7.5% · 30yr · 1.5% tax · 5.0% vac · 8.0% maint · 8.0% mgmt
Financing live
Cash to close
- Down payment
- $37,475
- Closing costs
- $4,497
- Reserves months
- —
- Total cash needed
- —
Loan-product check · same deal, 3 products live
Conventional
25% down · 7.5% · 30yr
- Down + closing
- —
- Monthly P&I
- —
- Monthly cashflow
- —
- DSCR
- —
- Eligible?
- —
Personal DTI + credit; lowest rate.
DSCR
20% down · 8.5% · 30yr
- Down + closing
- —
- Monthly P&I
- —
- Monthly cashflow
- —
- DSCR
- —
- Eligible?
- —
No personal income docs; deal must DSCR.
Hard money
10% down · 12.0% · 12mo
- Down + closing
- —
- Monthly P&I
- —
- Monthly cashflow
- —
- DSCR
- —
- Eligible?
- —
Short-term bridge; refi at stabilization.
Listing history 29 events
-
2026-06-21days on market $149,900 Active 6 DOM
-
2026-06-21days on market $149,900 Active 5 DOM
-
2026-06-18days on market $149,900 Active 3 DOM
-
2026-06-17days on market $149,900 Active 2 DOM
-
2026-06-16pricedays on market $149,900 Active 1 DOM
-
2026-06-15days on market $159,900 Active 25 DOM
-
2026-06-13days on market $159,900 Active 23 DOM
-
2026-06-12days on market $159,900 Active 22 DOM
-
2026-06-09days on market $159,900 Active 19 DOM
-
2026-06-08days on market $159,900 Active 18 DOM
-
2026-06-08days on market $159,900 Active 17 DOM
-
2026-06-07days on market $159,900 Active 16 DOM
-
2026-06-04days on market $159,900 Active 13 DOM
-
2026-06-02days on market $159,900 Active 12 DOM
-
2026-06-01days on market $159,900 Active 11 DOM
-
2026-05-31days on market $159,900 Active 10 DOM
-
2026-05-21$159,900 Active
-
2011-05-11soldstatus $7,600 285-char remark
Show marketing remark (285 chars)
This is a Fannie Mae HomePath property. Nice 1 car detached garage. Large rooms in property and public water & sewer. Close by June 30, 2011 and request up to 3.5% of the final sales price for closing cost assistance! Click for more details ask me. Eligibility restrictions apply
-
2011-05-05historical 285-char remark
Show marketing remark (285 chars)
This is a Fannie Mae HomePath property. Nice 1 car detached garage. Large rooms in property and public water & sewer. Close by June 30, 2011 and request up to 3.5% of the final sales price for closing cost assistance! Click for more details ask me. Eligibility restrictions apply
-
2011-02-01$9,900 285-char remark
Show marketing remark (285 chars)
This is a Fannie Mae HomePath property. Nice 1 car detached garage. Large rooms in property and public water & sewer. Close by June 30, 2011 and request up to 3.5% of the final sales price for closing cost assistance! Click for more details ask me. Eligibility restrictions apply
-
2010-04-29historical
-
2010-02-01$46,000
-
2008-09-09historical
-
2008-01-07$50,000
-
2005-10-16historical
-
2005-06-20$65,000
-
2002-05-21soldstatus $40,400
-
2002-05-17soldstatus $40,400
-
2001-11-26$48,500
ⓘ Source: listings_history table (triggers on properties + properties_extension) + one-shot
backfill from property_details.listing_events for pre-trigger history.
Tax reassessment forecast OH · Partial reset (capped growth)
- Current annual tax
- $487 · $41/mo
- Projected year-2 tax
- $1,413 · $118/mo
- Expected delta
- +$926/yr (+$77/mo · 190.1%)
ⓘ Screening estimate from a state-policy table — verify with the county assessor before closing.
Climate risk First Street
- Flood 1/10 Low FEMA zone X (unshaded) · 0% chance over 30 yrs
- Wildfire 1/10 Low
- Heat 3/10 Moderate 7 d/yr ≥98°F today · 18 d/yr by 30 yrs out
- Wind 2/10 Low 100% chance of damaging wind over 30 yrs
- Air quality 3/10 Moderate 2 unhealthy d/yr today · 3 by 30 yrs out
Nearby sold comps map
Loading sold comps map…
Walkable amenities ~0.75 mi
Loading nearby amenities…
Taxation est. · year 1
- Rental income
- $14,508
- − Mortgage interest
- −$8,397
- − Property taxes
- −$487
- − Insurance
- −$750
- − Repairs & maintenance
- −$1,161
- − Management
- −$1,161
- − Depreciation
- −$4,361
- Taxable loss
- −$1,807
- Est. tax savings @ 24.0%
- +$434
- After-tax cash flow
- $1,225/yr
For passive investors: Depreciation is non-cash, so a rental often shows a tax loss while cash-flowing — sheltering income. Rental losses are passive: they offset passive income freely, and up to $25,000/yr can offset ordinary (W-2) income if you actively participate and your MAGI is under $100k (phasing out to $0 by $150k); unused losses carry forward. On sale, claimed depreciation is recaptured at up to 25%, and gains may owe capital-gains tax (a 1031 exchange can defer both). Figures are a year-1 estimate at your 24.0% rate — not tax advice; consult a CPA.
Schools (NCES district)
- District
- East Clinton Local
- NCES district ID
- 3904640
- Math proficiency
- 41% ▼ -21.00%
- Reading proficiency
- 52% ▼ -14.00%
- Median HH income
- $45,362
- Composite
- 39.4/100
- National rank
- #3969
- State rank
- #489 of 656 in OH
Livability — New Vienna
- Score
- 68/100
- State rank
- #549
- US rank
- #9374
Category grades
Schools grade is shown separately in the Schools card above.
Census & demographics
- Census place
- New Vienna, OH
- County
- Clinton · 46,911 people
- Population (ZIP)
- 3,333
- Household income
- $80,508
- Rent vs Own
- Severe rent burden
- 3.1
Population outlook (Clinton County) Hauer SSP2
- Today (2025)
- 41,352 people
- By 2030
- 40,831 · -1.3%
- By 2040
- 39,049 · -5.6%
- By 2050
- 36,408 · -12.0%
- By 2075
- 29,652 · -28.3%
- By 2100
- 20,736 · -49.9%
Race, ethnicity, and origin ACS 2023
- Neighborhood character
- Predominantly White (91%)
- Race & ethnicity
- White 91% Two or more races 6% Hispanic / Latino 2%
- Common ancestry
- Lithuanian 2% Italian 2% Iranian 1%
- Foreign-born
- 0%
- Languages at home
- 99% English-only · German/W. Germanic 1%
Political lean MEDSL · Clinton
- 2024 margin
- Solid R (+54.6) · D 22.3% · R 76.9%
- 2008→2024 swing
- -24.3pp toward R · 2008: -30.3pp · 2024: -54.6pp
- All cycles
- 2024: R+54.6 2020: R+52.6 2016: R+52.6 2012: R+35.2 2008: R+30.3
Not yet ingested
- Civics
- —
Market trends
- HPI YoY
- ▼ -6.78%
- Current HPI
- 295.2597
- Rent YoY
- —
- Metro
- —
- State GDP YoY
- ▲ 1.98%
- F500 in state
- 48
Industry mix (Fortune 500 HQ in OH)
| Industry | F500 HQs | Revenue |
|---|---|---|
| Insurance | 3 | $145B |
|
||
| Industrial Machinery | 3 | $49B |
|
||
| Financial Services | 3 | $24B |
|
||
| Consumer Goods | 2 | $93B |
|
||
| Aerospace / Defense | 2 | $47B |
|
||
| Utilities | 2 | $33B |
|
||
Price history
+229.7% since first listed13 events — show timeline
- 2026-05-21 Listed $159,900 CBRMLS
- 2011-05-11 Sold (MLS) $7,600 CBRMLS
- 2011-05-05 Listing Removed — CBRMLS
- 2011-02-01 Listed $9,900 CBRMLS
- 2010-04-29 Listing Removed — Cincy MLS
- 2010-02-01 Listed $46,000 Cincy MLS
- 2008-09-09 Listing Removed — Cincy MLS
- 2008-01-07 Listed $50,000 Cincy MLS
- 2005-10-16 Listing Removed — Cincy MLS
- 2005-06-20 Listed $65,000 Cincy MLS
- 2002-05-21 Sold (Public Records) $40,400 Public Records
- 2002-05-17 Sold (MLS) $40,400 Cincy MLS
- 2001-11-26 Listed $48,500 Cincy MLS
Property tax history
+7.0%/yrLatest (2025): $487 · -7.6% YoY. Source: county tax records.
Cash-flow waterfall
monthlySold comps — $/sqft
last 12 mo · ≤1 miLoading sold comps…