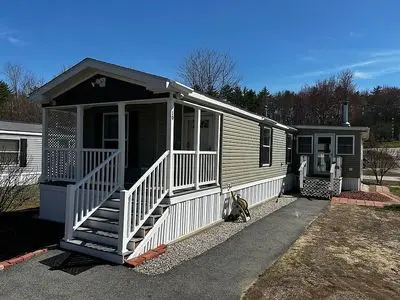
10 Lamp St · Conway, NH
Flood risk 1/10 · Minimal
- FEMA flood zone
- X (unshaded)
- Chance of flooding over 30 yrs
- 0.0%
- Est. flood insurance / yr
- $507 – $1,088
Fire risk 1/10 · Minimal
- Est. fire insurance / yr
- $507 – $941
Heat risk 3/10 · Minor
- Hot days now (above 94°F)
- 7 days/yr
- Hot days in 30 yrs
- 15 days/yr
Wind risk 3/10 · Minor
- Chance of severe wind over 30 yrs
- 6.0%
Air-quality risk 2/10 · Minimal
- Unhealthy air days now
- 1 days/yr
- Unhealthy air days in 30 yrs
- 1 days/yr
Risk factors via First Street. Map © Google.
Why this score? — see what drove the C- grade
The composite is a weighted blend of 9 inputs, each scored 0–100. Each bar is that input's sub-score; the figure is the points it added to the 100-point composite (weight × sub-score).
- Cash flow +26.3/30.0
- DSCR +8.9/10.0
- 1% rule +7.0/10.0
- Livability +3.7/5.0
- Schools +3.2/10.0
- Rent growth +2.5/5.0
- Condition / age +2.2/5.0
- ARV discount +0.0/15.0
- Appreciation +0.0/10.0
$150,000
🖨 Deal sheet 📄 Offer letter ✓ Due diligence
Listing remarks
Charming North Conway Country Retreat with Sunroom, Workshop & amp; Mountain Lifestyle Nestled in a peaceful country setting just minutes from the heart of North Conway, this inviting home offers the perfect balance of cozy living and outdoor adventure. With 768 square feet of efficient living space plus a bright 10x20 sunroom, you & acirc; & euro; & trade; ll enjoy extra room to relax, entertain, or unwind while taking in the surrounding natural beauty. Inside, the home is warm and welcoming with multiple heating options designed for New England living. A classic wood stove creates the perfect cozy atmosphere, complemented by two propane Rinnai heaters, a modern AC/heat mi
Key facts
- Wood shed
- Classic wood stove
- Sunroom
Tags
Property features AI
Exterior
- Home design: Built in 2017
- Construction: Living area approximately 768
- Exterior features: Located in the Conway subdivision
Neighborhood map
What this means for you Summary
Snapshot
- This is a 2-bed/1.0-bath manufactured listed at $150k. Condition is rated fair.
Deal economics
- At list price, monthly cash flow is $385 ($5k/yr) — positive.
- The deal already cash-flows at list — no discount required.
- Meets the 1% rule at list price ($2k rent vs $150k).
- Recommended offer: $146k (3.0% below list) — sets the bar for market timing.
- Cap rate 9.4% vs local median 3.0% in Conway — top-decile yield for the area; either an underpriced asset or a hidden risk that comps aren't pricing in. Stress-test before assuming the spread holds.
Location & tenants
- Location reads 74/100 on livability (#33 in NH, #4,690 nationally) — a middle-class / working-renter tenant base. Strengths: cost of living A+, housing A+, health & safety A+; Watch: schools D+, employment D, amenities F.
- Conway School District (rural): math 28% / reading 46% proficiency, ranked #73 of 98 in NH (top 74%) — families likely to look elsewhere, expect single-tenant / working-renter base with shorter leases.
- Market conditions: 39 active listings in the ZIP; 1 comparable units currently listed for rent nearby; 357 units permitted in Carroll County in 2024 (0 in 5+ unit buildings).
Forward outlook
- Local home prices are declining (-3.0%/yr); year-one equity from $1k of loan paydown is wiped out by about $4k of value loss. Plan a longer hold.
- Carroll County population projected at -27% by 2050 — secular population decline; favor cash flow + early exit over multi-decade hold.
- At projected returns (-3.0% appreciation + 3.0% rent growth), your $42k cash investment doubles in ~10 years — after that, you're playing with house money.
Negotiation context
- It's been on market 37 days — a 3% lower offer ($146k) is reasonable based on typical stale-listing flexibility.
Questions for the listing agent
- It's been on market 37 days. Have you received any prior offers? Is the seller open to a 3% concession, seller financing, or rate buy-down credit?
- Have any recent inspections been done? Can we get a copy of the seller's disclosures and any deferred-maintenance estimates?
- Is there a deadline driving the sale (1031 exchange, divorce, estate, relocation)? That informs how much negotiation room exists.
- Schools are D-rated, which usually means shorter tenancies and higher turnover. Who's the typical renter profile here, and what's been the actual vacancy rate?
- What's the average days-on-market for RENTAL listings here right now (not sales)? A rising rental-DOM trend means longer vacancies and softer asking-rent achievability than the comps imply.
- What's the recent tenant-quality profile in this submarket — average credit score on applications, eviction rate, late-payment / NSF rate, and stable-employment percentage? A property-management company in the area should have these aggregated.
- How much new for-sale + rental construction is in the pipeline within 1–3 miles? Heavy new supply typically softens prices + rents 12–24 months out; constrained supply supports both.
Investment metrics
- 1% rule
- 1.20% ✓
- Cap rate
- 9.38%
- Cash-on-cash
- 11.01%
- DSCR
- 1.49
- GRM
- 6.9
CMA / ARV
- ARV (on-the-fly)
- $105,216
- Comps found
- 4
Show comp detail 4 sales within ~0.75 mi
| Address | Dist | Beds/Ba | Sqft | Sold | Price | $/sf | Match |
|---|---|---|---|---|---|---|---|
| 28 Mellen Cir | 0.24mi | 2/1.0 | 795 (+4%) | 7mo | $72,000 | $91 | 77 |
| 288 Lamplighter Dr | 0.44mi | 2/1.5 | 784 (+2%) | 2mo | $103,950 | $133 | 72 |
| 83 Lamplighter Dr | 0.13mi | 2/1.0 | 840 (+9%) | 16mo | $115,000 | $137 | 65 |
| 73 Lamplighter's Dr | 0.08mi | 2/2.0 | 880 (+15%) | 24mo | $192,700 | $219 | 48 |
Match score weights: distance 35% · size 25% · config 20% · recency 20%. Top-matched comps best support the ARV.
Projected returns pro-forma
-3.0% appreciation · 3.0% rent growth · sell at horizon
- IRR
- 0.2%
- Equity multiple
- 1.01×
- Total profit
- $266
- Equity at exit
- $22,365
- IRR
- 9.8%
- Equity multiple
- 1.76×
- Total profit
- $31,948
- Equity at exit
- $12,969
Cash invested: $42,000 (down + closing). Projections, not guarantees.
Landlord ↔ Tenant lean methodology
- Overall (STATE)
- 56 Moderately Landlord-Leaning
- State New Hampshire
- 56 Moderately Landlord-Leaning · D+1
- County
- — inherits STATE
- City
- — inherits STATE
ZIP-level market 03818
- Home prices YoY
- -8.6%
- Active inventory
- 39
- Price-to-rent
- 6.9×
Monthly cashflow live
- Estimated rent
- $1,800 medium interval (Pro) →
- Mortgage (P&I)
- −$787
- Tax est. 1.5%
- −$188 /mo · $2,250/yr
- Insurance
- −$62
- HOA
- −$0
- Vacancy / Maint / Mgmt
- −$378
- Net cashflow
- $385
Break-even live
UW: 25.0% down · 7.5% · 30yr · 1.5% tax · 5.0% vac · 8.0% maint · 8.0% mgmt
Financing live
Cash to close
- Down payment
- $37,500
- Closing costs
- $4,500
- Reserves months
- —
- Total cash needed
- —
Loan-product check · same deal, 3 products live
Conventional
25% down · 7.5% · 30yr
- Down + closing
- —
- Monthly P&I
- —
- Monthly cashflow
- —
- DSCR
- —
- Eligible?
- —
Personal DTI + credit; lowest rate.
DSCR
20% down · 8.5% · 30yr
- Down + closing
- —
- Monthly P&I
- —
- Monthly cashflow
- —
- DSCR
- —
- Eligible?
- —
No personal income docs; deal must DSCR.
Hard money
10% down · 12.0% · 12mo
- Down + closing
- —
- Monthly P&I
- —
- Monthly cashflow
- —
- DSCR
- —
- Eligible?
- —
Short-term bridge; refi at stabilization.
Rent comps 1 comps
| Address | Beds | Baths | Sqft | Rent | $/sqft | DOM | Units | Dist |
|---|---|---|---|---|---|---|---|---|
| 19 Saco St #91 Center Conway, NH | 2.0 | 1.0 | 1015 | $1,800 | $1.77 | 44d | 1 | 1.19mi |
Listing history 15 events
-
2026-06-18days on market $150,000 Active 37 DOM
-
2026-06-17days on market $150,000 Active 36 DOM
-
2026-06-16days on market $150,000 Active 35 DOM
-
2026-06-15days on market $150,000 Active 34 DOM
-
2026-06-13days on market $150,000 Active 32 DOM
-
2026-06-12days on market $150,000 Active 31 DOM
-
2026-06-09days on market $150,000 Active 28 DOM
-
2026-06-08days on market $150,000 Active 27 DOM
-
2026-06-07days on market $150,000 Active 26 DOM
-
2026-06-07days on market $150,000 Active 25 DOM
-
2026-06-04days on market $150,000 Active 22 DOM
-
2026-06-02days on market $150,000 Active 21 DOM
-
2026-06-01days on market $150,000 Active 20 DOM
-
2026-05-31days on market $150,000 Active 19 DOM
-
2026-05-12$150,000 Active 1413-char remark
ⓘ Source: listings_history table (triggers on properties + properties_extension) + one-shot
backfill from property_details.listing_events for pre-trigger history.
Climate risk First Street
- Flood 1/10 Low FEMA zone X (unshaded) · 0% chance over 30 yrs
- Wildfire 1/10 Low
- Heat 3/10 Moderate 7 d/yr ≥94°F today · 15 d/yr by 30 yrs out
- Wind 3/10 Moderate 6% chance of damaging wind over 30 yrs
- Air quality 2/10 Low 1 unhealthy d/yr today · 1 by 30 yrs out
Nearby sold comps map
Loading sold comps map…
Walkable amenities ~0.75 mi
Loading nearby amenities…
Taxation est. · year 1
- Rental income
- $21,600
- − Mortgage interest
- −$8,402
- − Property taxes
- −$2,250
- − Insurance
- −$750
- − Repairs & maintenance
- −$1,728
- − Management
- −$1,728
- − Depreciation
- −$4,364
- Taxable income
- $2,378
- Est. tax owed @ 24.0%
- −$571
- After-tax cash flow
- $4,054/yr
For passive investors: Depreciation is non-cash, so a rental often shows a tax loss while cash-flowing — sheltering income. Rental losses are passive: they offset passive income freely, and up to $25,000/yr can offset ordinary (W-2) income if you actively participate and your MAGI is under $100k (phasing out to $0 by $150k); unused losses carry forward. On sale, claimed depreciation is recaptured at up to 25%, and gains may owe capital-gains tax (a 1031 exchange can defer both). Figures are a year-1 estimate at your 24.0% rate — not tax advice; consult a CPA.
Condition & rehab AI · 1 photo
This manufactured home requires significant exterior and interior repairs, including siding, paint, and flooring. Immediate updates to the exterior and interior will significantly improve its resale and rental value.
Repairs flagged
- Major exterior siding — Severe weathering and peeling
- Major interior walls — Significant peeling paint
- Major flooring — Worn carpet
- Major HVAC/mechanicals — No visible photos
Value-add opportunities
- Resale repair and paint exterior — Enhances curb appeal and property value
- Rental replace carpet — Improves living space and tenant satisfaction
Renovation cost estimate screening
| Repair item | Severity | Est. cost |
|---|---|---|
| exterior siding · Severe weathering and peeling | Major | $15,000–50,000 |
| interior walls · Significant peeling paint | Major | $15,000–50,000 |
| flooring · Worn carpet | Major | $15,000–50,000 |
| HVAC/mechanicals · No visible photos | Major | $15,000–50,000 |
| Total estimated repair cost · 4 items | $60,000–200,000 |
Value-add ROI direction
- Resale repair and paint exterior — Enhances curb appeal and property value ↑
- Rental replace carpet — Improves living space and tenant satisfaction ↑
ⓘ Cost ranges are severity-bucket heuristics (US national rule-of-thumb). Get contractor quotes + a written scope before underwriting a rehab budget.
Schools (NCES district)
- District
- Conway School District
- NCES district ID
- 3302490
- Math proficiency
- 28% ▼ -8.00%
- Reading proficiency
- 46% ▼ -1.00%
- Median HH income
- $49,590
- Composite
- 31.9/100
- National rank
- #5859
- State rank
- #73 of 98 in NH
Livability — Conway
- Score
- 74/100
- State rank
- #33
- US rank
- #4690
Category grades
Schools grade is shown separately in the Schools card above.
Census & demographics
- Census place
- Conway, NH
- Population (ZIP)
- 3,930
Population outlook (Carroll County) Hauer SSP2
- Today (2025)
- 45,072 people
- By 2030
- 43,158 · -4.2%
- By 2040
- 38,044 · -15.6%
- By 2050
- 33,087 · -26.6%
- By 2075
- 25,661 · -43.1%
- By 2100
- 18,684 · -58.5%
Race, ethnicity, and origin ACS 2023
- Neighborhood character
- Predominantly White (92%)
- Race & ethnicity
- White 92% Two or more races 4% Asian 3% Hispanic / Latino 2%
- Common ancestry
- Lithuanian 8% Iranian 7% Slovak 7%
- Foreign-born
- 3% · Canada
- Languages at home
- 98% English-only · Spanish 1% Vietnamese 1%
Political lean MEDSL · Carroll
- 2024 margin
- Toss-up / Even · D 48.8% · R 50.5%
- 2008→2024 swing
- -8.0pp toward R · 2008: 6.3pp · 2024: -1.7pp
- All cycles
- 2024: R+1.7 2020: D+1.5 2016: R+5.7 2012: R+0.8 2008: D+6.3
Not yet ingested
- Civics
- —
Market trends
- HPI YoY
- ▼ -37.29%
- Current HPI
- 396.4228
- Rent YoY
- —
- Metro
- —
- State GDP YoY
- —
- F500 in state
- 0
Price history
1 event — show timeline
- 2026-05-12 Listed $150,000 FSBO.com
Cash-flow waterfall
monthlySold comps — $/sqft
last 12 mo · ≤1 miLoading sold comps…