 Duplex
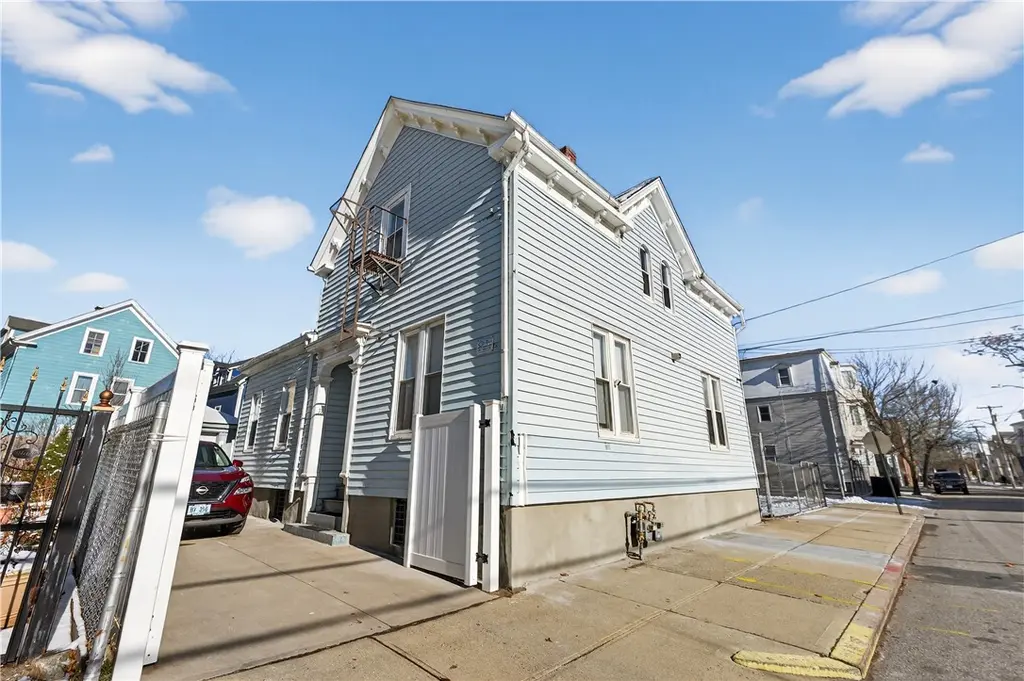
71 Wilson St · Providence, RI
Flood risk No data
- FEMA flood zone
- —
- Chance of flooding over 30 yrs
- —
- Est. flood insurance / yr
- —
Fire risk No data
- Est. fire insurance / yr
- —
Heat risk No data
- Hot days now (above threshold)
- —
- Hot days in 30 yrs
- —
Wind risk No data
- Chance of severe wind over 30 yrs
- —
Air-quality risk No data
- Unhealthy air days now
- —
- Unhealthy air days in 30 yrs
- —
Risk factors via First Street. Map © Google.
Why this score? — see what drove the C- grade
The composite is a weighted blend of 9 inputs, each scored 0–100. Each bar is that input's sub-score; the figure is the points it added to the 100-point composite (weight × sub-score).
- Cash flow +17.2/30.0
- ARV discount +15.0/15.0
- DSCR +5.4/10.0
- Rent growth +5.0/5.0
- Livability +4.2/5.0
- 1% rule +3.7/10.0
- Condition / age +2.5/5.0
- Schools +1.0/10.0
- Appreciation +0.0/10.0
$499,995
🖨 Deal sheet 📄 Offer letter ✓ Due diligence
Multi-family units
County records classify this as Multi-Family (2-4 Unit). Listing-text estimate: 2 units. confirmed
Listing remarks MLS
This well-kept two-family home offers great potential for both owner-occupants and investors. The first floor has 3 bedrooms and 1 full bath, while the second floor features a 1-bedroom, 1-bath layout. The basement adds 750 square feet of extra living space with both interior and exterior access. A detached one-car garage and shared driveway make off-street parking easy. Conveniently located near local amenities, major highways, and just minutes from downtown Providence, residents can enjoy all the city's attractions. For c This lot is zoned R-4 Map/Lot-30/248, making it attractive for investors or developers exploring new-build possibilities. Conveniently located near local amenities, major highways, and just minutes from downtown Providence, residents can enjoy all the city's attractions. For commuters, the train station is only minutes away. (buyer and agent encouraged to perform due diligence)commuters, the train station is only minutes away. Property being Sold with Lot 67 Wilson St in Providence Rhode Island Zoned R4 Total Price $675,000
Key facts
- Extra living space
- Two-family home
- Detached garage
Tags
Neighborhood map
What this means for you Summary
Snapshot
- This is a 2 × 2-bed/1.0-bath units multifamily listed at $500k.
Deal economics
- At list price, monthly cash flow is $355 ($4k/yr) — positive. Per door: $177/mo.
- The deal already cash-flows at list — no discount required.
- To meet the 1% rule (rent ≥ 1% of price), the offer needs to be $437k (12.6% below list).
- Recommended offer: $437k (12.6% below list) — sets the bar for 1% rule.
- Cap rate 7.1% vs local median 4.2% in Providence — top-decile yield for the area; either an underpriced asset or a hidden risk that comps aren't pricing in. Stress-test before assuming the spread holds.
Location & tenants
- Location reads 84/100 on livability (#2 in RI, #794 nationally) — a professional / high-income tenant draw. Strengths: amenities A+, commute A+, housing A+; Watch: employment C-, schools F.
- Providence (urban): math 8% / reading 16% proficiency, ranked #34 of 39 in RI (top 87%) — low school quality limits family demand, transient renter base, plan for 1-2y turnover; 79% free/reduced lunch — lower-income household profile, screen leases tightly.
- Market conditions: Rents rising fast (+15.3%/yr); 61 active listings in the ZIP; 3 comparable units currently listed for rent nearby; rentals at typical pace (median 24d on market — plan ~3-4 weeks tenant-placement turnaround); 776 units permitted in Providence County in 2024 (229 in 5+ unit buildings).
- At $4,371/mo this rent would consume 100% of the median local household income ($52k/yr) (locally 2189% of renters already pay >50% of income on rent) — very limited rent-growth headroom before tenants either downsize or default.
Forward outlook
- Local home prices are declining (-3.0%/yr); year-one equity from $3k of loan paydown is wiped out by about $15k of value loss. Plan a longer hold.
- Providence County population projected at +5% by 2050 — modest demand growth; plan on rents tracking national, not racing it.
Negotiation context
- It's been on market 154 days — a 12% lower offer ($440k) is reasonable based on typical stale-listing flexibility.
- 10 sale attempts since 25y ago with the ask held roughly flat each time — persistent listings suggest the price (not the market) is what's stuck; bring a comps-based counter.
Risks & watch-outs
- Watch-outs: built in 1900 — expect roof / HVAC / electrical / plumbing capex.
Questions for the listing agent
- It's been on market 154 days. Have you received any prior offers? Is the seller open to a 13% concession, seller financing, or rate buy-down credit?
- Can we see the unit-by-unit rent roll, current vacancy, and any below-market leases? What's the average tenancy length?
- What capital expenditures (roof, boiler, parking lot, exteriors) have been made in the last 5 years, and what's planned in the next 2?
- Built in 1900 — when were the roof, HVAC, electrical panel, plumbing, and water heater last replaced?
- Why hasn't it sold? Are there any deal-killer items the seller is aware of (foundation, flood, title, zoning, code violations)?
- Is there a deadline driving the sale (1031 exchange, divorce, estate, relocation)? That informs how much negotiation room exists.
- Schools are F-rated, which usually means shorter tenancies and higher turnover. Who's the typical renter profile here, and what's been the actual vacancy rate?
- What's the average days-on-market for RENTAL listings here right now (not sales)? A rising rental-DOM trend means longer vacancies and softer asking-rent achievability than the comps imply.
- What's the recent tenant-quality profile in this submarket — average credit score on applications, eviction rate, late-payment / NSF rate, and stable-employment percentage? A property-management company in the area should have these aggregated.
- How much new apartment / multifamily construction is in the pipeline within 1–3 miles? Heavy new supply (>2% of stock underway) typically softens rents 12–24 months out; light construction supports rent growth.
Investment metrics
- 1% rule
- 0.87% ✗
- Cap rate
- 7.14%
- Cash-on-cash
- 3.04%
- DSCR
- 1.14
- GRM
- 9.5
CMA / ARV
- ARV (median comp)
- $601,328
- List price
- $499,995
- Delta
- -16.85%
- Verdict
- UNDERPRICED
- Comps
- 10 within 2.0 mi
Projected returns pro-forma
-3.0% appreciation · 8.0% rent growth · sell at horizon
- IRR
- -6.5%
- Equity multiple
- 0.75×
- Total profit
- $-35,476
- Equity at exit
- $74,551
- IRR
- 8.0%
- Equity multiple
- 1.73×
- Total profit
- $102,720
- Equity at exit
- $43,230
Cash invested: $139,999 (down + closing). Projections, not guarantees.
Landlord ↔ Tenant lean methodology
- Overall (STATE)
- 31 Tenant-Leaning
- State Rhode Island
- 31 Tenant-Leaning · D+8
- County
- — inherits STATE
- City
- — inherits STATE
ZIP-level market 02907
- Home prices YoY
- -20.1%
- Rents YoY
- 15.3%
- Active inventory
- 61
- Price-to-rent
- 19.1×
Monthly cashflow live
- Estimated rent
- $4,371 medium interval (Pro) →
- Mortgage (P&I)
- −$2,622
- Tax from tax record
- −$268 /mo · $3,215/yr
- Insurance
- −$208
- HOA
- −$0
- Vacancy / Maint / Mgmt
- −$918
- Net cashflow
- $355
Break-even live
2-unit breakdown (identical units grouped — click to expand)
| Units | Beds | Baths | Est. rent |
|---|---|---|---|
| 2× units | 2 | 1 | $4,370 |
| #1 | 2 | 1 | $2,185 |
| #2 | 2 | 1 | $2,185 |
| Total (2 units) | $4,371 | ||
UW: 25.0% down · 7.5% · 30yr · 1.5% tax · 5.0% vac · 8.0% maint · 8.0% mgmt
Financing live
Cash to close
- Down payment
- $124,999
- Closing costs
- $15,000
- Reserves months
- —
- Total cash needed
- —
Loan-product check · same deal, 3 products live
Conventional
25% down · 7.5% · 30yr
- Down + closing
- —
- Monthly P&I
- —
- Monthly cashflow
- —
- DSCR
- —
- Eligible?
- —
Personal DTI + credit; lowest rate.
DSCR
20% down · 8.5% · 30yr
- Down + closing
- —
- Monthly P&I
- —
- Monthly cashflow
- —
- DSCR
- —
- Eligible?
- —
No personal income docs; deal must DSCR.
Hard money
10% down · 12.0% · 12mo
- Down + closing
- —
- Monthly P&I
- —
- Monthly cashflow
- —
- DSCR
- —
- Eligible?
- —
Short-term bridge; refi at stabilization.
Rent comps 3 comps
| Address | Beds | Baths | Sqft | Rent | $/sqft | DOM | Units | Dist |
|---|---|---|---|---|---|---|---|---|
| 56 Greenwich St Unit 1 Providence, RI | 3.0 | 2.0 | 1400 | $2,800 | $2.00 | 24d | 1 | 0.68mi |
| 8 Anthony Ave Unit 1 Providence, RI | 3.0 | 2.0 | 1400 | $2,800 | $2.00 | 14d | 1 | 0.79mi |
| 29 Dunford St Unit 2 Providence, RI | 3.0 | 2.0 | 1116 | $2,400 | $2.15 | 24d | 1 | 1.23mi |
Listing history 37 events
-
2026-06-18days on market $499,995 Active 154 DOM
-
2026-06-17days on market $499,995 Active 153 DOM
-
2026-06-16days on market $499,995 Active 152 DOM
-
2026-06-15days on market $499,995 Active 151 DOM
-
2026-06-13days on market $499,995 Active 149 DOM
-
2026-06-09days on market $499,995 Active 145 DOM
-
2026-06-08days on market $499,995 Active 144 DOM
-
2026-06-07days on market $499,995 Active 143 DOM
-
2026-06-05days on market $499,995 Active 140 DOM
-
2026-06-03days on market $499,995 Active 139 DOM
-
2026-06-02days on market $499,995 Active 138 DOM
-
2026-06-01days on market $499,995 Active 137 DOM
-
2026-05-31days on market $499,995 Active 136 DOM
-
2026-04-14historical
-
2026-01-15$499,995 Active 1059-char remark
Show marketing remark (1059 chars)
This well-kept two-family home offers great potential for both owner-occupants and investors. The first floor has 3 bedrooms and 1 full bath, while the second floor features a 1-bedroom, 1-bath layout. The basement adds 750 square feet of extra living space with both interior and exterior access. A detached one-car garage and shared driveway make off-street parking easy. Conveniently located near local amenities, major highways, and just minutes from downtown Providence, residents can enjoy all the city's attractions. For c This lot is zoned R-4 Map/Lot-30/248, making it attractive for investors or developers exploring new-build possibilities. Conveniently located near local amenities, major highways, and just minutes from downtown Providence, residents can enjoy all the city's attractions. For commuters, the train station is only minutes away. (buyer and agent encouraged to perform due diligence)commuters, the train station is only minutes away. Property being Sold with Lot 67 Wilson St in Providence Rhode Island Zoned R4 Total Price $675,000
-
2025-12-21$675,000 Active
-
2023-04-12status Pending
-
2023-04-11historical
-
2023-03-28$425,900 Active
-
2019-08-26historical
-
2019-07-11historical Under Contract: Inspection Period
-
2019-06-30price $239,900
-
2019-06-17$244,900 Active
-
2016-11-08price $99,900
-
2016-11-08price $283,900
-
2007-03-28historical
-
2006-09-30$309,900
-
2005-11-29historical
-
2005-07-29$295,900
-
2002-08-09historical
-
2002-06-10$99,900
-
2002-06-03historical
-
2002-04-02$99,900
-
2002-03-31historical
-
2001-12-17$95,000
-
2001-12-16historical
-
2001-07-16$105,900
ⓘ Source: listings_history table (triggers on properties + properties_extension) + one-shot
backfill from property_details.listing_events for pre-trigger history.
Tax reassessment forecast RI · Partial reset (capped growth)
- Current annual tax
- $3,215 · $268/mo
- Projected year-2 tax
- $5,682 · $474/mo
- Expected delta
- +$2,467/yr (+$206/mo · 76.7%)
ⓘ Screening estimate from a state-policy table — verify with the county assessor before closing.
Nearby sold comps map
Loading sold comps map…
Walkable amenities ~0.75 mi
Loading nearby amenities…
Taxation est. · year 1
- Rental income
- $52,452
- − Mortgage interest
- −$28,007
- − Property taxes
- −$3,215
- − Insurance
- −$2,500
- − Repairs & maintenance
- −$4,196
- − Management
- −$4,196
- − Depreciation
- −$14,545
- Taxable loss
- −$4,208
- Est. tax savings @ 24.0%
- +$1,010
- After-tax cash flow
- $5,268/yr
For passive investors: Depreciation is non-cash, so a rental often shows a tax loss while cash-flowing — sheltering income. Rental losses are passive: they offset passive income freely, and up to $25,000/yr can offset ordinary (W-2) income if you actively participate and your MAGI is under $100k (phasing out to $0 by $150k); unused losses carry forward. On sale, claimed depreciation is recaptured at up to 25%, and gains may owe capital-gains tax (a 1031 exchange can defer both). Figures are a year-1 estimate at your 24.0% rate — not tax advice; consult a CPA.
Schools (NCES district)
- District
- Providence
- NCES district ID
- 4400900
- Math proficiency
- 8% ▼ -4.00%
- Reading proficiency
- 16% ▼ -2.00%
- Median HH income
- $38,197
- Composite
- 10.12/100
- National rank
- #9803
- State rank
- #34 of 39 in RI
Livability — Providence
- Score
- 84/100
- State rank
- #2
- US rank
- #794
Category grades
Schools grade is shown separately in the Schools card above.
Census & demographics
- Census place
- Providence, RI
- County
- Providence County · 548,917 people
- City population
- 212,734
- Metro
- Providence-Warwick, RI-MA
- Population (ZIP)
- 31,461
- Household income
- $52,485
- Rent vs Own
- Severe rent burden
- 2189.0
Population outlook (Providence County) Hauer SSP2
- Today (2025)
- 653,469 people
- By 2030
- 660,819 · +1.1%
- By 2040
- 672,747 · +3.0%
- By 2050
- 683,741 · +4.6%
- By 2075
- 720,435 · +10.2%
- By 2100
- 741,582 · +13.5%
Race, ethnicity, and origin ACS 2023
- Neighborhood character
- Predominantly Hispanic (70%)
- Race & ethnicity
- Hispanic / Latino 70% Two or more races 26% Black 10% White 10% Asian 5% Native American 2%
- Hispanic origin (detail)
- Puerto Rican 7% Dominican 50%
- Common ancestry
- Swiss 1% Lithuanian 1% Hispanic 1%
- Foreign-born
- 55% · Canada, Jamaica, Philippines
- Languages at home
- 25% English-only · Spanish 67% Other Asian/Pacific 3% French/Haitian/Cajun 1%
Political lean MEDSL · Providence
- 2024 margin
- D (+14.4) · D 56.1% · R 41.7% · Other 2.2%
- 2008→2024 swing
- -20.0pp toward R · 2008: 34.4pp · 2024: 14.4pp
- All cycles
- 2024: D+14.4 2020: D+22.9 2016: D+21.2 2012: D+34.9 2008: D+34.4
Not yet ingested
- Civics
- —
Market trends
- HPI YoY
- ▼ -125.19%
- Current HPI
- 498.142
- Rent YoY
- ▲ 15.32%
- Metro
- Providence-Warwick, RI-MA
- State GDP YoY
- ▲ 2.25%
- F500 in state
- 10
Industry mix (Fortune 500 HQ in RI)
| Industry | F500 HQs | Revenue |
|---|---|---|
| Healthcare | 1 | $373B |
|
||
| Food Distribution | 1 | $31B |
|
||
| Aerospace / Defense | 1 | $14B |
|
||
| Financial Services | 1 | $8B |
|
||
| Consumer Goods | 1 | $4B |
|
||
Price history
+372.1% since first listed24 events — show timeline
- 2026-04-14 Listing Removed — RIS
- 2026-01-15 Listed $499,995 RIS
- 2025-12-21 Listed $675,000 RIS
- 2023-04-12 Pending — RIS
- 2023-04-11 Listing Removed — RIS
- 2023-03-28 Listed $425,900 RIS
- 2019-08-26 Listing Removed — RIS
- 2019-07-11 Contingent — RIS
- 2019-06-30 Price Changed $239,900 RIS
- 2019-06-17 Listed $244,900 RIS
- 2016-11-08 Price Changed $283,900 RIS
- 2016-11-08 Price Changed $99,900 RIS
- 2007-03-28 Listing Removed — RIS
- 2006-09-30 Listed $309,900 RIS
- 2005-11-29 Listing Removed — RIS
- 2005-07-29 Listed $295,900 RIS
- 2002-08-09 Listing Removed — RIS
- 2002-06-10 Listed $99,900 RIS
- 2002-06-03 Listing Removed — RIS
- 2002-04-02 Listed $99,900 RIS
- 2002-03-31 Listing Removed — RIS
- 2001-12-17 Listed $95,000 RIS
- 2001-12-16 Listing Removed — RIS
- 2001-07-16 Listed $105,900 RIS
Property tax history
+0.5%/yrLatest (2025): $3,215 · -38.7% YoY. Source: county tax records.
Cash-flow waterfall
monthlySold comps — $/sqft
last 12 mo · ≤1 miLoading sold comps…