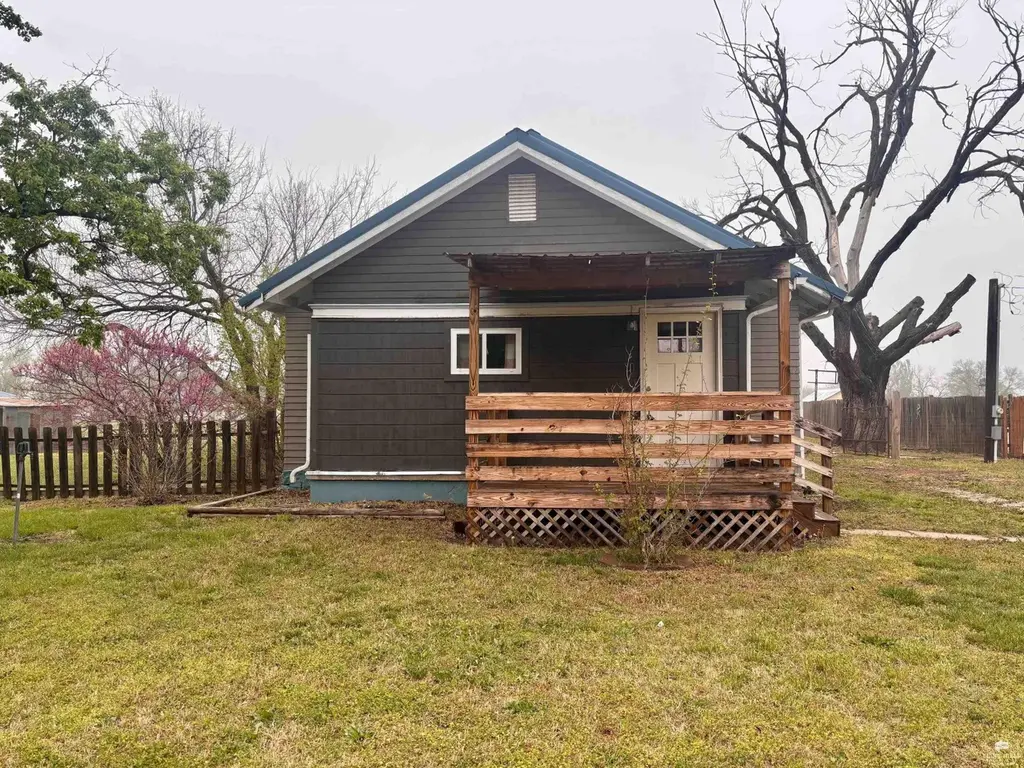
1502 W Walnut St · Herington, KS
Flood risk 1/10 · Minimal
- FEMA flood zone
- —
- Chance of flooding over 30 yrs
- 0.0%
- Est. flood insurance / yr
- —
Fire risk 7/10 · Major
- Est. fire insurance / yr
- $1,154 – $2,142
Heat risk 5/10 · Moderate
- Hot days now (above 107°F)
- 7 days/yr
- Hot days in 30 yrs
- 17 days/yr
Wind risk 2/10 · Minimal
- Chance of severe wind over 30 yrs
- 0.0%
Air-quality risk 2/10 · Minimal
- Unhealthy air days now
- 1 days/yr
- Unhealthy air days in 30 yrs
- 1 days/yr
Risk factors via First Street. Map © Google.
Why this score? — see what drove the B- grade
The composite is a weighted blend of 9 inputs, each scored 0–100. Each bar is that input's sub-score; the figure is the points it added to the 100-point composite (weight × sub-score).
- Cash flow +27.8/30.0
- DSCR +9.8/10.0
- ARV discount +7.5/15.0
- 1% rule +7.3/10.0
- Appreciation +5.1/10.0
- Livability +3.5/5.0
- Schools +2.6/10.0
- Rent growth +2.5/5.0
- Condition / age +2.5/5.0
$89,500
🖨 Deal sheet (PDF) 📄 Offer letter ✓ Due diligence
Key facts
- Metal roof
- Main road access
- Central heat and air
Tags
Property features AI
Finance
- Other: Annual tax information available
Exterior
- Utilities: No pool; Lot approx. 2 acres
- Home design: Single-family residence; Residential property
- Construction: Construction materials: Unknown; Built area above grade: 1,152
- Exterior features: Privacy fencing; Fenced yard; Gravel road access
Interior
- Kitchen: Dishwasher; Microwave; Refrigerator
- Bedrooms: 3 main-level bedrooms
- Bathrooms: 1 full bathroom
- Heating & cooling: Natural gas heating; Central air conditioning; Ceiling fan(s) for cooling
- Interior features: Ceiling fans; Crawl space basement
Neighborhood map
What this means for you Summary
Snapshot
- This is a 3-bed/1.0-bath single-family listed at $90k.
Deal economics
- At list price, monthly cash flow is $272 ($3k/yr) — positive.
- The deal already cash-flows at list — no discount required.
- Meets the 1% rule at list price ($1k rent vs $90k).
- Recommended offer: $84k (6.0% below list) — sets the bar for market timing.
Location & tenants
- Location reads 70/100 on livability (#170 in KS) — a middle-class / working-renter tenant base. Strengths: cost of living A+, housing A+, health & safety A+; Watch: employment C-, amenities F, commute F.
- Herington (rural): math 28% / reading 33% proficiency, ranked #100 of 169 in KS (top 59%) — families likely to look elsewhere, expect single-tenant / working-renter base with shorter leases.
- Zoned schools: Herington Elem (math 42% / reading 42%, grade F, #273 of 684 statewide, top 45%, 187 students, 74% FRL); Herington Middle Sch (math 22% / reading 27%, grade F, #110 of 219 statewide, top 55%, 112 students, 74% FRL); Herington High (math 5% / reading 15%, grade F, #289 of 327 statewide, top 93%, 151 students, 60% FRL) — zoned schools average 70% FRL vs 49% district-wide (21 pts higher); higher-poverty schools than district average — tighter screening recommended.
- Market conditions: 29 active listings in the ZIP; 26 units permitted in Dickinson County in 2024 (0 in 5+ unit buildings).
Forward outlook
- In year one you build about $792 of equity ($619 loan paydown + $173 appreciation (0.2% local appreciation)).
- Dickinson County population projected at -12% by 2050 — secular population decline; favor cash flow + early exit over multi-decade hold.
- At projected returns (0.2% appreciation + 3.0% rent growth), your $25k cash investment doubles in ~6 years — after that, you're playing with house money.
Negotiation context
- It's been on market 62 days — a 6% lower offer ($84k) is reasonable based on typical stale-listing flexibility.
- Current owner paid $45k; list at $90k implies a 99% gain — meaningful room to come down on a strong offer.
Risks & watch-outs
- Watch-outs: built in 1920 — expect roof / HVAC / electrical / plumbing capex.
- Climate carrying-cost: major wildfire risk; extreme-heat days projected 7→17/yr by 2055 (HVAC capex compounding) — expect insurance premiums to compound above CPI over the hold.
Questions for the listing agent
- It's been on market 62 days. Have you received any prior offers? Is the seller open to a 6% concession, seller financing, or rate buy-down credit?
- Built in 1920 — when were the roof, HVAC, electrical panel, plumbing, and water heater last replaced?
- Why hasn't it sold? Are there any deal-killer items the seller is aware of (foundation, flood, title, zoning, code violations)?
- Is there a deadline driving the sale (1031 exchange, divorce, estate, relocation)? That informs how much negotiation room exists.
- Schools are F-rated, which usually means shorter tenancies and higher turnover. Who's the typical renter profile here, and what's been the actual vacancy rate?
- What's the average days-on-market for RENTAL listings here right now (not sales)? A rising rental-DOM trend means longer vacancies and softer asking-rent achievability than the comps imply.
- What's the recent tenant-quality profile in this submarket — average credit score on applications, eviction rate, late-payment / NSF rate, and stable-employment percentage? A property-management company in the area should have these aggregated.
- How much new for-sale + rental construction is in the pipeline within 1–3 miles? Heavy new supply typically softens prices + rents 12–24 months out; constrained supply supports both.
Investment metrics
- 1% rule
- 1.23% ✓
- Cap rate
- 9.94%
- Cash-on-cash
- 13.01%
- DSCR
- 1.58
- GRM
- 6.8
CMA / ARV
No comps found within radius.
Projected returns pro-forma
0.19% appreciation · 3.0% rent growth · sell at horizon
- IRR
- 12.7%
- Equity multiple
- 1.62×
- Total profit
- $15,503
- Equity at exit
- $26,855
- IRR
- 17.2%
- Equity multiple
- 2.93×
- Total profit
- $48,463
- Equity at exit
- $32,980
Cash invested: $25,060 (down + closing). Projections, not guarantees.
Landlord ↔ Tenant lean methodology
- Overall (STATE)
- 83 Strongly Landlord-Friendly
- State Kansas
- 83 Strongly Landlord-Friendly · R+10
- County
- — inherits STATE
- City
- — inherits STATE
ZIP-level market 67449
- Home prices YoY
- 0.1%
- Active inventory
- 29
- Price-to-rent
- 6.8×
Monthly cashflow live
- Estimated rent
- $1,099 medium interval (Pro) →
- Mortgage (P&I)
- −$469
- Tax from tax record
- −$90 /mo · $1,082/yr
- Insurance
- −$37
- HOA
- −$0
- Vacancy / Maint / Mgmt
- −$231
- Net cashflow
- $272
Break-even live
Sensitivity live
| Price | -10% $322 | -5% $297 | +0% $272 | +5% $246 | +10% $221 |
|---|---|---|---|---|---|
| Rent | -10% $185 | -5% $228 | +0% $272 | +5% $315 | +10% $359 |
| Rate | -1.0pp $317 | -0.5pp $294 | base $272 | +0.5pp $248 | +1.0pp $225 |
UW: 25.0% down · 7.5% · 30yr · 1.5% tax · 5.0% vac · 8.0% maint · 8.0% mgmt
Financing live
Cash to close
- Down payment
- $22,375
- Closing costs
- $2,685
- Reserves months
- —
- Total cash needed
- —
Loan-product check · same deal, 3 products live
Conventional
25% down · 7.5% · 30yr
- Down + closing
- —
- Monthly P&I
- —
- Monthly cashflow
- —
- DSCR
- —
- Eligible?
- —
Personal DTI + credit; lowest rate.
DSCR
20% down · 8.5% · 30yr
- Down + closing
- —
- Monthly P&I
- —
- Monthly cashflow
- —
- DSCR
- —
- Eligible?
- —
No personal income docs; deal must DSCR.
Hard money
10% down · 12.0% · 12mo
- Down + closing
- —
- Monthly P&I
- —
- Monthly cashflow
- —
- DSCR
- —
- Eligible?
- —
Short-term bridge; refi at stabilization.
Listing history 14 events
-
2026-06-12statusdays on market $89,500 Pending 62 DOM
-
2026-06-09days on market $89,500 Active 60 DOM
-
2026-06-08days on market $89,500 Active 59 DOM
-
2026-06-07days on market $89,500 Active 58 DOM
-
2026-06-05days on market $89,500 Active 56 DOM
-
2026-06-04days on market $89,500 Active 54 DOM
-
2026-06-03price $89,500 Active 53 DOM
-
2026-06-02days on market $94,500 Active 53 DOM
-
2026-06-01days on market $94,500 Active 52 DOM
-
2026-05-31days on market $94,500 Active 51 DOM
-
2026-05-31days on market $94,500 Active 50 DOM
-
2026-05-21price $94,500
-
2026-04-10$99,900 Active
-
2006-07-01soldstatus $45,000
ⓘ Source: listings_history table (triggers on properties + properties_extension) + one-shot
backfill from property_details.listing_events for pre-trigger history.
Tax reassessment forecast KS · Resets to sale price
- Current annual tax
- $1,082 · $90/mo
- Projected year-2 tax
- $1,262 · $105/mo
- Expected delta
- +$180/yr (+$15/mo · 16.6%)
ⓘ Screening estimate from a state-policy table — verify with the county assessor before closing.
Climate risk First Street
- Flood 1/10 Low 0% chance over 30 yrs
- Wildfire 7/10 Severe
- Heat 5/10 Major 7 d/yr ≥107°F today · 17 d/yr by 30 yrs out
- Wind 2/10 Low 0% chance of damaging wind over 30 yrs
- Air quality 2/10 Low 1 unhealthy d/yr today · 1 by 30 yrs out
Nearby sold comps map
Loading sold comps map…
Walkable amenities ~0.75 mi
Loading nearby amenities…
Taxation est. · year 1
- Rental income
- $13,192
- − Mortgage interest
- −$5,013
- − Property taxes
- −$1,082
- − Insurance
- −$448
- − Repairs & maintenance
- −$1,055
- − Management
- −$1,055
- − Depreciation
- −$2,604
- Taxable income
- $1,935
- Est. tax owed @ 24.0%
- −$464
- After-tax cash flow
- $2,796/yr
For passive investors: Depreciation is non-cash, so a rental often shows a tax loss while cash-flowing — sheltering income. Rental losses are passive: they offset passive income freely, and up to $25,000/yr can offset ordinary (W-2) income if you actively participate and your MAGI is under $100k (phasing out to $0 by $150k); unused losses carry forward. On sale, claimed depreciation is recaptured at up to 25%, and gains may owe capital-gains tax (a 1031 exchange can defer both). Figures are a year-1 estimate at your 24.0% rate — not tax advice; consult a CPA.
Schools (NCES district)
- District
- Herington
- NCES district ID
- 2007110
- Math proficiency
- 28% ▼ -1.00%
- Reading proficiency
- 33% ▼ -2.00%
- Median HH income
- $39,012
- Composite
- 25.55/100
- National rank
- #7429
- State rank
- #100 of 169 in KS
Livability — Herington
- Score
- 70/100
- State rank
- #170
- US rank
- #8052
Category grades
Schools grade is shown separately in the Schools card above.
Census & demographics
- Census place
- Herington, KS
- Population (ZIP)
- 2,756
Population outlook (Dickinson County) Hauer SSP2
- Today (2025)
- 18,727 people
- By 2030
- 18,312 · -2.2%
- By 2040
- 17,433 · -6.9%
- By 2050
- 16,493 · -11.9%
- By 2075
- 14,441 · -22.9%
- By 2100
- 11,707 · -37.5%
Race, ethnicity, and origin ACS 2023
- Neighborhood character
- Predominantly White (84%)
- Race & ethnicity
- White 84% Two or more races 8% Hispanic / Latino 8%
- Hispanic origin (detail)
- Mexican 4% Puerto Rican 4%
- Common ancestry
- Italian 3% Slovak 2% Romanian 2%
- Foreign-born
- 0% · Canada
- Languages at home
- 96% English-only · Spanish 4%
Political lean MEDSL · Dickinson
- 2024 margin
- Solid R (+55.0) · D 21.8% · R 76.7% · Other 1.5%
- 2008→2024 swing
- -12.8pp toward R · 2008: -42.2pp · 2024: -55.0pp
- All cycles
- 2024: R+55.0 2020: R+54.1 2016: R+54.0 2012: R+47.7 2008: R+42.2
Not yet ingested
- Civics
- —
Market trends
- HPI YoY
- ▲ 0.19%
- Current HPI
- 146.5368
- Rent YoY
- —
- Metro
- —
- State GDP YoY
- —
- F500 in state
- 0
Price history
+110.0% since first listed3 events — show timeline
- 2026-05-21 Price Changed $94,500 FHAOR as distributed by MLS GRID
- 2026-04-10 Listed $99,900 FHAOR as distributed by MLS GRID
- 2006-07-01 Sold (Public Records) $45,000 Public Records
Property tax history
+1.6%/yrLatest (2025): $1,082 · +2.8% YoY. Source: county tax records.
Cash-flow waterfall
monthlySold comps — $/sqft
last 12 mo · ≤1 miLoading sold comps…