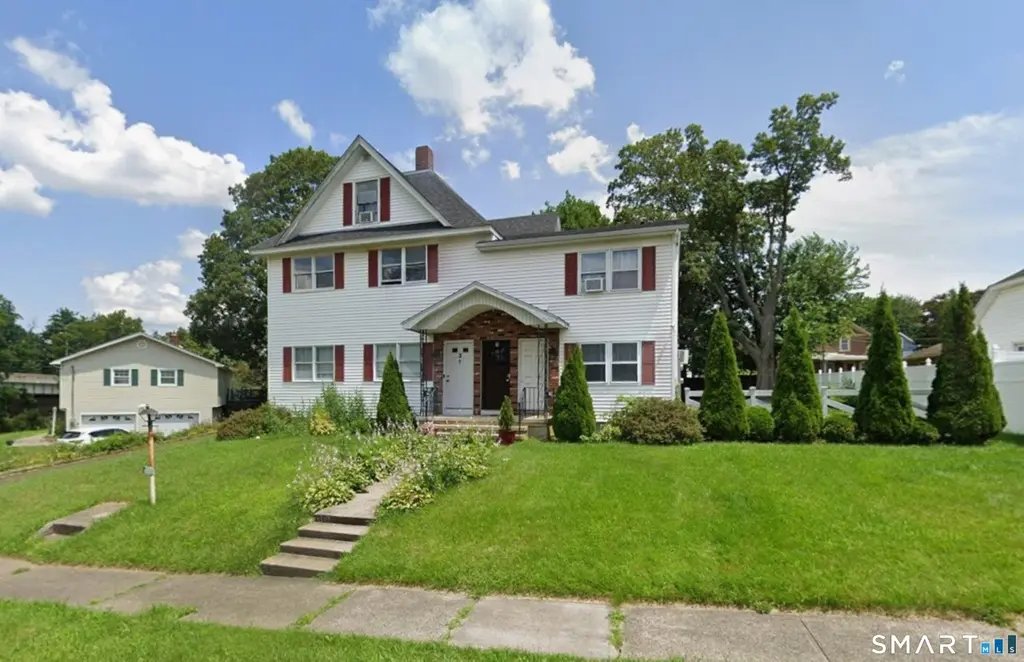
7 Davis St #2 · Danbury, CT
Flood risk 1/10 · Minimal
- FEMA flood zone
- X (unshaded)
- Chance of flooding over 30 yrs
- 0.0%
- Est. flood insurance / yr
- $507 – $1,088
Fire risk 1/10 · Minimal
- Est. fire insurance / yr
- $829 – $1,539
Heat risk 5/10 · Moderate
- Hot days now (above 99°F)
- 7 days/yr
- Hot days in 30 yrs
- 15 days/yr
Wind risk 5/10 · Moderate
- Chance of severe wind over 30 yrs
- 24.0%
Air-quality risk 3/10 · Minor
- Unhealthy air days now
- 3 days/yr
- Unhealthy air days in 30 yrs
- 4 days/yr
Risk factors via First Street. Map © Google.
Why this score? — see what drove the C grade
The composite is a weighted blend of 9 inputs, each scored 0–100. Each bar is that input's sub-score; the figure is the points it added to the 100-point composite (weight × sub-score).
- Cash flow +22.1/30.0
- ARV discount +7.5/15.0
- DSCR +7.1/10.0
- 1% rule +6.5/10.0
- Livability +3.8/5.0
- Rent growth +3.3/5.0
- Condition / age +2.5/5.0
- Schools +2.4/10.0
- Appreciation +0.0/10.0
$279,900
🖨 Deal sheet 📄 Offer letter ✓ Due diligence
Listing remarks
" THIS PROPERTY IS BEING SOLD AS IS". This is an opportunity to use your imagination and creativity to renovate this four bedroom one bath condominium unit. The unit is a self managed condominium complex consisting of three separate condos. Renovations are mostly cosmetic and investors or home buyers are welcome to remodel for resale or living purposes. Included is a separate basement area which can be used for storage purposes and laundry with hook-ups. The location is near I-84 for commuting, restaurants, shopping and recreation areas, Bring your ideas and take advantage of this investment or home buying opportunity in a busy Real Estate Spring Market.
Key facts
- Near i-84
- Shopping
- Laundry hook-ups
Tags
Property features AI
Finance
- Other: Pets allowed with restrictions (inquire for details)
- HOA & community: Monthly HOA fee of $203; HOA covers grounds maintenance, trash pickup, snow removal, water, sewer, and property management; Has homeowners association
Exterior
- Parking: Parking available in rear
- Utilities: Public water connected; Public sewer connected
- Home design: Condominium (unit in a 3-unit complex); End unit; Located on the 2nd floor
- Construction: Frame construction
- Exterior features: Vinyl siding; Lightly wooded, level lot
Interior
- Kitchen: Oven/Range; Microwave; Refrigerator
- Bedrooms: 4 bedrooms (unit spans 2 levels)
- Bathrooms: 1 full bathroom
- Heating & cooling: Oil-fired baseboard heating; Fuel tank located in basement
- Interior features: 6 total rooms; Partial, unfinished basement with concrete floor and storage; Walk-up attic
- Laundry & utility: 30-gallon hot water tank located in basement
Neighborhood map
What this means for you Summary
Snapshot
- This is a 4-bed/1.0-bath condo listed at $280k.
Deal economics
- At list price, monthly cash flow is $453 ($5k/yr) — positive.
- The deal already cash-flows at list — no discount required.
- Meets the 1% rule at list price ($3k rent vs $280k).
- Recommended offer: $272k (3.0% below list) — sets the bar for market timing.
- Cap rate 8.2% vs local median 3.6% in Danbury — top-decile yield for the area; either an underpriced asset or a hidden risk that comps aren't pricing in. Stress-test before assuming the spread holds.
Location & tenants
- Location reads 76/100 on livability (#51 in CT, #3,379 nationally) — a middle-class / working-renter tenant base. Strengths: commute A+, housing A+, health & safety A+; Watch: amenities F, cost of living F.
- Danbury School District (urban): math 19% / reading 32% proficiency, ranked #131 of 153 in CT (top 86%) — low school quality limits family demand, transient renter base, plan for 1-2y turnover.
- Zoned schools: Danbury High School (math 19% / reading 41%, grade F, #137 of 194 statewide, top 70%, 3,590 students, 48% FRL).
- Market conditions: Rents rising (+3.1%/yr); 197 active listings in the ZIP; 8 comparable units currently listed for rent nearby; rentals at typical pace (median 24d on market — plan ~3-4 weeks tenant-placement turnaround); solid renter incomes; 1,151 units permitted in Western Connecticut Planning Region in 2024 (714 in 5+ unit buildings).
- At $3,220/mo this rent would consume 50% of the median local household income ($77k/yr) (locally 3255% of renters already pay >50% of income on rent) — very limited rent-growth headroom before tenants either downsize or default.
Forward outlook
- Local home prices are declining (-3.0%/yr); year-one equity from $2k of loan paydown is wiped out by about $8k of value loss. Plan a longer hold.
Negotiation context
- It's been on market 43 days — a 3% lower offer ($272k) is reasonable based on typical stale-listing flexibility.
- 3 sale attempts since 29y ago with the ask held roughly flat each time — persistent listings suggest the price (not the market) is what's stuck; bring a comps-based counter.
Risks & watch-outs
- Climate carrying-cost: moderate wind risk, 24% chance of damaging wind over 30y; extreme-heat days projected 7→15/yr by 2055 (HVAC capex compounding) — expect insurance premiums to compound above CPI over the hold.
Questions for the listing agent
- It's been on market 43 days. Have you received any prior offers? Is the seller open to a 3% concession, seller financing, or rate buy-down credit?
- Built in 1978 — when were the roof, HVAC, electrical panel, plumbing, and water heater last replaced?
- What does the HOA fee cover, when was the last increase, and are there any pending special assessments or reserve-fund shortfalls?
- Any open or pending special assessments — roof, HVAC, plumbing, elevator, façade? What's the per-unit balance and payoff schedule, and is the seller paying it off at close or rolling it to the buyer?
- Is there a deadline driving the sale (1031 exchange, divorce, estate, relocation)? That informs how much negotiation room exists.
- Schools are D-rated, which usually means shorter tenancies and higher turnover. Who's the typical renter profile here, and what's been the actual vacancy rate?
- What's the average days-on-market for RENTAL listings here right now (not sales)? A rising rental-DOM trend means longer vacancies and softer asking-rent achievability than the comps imply.
- What's the recent tenant-quality profile in this submarket — average credit score on applications, eviction rate, late-payment / NSF rate, and stable-employment percentage? A property-management company in the area should have these aggregated.
- How much new apartment / multifamily construction is in the pipeline within 1–3 miles? Heavy new supply (>2% of stock underway) typically softens rents 12–24 months out; light construction supports rent growth.
Investment metrics
- 1% rule
- 1.15% ✓
- Cap rate
- 8.24%
- Cash-on-cash
- 6.94%
- DSCR
- 1.31
- GRM
- 7.2
CMA / ARV
No comps found within radius.
Projected returns pro-forma
-3.0% appreciation · 3.08% rent growth · sell at horizon
- IRR
- -5.5%
- Equity multiple
- 0.79×
- Total profit
- $-16,078
- Equity at exit
- $41,734
- IRR
- 4.3%
- Equity multiple
- 1.32×
- Total profit
- $24,833
- Equity at exit
- $24,201
Cash invested: $78,372 (down + closing). Projections, not guarantees.
Landlord ↔ Tenant lean methodology
- Overall (STATE)
- 27 Tenant-Leaning
- State Connecticut
- 27 Tenant-Leaning · D+7
- County
- — inherits STATE
- City
- — inherits STATE
ZIP-level market 06810
- Rents YoY
- 3.1%
- Active inventory
- 197
- Price-to-rent
- 7.2×
Monthly cashflow live
- Estimated rent
- $3,220 high interval (Pro) →
- Mortgage (P&I)
- −$1,468
- Tax from tax record
- −$303 /mo · $3,639/yr
- Insurance
- −$117
- HOA
- −$203
- Vacancy / Maint / Mgmt
- −$676
- Net cashflow
- $453
Break-even live
UW: 25.0% down · 7.5% · 30yr · 1.5% tax · 5.0% vac · 8.0% maint · 8.0% mgmt
Financing live
Cash to close
- Down payment
- $69,975
- Closing costs
- $8,397
- Reserves months
- —
- Total cash needed
- —
Loan-product check · same deal, 3 products live
Conventional
25% down · 7.5% · 30yr
- Down + closing
- —
- Monthly P&I
- —
- Monthly cashflow
- —
- DSCR
- —
- Eligible?
- —
Personal DTI + credit; lowest rate.
DSCR
20% down · 8.5% · 30yr
- Down + closing
- —
- Monthly P&I
- —
- Monthly cashflow
- —
- DSCR
- —
- Eligible?
- —
No personal income docs; deal must DSCR.
Hard money
10% down · 12.0% · 12mo
- Down + closing
- —
- Monthly P&I
- —
- Monthly cashflow
- —
- DSCR
- —
- Eligible?
- —
Short-term bridge; refi at stabilization.
Rent comps 8 comps
| Address | Beds | Baths | Sqft | Rent | $/sqft | DOM | Units | Dist |
|---|---|---|---|---|---|---|---|---|
| 10 Clapboard Ridge Rd Danbury, CT | 1.0–3.0 | 1.0–2.0 | 1061 | $3,308 | $3.12 | 2d | 20 | 0.42mi |
| 8 Rose St Unit 26-14 Danbury, CT | 3.0 | 1.5 | 1370 | $3,000 | $2.19 | 3d | 1 | 0.58mi |
| 6 Barnum Ct #6 Danbury, CT | 3.0 | 2.5 | 1620 | $3,200 | $1.98 | 14d | 1 | 0.64mi |
| 10 Balmforth Ave Unit 11 Danbury, CT | 3.0 | 2.0 | 980 | $2,700 | $2.76 | 43d | 1 | 0.88mi |
| 9 Concord St Unit 3 Danbury, CT | 3.0 | 1.0 | 1160 | $2,600 | $2.24 | 43d | 1 | 1.12mi |
| 113 Park Ave Unit 7 Danbury, CT | 3.0 | 1.5 | 1205 | $3,000 | $2.49 | 23d | 1 | 1.20mi |
| 25 Padanaram Rd #14 Danbury, CT | 3.0 | 2.5 | 1335 | $3,000 | $2.25 | 43d | 1 | 1.25mi |
| 68 Grand St Danbury, CT | 3.0 | 1.0 | 1480 | $1,900 | $1.28 | 3d | 1 | 1.26mi |
HOA detail condo
- Monthly dues
- $203 · $2,436/yr
- Assessments
- None detected in remarks — confirm with the listing agent.
Listing history 6 events
-
2026-04-27historical Under Contract - Continue to Show
-
2026-04-16$279,900 Active
-
1998-11-30historical
-
1998-08-27$79,900
-
1998-04-30historical
-
1997-10-22$69,900
ⓘ Source: listings_history table (triggers on properties + properties_extension) + one-shot
backfill from property_details.listing_events for pre-trigger history.
Tax reassessment forecast CT · Partial reset (capped growth)
- Current annual tax
- $3,639 · $303/mo
- Projected year-2 tax
- $4,814 · $401/mo
- Expected delta
- +$1,175/yr (+$98/mo · 32.3%)
ⓘ Screening estimate from a state-policy table — verify with the county assessor before closing.
Climate risk First Street
- Flood 1/10 Low FEMA zone X (unshaded) · 0% chance over 30 yrs
- Wildfire 1/10 Low
- Heat 5/10 Major 7 d/yr ≥99°F today · 15 d/yr by 30 yrs out
- Wind 5/10 Major 24% chance of damaging wind over 30 yrs
- Air quality 3/10 Moderate 3 unhealthy d/yr today · 4 by 30 yrs out
Nearby sold comps map
Loading sold comps map…
Walkable amenities ~0.75 mi
Loading nearby amenities…
Taxation est. · year 1
- Rental income
- $38,644
- − Mortgage interest
- −$15,679
- − Property taxes
- −$3,639
- − Insurance
- −$1,400
- − Repairs & maintenance
- −$3,091
- − Management
- −$3,091
- − HOA
- −$2,436
- − Depreciation
- −$8,143
- Taxable income
- $1,165
- Est. tax owed @ 24.0%
- −$280
- After-tax cash flow
- $5,161/yr
For passive investors: Depreciation is non-cash, so a rental often shows a tax loss while cash-flowing — sheltering income. Rental losses are passive: they offset passive income freely, and up to $25,000/yr can offset ordinary (W-2) income if you actively participate and your MAGI is under $100k (phasing out to $0 by $150k); unused losses carry forward. On sale, claimed depreciation is recaptured at up to 25%, and gains may owe capital-gains tax (a 1031 exchange can defer both). Figures are a year-1 estimate at your 24.0% rate — not tax advice; consult a CPA.
Schools (NCES district)
- District
- Danbury School District
- NCES district ID
- 0901020
- Math proficiency
- 19% ▼ -17.00%
- Reading proficiency
- 32% ▼ -16.00%
- Median HH income
- $65,793
- Composite
- 23.93/100
- National rank
- #7784
- State rank
- #131 of 153 in CT
Livability — Danbury
- Score
- 76/100
- State rank
- #51
- US rank
- #3379
Category grades
Schools grade is shown separately in the Schools card above.
Census & demographics
- Census place
- Danbury, CT
- County
- Fairfield County · 765,532 people
- City population
- 87,061
- Metro
- Bridgeport-Stamford-Norwalk, CT
- Population (ZIP)
- 55,833
- Household income
- $76,933
- Rent vs Own
- Severe rent burden
- 3255.0
Population outlook (Western Connecticut County) Hauer SSP2
- By 2040
- 685,031
Race, ethnicity, and origin ACS 2023
- Neighborhood character
- Highly diverse neighborhood (Simpson 0.72)
- Race & ethnicity
- Hispanic / Latino 37% White 35% Two or more races 19% Black 12% Asian 5%
- Hispanic origin (detail)
- Mexican 4% Puerto Rican 3% Dominican 6%
- Common ancestry
- Estonian 8% Russian 4% Romanian 3%
- Foreign-born
- 41% · Canada, Jamaica, Dominican Republic
- Languages at home
- 48% English-only · Spanish 32% Other Indo-European 16% Other Asian/Pacific 1%
Political lean MEDSL · Western Connecticut
- 2024 margin
- D (+19.1) · D 58.8% · R 39.7% · Other 1.6%
- All cycles
- 2024: D+19.1
Not yet ingested
- Civics
- —
Market trends
- HPI YoY
- ▼ -309.71%
- Current HPI
- 286.5484
- Rent YoY
- ▲ 3.08%
- Metro
- Bridgeport-Stamford-Norwalk, CT
- State GDP YoY
- ▲ 1.06%
- F500 in state
- 38
Industry mix (Fortune 500 HQ in CT)
| Industry | F500 HQs | Revenue |
|---|---|---|
| Industrial Machinery | 4 | $38B |
|
||
| Insurance | 3 | $71B |
|
||
| Financial Services | 2 | $25B |
|
||
| Transportation / Logistics | 2 | $18B |
|
||
| Healthcare | 1 | $247B |
|
||
| Telecommunications | 1 | $55B |
|
||
Price history
+300.4% since first listed6 events — show timeline
- 2026-04-27 Contingent — Smart MLS
- 2026-04-16 Listed $279,900 Smart MLS
- 1998-11-30 Listing Removed — Smart MLS
- 1998-08-27 Listed $79,900 Smart MLS
- 1998-04-30 Listing Removed — Smart MLS
- 1997-10-22 Listed $69,900 Smart MLS
Property tax history
+1.6%/yrLatest (2023): $3,639 · +16.2% YoY. Source: county tax records.
Cash-flow waterfall
monthlySold comps — $/sqft
last 12 mo · ≤1 miLoading sold comps…