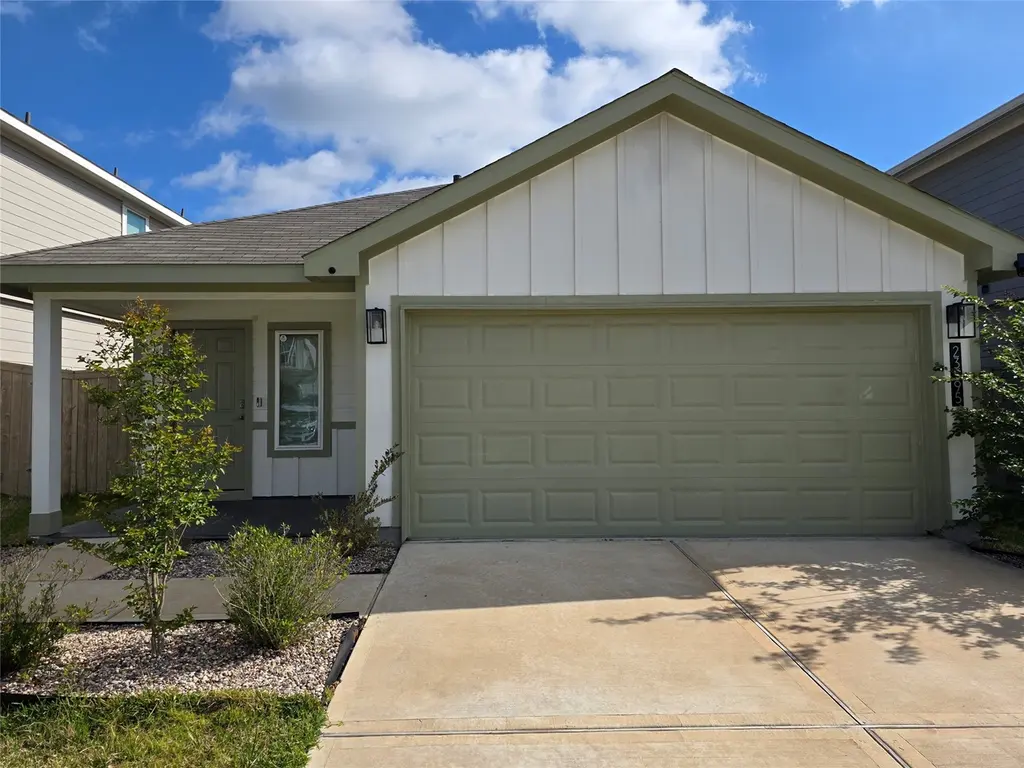
23595 Nectar Crest Hts · Splendora, TX
Flood risk 1/10 · Minimal
- FEMA flood zone
- X (unshaded)
- Chance of flooding over 30 yrs
- 0.0%
- Est. flood insurance / yr
- $507 – $1,088
Fire risk 3/10 · Minor
- Est. fire insurance / yr
- $1,222 – $2,270
Heat risk 9/10 · Severe
- Hot days now (above 110°F)
- 7 days/yr
- Hot days in 30 yrs
- 24 days/yr
Wind risk 8/10 · Major
- Chance of severe wind over 30 yrs
- 99.0%
Air-quality risk 2/10 · Minimal
- Unhealthy air days now
- 2 days/yr
- Unhealthy air days in 30 yrs
- 2 days/yr
Risk factors via First Street. Map © Google.
Why this score? — see what drove the D grade
The composite is a weighted blend of 9 inputs, each scored 0–100. Each bar is that input's sub-score; the figure is the points it added to the 100-point composite (weight × sub-score).
- ARV discount +14.7/15.0
- Cash flow +7.1/30.0
- 1% rule +4.8/10.0
- Condition / age +4.0/5.0
- Livability +3.1/5.0
- Rent growth +2.5/5.0
- Schools +2.5/10.0
- Appreciation +1.8/10.0
- DSCR +1.3/10.0
$186,000
🖨 Deal sheet (PDF) 📄 Offer letter ✓ Due diligence
Listing remarks MLS
Welcome to the beautiful community of Presswoods in Splendora TX! This home offers functional layout, beautiful, covered patio backyard, and spacious living areas ready for a buyer's personal touch. Convenient location with easy access to major roadways. Schools within walking distance of neighborhood. Schedule your showing today!
Key facts
- Convenient location
- 5,135 sq ft lot
- 2 garage spots
Tags
Neighborhood map
What this means for you Summary
Snapshot
- This is a 3-bed/2.0-bath single-family listed at $186k. Condition is rated good.
Deal economics
- At list price, monthly cash flow is $-267 ($-3k/yr) — negative.
- To cash-flow at today's rent, offer at most $146k (21.5% below list).
- To meet the 1% rule (rent ≥ 1% of price), the offer needs to be $182k (2.1% below list).
- Recommended offer: $146k (21.5% below list) — sets the bar for cash-flow.
Location & tenants
- Location reads 62/100 on livability (#911 in TX) — a middle-class / working-renter tenant base. Strengths: cost of living A+, housing A+; Watch: amenities F, commute F, health & safety F.
- Splendora ISD (rural): math 25% / reading 31% proficiency, ranked #648 of 826 in TX (top 78%) — low school quality limits family demand, transient renter base, plan for 1-2y turnover.
- Zoned schools: Piney Woods El (math 23% / reading 28%, grade F, #2,982 of 4,322 statewide, top 70%, 534 students, 55% FRL); Splendora J H (math 28% / reading 42%, grade F, #842 of 1,662 statewide, top 51%, 774 students, 62% FRL); Splendora H S (math 18% / reading 38%, grade F, #1,170 of 1,632 statewide, top 72%, 1,344 students, 59% FRL) — zoned schools at 59% FRL track the district average.
- Market conditions: 548 active listings in the ZIP; solid renter incomes; 13,259 units permitted in Montgomery County in 2024 (1,402 in 5+ unit buildings).
Forward outlook
- Local home prices are declining (-3.0%/yr); year-one equity from $1k of loan paydown is wiped out by about $6k of value loss. Plan a longer hold.
- Montgomery County population projected at +65% by 2050 — long-run rental-demand tailwind backs the buy-and-hold thesis.
Negotiation context
- It's been on market 83 days — a 6% lower offer ($175k) is reasonable based on typical stale-listing flexibility.
- 2 sale attempts; this cycle's ask has dropped $37k (17%) from the opening price — seller is motivated, your offer sets the floor, not the list.
Risks & watch-outs
- Watch-outs: property tax is 3.9% of price.
- Climate carrying-cost: severe wind risk, 99% chance of damaging wind over 30y; extreme-heat days projected 7→24/yr by 2055 (HVAC capex compounding) — expect insurance premiums to compound above CPI over the hold.
Questions for the listing agent
- What do current leases actually rent for vs. the listed asking? Can we see a recent rent roll and the last 12 months of T-12 income?
- It's been on market 83 days. Have you received any prior offers? Is the seller open to a 22% concession, seller financing, or rate buy-down credit?
- Property tax is high relative to price — has the assessment been appealed recently, and will the sale trigger a re-assessment?
- What does the HOA fee cover, when was the last increase, and are there any pending special assessments or reserve-fund shortfalls?
- Why hasn't it sold? Are there any deal-killer items the seller is aware of (foundation, flood, title, zoning, code violations)?
- Is there a deadline driving the sale (1031 exchange, divorce, estate, relocation)? That informs how much negotiation room exists.
- Schools are F-rated, which usually means shorter tenancies and higher turnover. Who's the typical renter profile here, and what's been the actual vacancy rate?
- The area grade is low — what's the realistic commute time and amenity access for the typical tenant pool here? Any planned neighborhood developments (good or bad) we should know about?
- What's the average days-on-market for RENTAL listings here right now (not sales)? A rising rental-DOM trend means longer vacancies and softer asking-rent achievability than the comps imply.
- What's the recent tenant-quality profile in this submarket — average credit score on applications, eviction rate, late-payment / NSF rate, and stable-employment percentage? A property-management company in the area should have these aggregated.
- How much new for-sale + rental construction is in the pipeline within 1–3 miles? Heavy new supply typically softens prices + rents 12–24 months out; constrained supply supports both.
Investment metrics
- 1% rule
- 0.98% ✗
- Cap rate
- 4.57%
- Cash-on-cash
- -6.15%
- DSCR
- 0.73
- GRM
- 8.5
CMA / ARV
- ARV (median comp)
- $221,469
- List price
- $186,000
- Delta
- -16.02%
- Verdict
- UNDERPRICED
- Comps
- 20 within 1.0 mi
Show comp detail 12 sales within ~0.75 mi
| Address | Dist | Beds/Ba | Sqft | Sold | Price | $/sf | Match |
|---|---|---|---|---|---|---|---|
| 23165 Teakwood Hills Dr | 0.40mi | 3/2.0 | 1,489 (-0%) | 3mo | $229,990 | $154 | 78 |
| 14319 Leafy Willow Dr | 0.35mi | 3/2.5 | 1,470 (-2%) | 1mo | $226,990 | $154 | 78 |
| 23231 Teakwood Hills Dr | 0.26mi | 4/2.0 (+1) | 1,572 (+5%) | 0mo | $222,990 | $142 | 74 |
| 23157 Teakwood Hills Dr | 0.43mi | 3/2.0 | 1,539 (+3%) | 2mo | $234,990 | $153 | 74 |
| 14363 Leafy Willow Dr | 0.41mi | 3/2.0 | 1,434 (-4%) | 2mo | $218,990 | $153 | 73 |
| 14340 Leafy Willow Dr | 0.36mi | 4/2.0 (+1) | 1,572 (+5%) | 2mo | $235,425 | $150 | 68 |
| 14327 Leafy Willow Dr | 0.36mi | 4/2.0 (+1) | 1,572 (+5%) | 3mo | $234,990 | $149 | 67 |
| 14609 Ivy Floral Way | 0.21mi | 3/2.0 | 1,280 (-14%) | 2mo | $208,990 | $163 | 65 |
| 13667 Kit Run | 0.71mi | 3/2.0 | 1,556 (+4%) | 2mo | $234,990 | $151 | 59 |
| 24114 Chirp St | 0.39mi | 3/2.0 | 1,280 (-14%) | 1mo | $221,990 | $173 | 57 |
| 23512 Skyward Ln | 0.53mi | 4/2.0 (+1) | 1,665 (+11%) | 1mo | $248,990 | $150 | 50 |
| 13674 Kit Run | 0.74mi | 3/2.0 | 1,331 (-11%) | 2mo | $204,990 | $154 | 46 |
Match score weights: distance 35% · size 25% · config 20% · recency 20%. Top-matched comps best support the ARV.
Projected returns pro-forma
-3.0% appreciation · 3.0% rent growth · sell at horizon
- IRR
- -26.7%
- Equity multiple
- 0.10×
- Total profit
- $-46,867
- Equity at exit
- $27,733
- IRR
- -23.3%
- Equity multiple
- -0.18×
- Total profit
- $-61,559
- Equity at exit
- $16,082
Cash invested: $52,080 (down + closing). Projections, not guarantees.
Landlord ↔ Tenant lean methodology
- Overall (STATE)
- 87 Strongly Landlord-Friendly
- State Texas
- 87 Strongly Landlord-Friendly · R+5
- County
- — inherits STATE
- City
- — inherits STATE
ZIP-level market 77372
- Home prices YoY
- -2.1%
- Active inventory
- 548
- Price-to-rent
- 8.5×
Monthly cashflow live
- Estimated rent
- $1,820 medium interval (Pro) →
- Mortgage (P&I)
- −$975
- Tax from tax record
- −$608 /mo · $7,298/yr
- Insurance
- −$78
- HOA
- −$44
- Vacancy / Maint / Mgmt
- −$382
- Net cashflow
- $-267
Break-even live
Sensitivity live
| Price | -10% $-162 | -5% $-214 | +0% $-267 | +5% $-320 | +10% $-372 |
|---|---|---|---|---|---|
| Rent | -10% $-411 | -5% $-339 | +0% $-267 | +5% $-195 | +10% $-123 |
| Rate | -1.0pp $-173 | -0.5pp $-220 | base $-267 | +0.5pp $-315 | +1.0pp $-364 |
UW: 25.0% down · 7.5% · 30yr · 1.5% tax · 5.0% vac · 8.0% maint · 8.0% mgmt
Financing live
Cash to close
- Down payment
- $46,500
- Closing costs
- $5,580
- Reserves months
- —
- Total cash needed
- —
Loan-product check · same deal, 3 products live
Conventional
25% down · 7.5% · 30yr
- Down + closing
- —
- Monthly P&I
- —
- Monthly cashflow
- —
- DSCR
- —
- Eligible?
- —
Personal DTI + credit; lowest rate.
DSCR
20% down · 8.5% · 30yr
- Down + closing
- —
- Monthly P&I
- —
- Monthly cashflow
- —
- DSCR
- —
- Eligible?
- —
No personal income docs; deal must DSCR.
Hard money
10% down · 12.0% · 12mo
- Down + closing
- —
- Monthly P&I
- —
- Monthly cashflow
- —
- DSCR
- —
- Eligible?
- —
Short-term bridge; refi at stabilization.
HOA detail
- Monthly dues
- $44 · $528/yr
Listing history 18 events
-
2026-06-21days on market $186,000 Active 83 DOM
-
2026-06-18days on market $186,000 Active 80 DOM
-
2026-06-17days on market $186,000 Active 79 DOM
-
2026-06-16days on market $186,000 Active 78 DOM
-
2026-06-15days on market $186,000 Active 77 DOM
-
2026-06-13days on market $186,000 Active 75 DOM
-
2026-06-13days on market $186,000 Active 74 DOM
-
2026-06-09days on market $186,000 Active 71 DOM
-
2026-06-08days on market $186,000 Active 70 DOM
-
2026-06-07days on market $186,000 Active 69 DOM
-
2026-06-04days on market $186,000 Active 66 DOM
-
2026-06-03days on market $186,000 Active 65 DOM
-
2026-06-02days on market $186,000 Active 64 DOM
-
2026-06-01days on market $186,000 Active 63 DOM
-
2026-05-31days on market $186,000 Active 62 DOM
-
2026-03-30$222,900 Active 332-char remark
Show marketing remark (332 chars)
Welcome to the beautiful community of Presswoods in Splendora TX! This home offers functional layout, beautiful, covered patio backyard, and spacious living areas ready for a buyer's personal touch. Convenient location with easy access to major roadways. Schools within walking distance of neighborhood. Schedule your showing today!
-
2025-08-30historical $1,975
-
2025-08-19$1,975
ⓘ Source: listings_history table (triggers on properties + properties_extension) + one-shot
backfill from property_details.listing_events for pre-trigger history.
Tax reassessment forecast TX · Resets to sale price
- Current annual tax
- $7,298 · $608/mo
- Projected year-2 tax
- $7,298 · $608/mo
- Expected delta
- $0/yr ($0/mo · 0.0%)
ⓘ Screening estimate from a state-policy table — verify with the county assessor before closing.
Climate risk First Street
- Flood 1/10 Low FEMA zone X (unshaded) · 0% chance over 30 yrs
- Wildfire 3/10 Moderate
- Heat 9/10 Extreme 7 d/yr ≥110°F today · 24 d/yr by 30 yrs out
- Wind 8/10 Severe 99% chance of damaging wind over 30 yrs
- Air quality 2/10 Low 2 unhealthy d/yr today · 2 by 30 yrs out
Nearby sold comps map
Loading sold comps map…
Walkable amenities ~0.75 mi
Loading nearby amenities…
Taxation est. · year 1
- Rental income
- $21,843
- − Mortgage interest
- −$10,419
- − Property taxes
- −$7,298
- − Insurance
- −$930
- − Repairs & maintenance
- −$1,747
- − Management
- −$1,747
- − HOA
- −$528
- − Depreciation
- −$5,411
- Taxable loss
- −$6,238
- Est. tax savings @ 24.0%
- +$1,497
- After-tax cash flow
- $-1,708/yr
For passive investors: Depreciation is non-cash, so a rental often shows a tax loss while cash-flowing — sheltering income. Rental losses are passive: they offset passive income freely, and up to $25,000/yr can offset ordinary (W-2) income if you actively participate and your MAGI is under $100k (phasing out to $0 by $150k); unused losses carry forward. On sale, claimed depreciation is recaptured at up to 25%, and gains may owe capital-gains tax (a 1031 exchange can defer both). Figures are a year-1 estimate at your 24.0% rate — not tax advice; consult a CPA.
Condition & rehab AI · 13 photos
The home is in good condition with no major repairs needed. It has a good curb appeal and is ready for a buyer's personal touch. Painting the exterior and making some landscaping improvements could further enhance its resale value.
Value-add opportunities
- Resale Painting the exterior siding and roof — Painting the exterior can enhance the home's curb appeal and increase its resale value.
- Resale Landscaping improvements — Landscaping improvements can enhance the home's curb appeal and increase its resale value.
- Resale Kitchen and bathroom updates — Updating the kitchen and bathrooms can increase the home's resale value by making it more attractive to potential buyers.
Renovation cost estimate screening
Value-add ROI direction
- Resale Painting the exterior siding and roof — Painting the exterior can enhance the home's curb appeal and increase its resale value. ↑
- Resale Landscaping improvements — Landscaping improvements can enhance the home's curb appeal and increase its resale value. ↑
- Resale Kitchen and bathroom updates — Updating the kitchen and bathrooms can increase the home's resale value by making it more attractive to potential buyers. ↑
ⓘ Cost ranges are severity-bucket heuristics (US national rule-of-thumb). Get contractor quotes + a written scope before underwriting a rehab budget.
Schools (NCES district)
- District
- Splendora ISD
- NCES district ID
- 4841070
- Math proficiency
- 25% ▼ -8.00%
- Reading proficiency
- 31% ▼ -1.00%
- Median HH income
- $54,166
- Composite
- 24.92/100
- National rank
- #7572
- State rank
- #648 of 826 in TX
Livability — Splendora
- Score
- 62/100
- State rank
- #911
- US rank
- #16335
Category grades
Schools grade is shown separately in the Schools card above.
Census & demographics
- County
- Montgomery County · 663,713 people
- City population
- 14,367
- Metro
- Houston-The Woodlands-Sugar Land, TX
- Population (ZIP)
- 14,367
- Household income
- $79,085
- Rent vs Own
- Severe rent burden
- 135.0
Population outlook (Montgomery County) Hauer SSP2
- Today (2025)
- 713,896 people
- By 2030
- 805,263 · +12.8%
- By 2040
- 992,708 · +39.1%
- By 2050
- 1,179,590 · +65.2%
- By 2075
- 1,628,084 · +128.1%
- By 2100
- 1,937,880 · +171.5%
Race, ethnicity, and origin ACS 2023
- Neighborhood character
- Majority White (61%)
- Race & ethnicity
- White 61% Hispanic / Latino 36% Two or more races 9% Native American 1%
- Hispanic origin (detail)
- Mexican 32%
- Common ancestry
- Lithuanian 4% Italian 2% Slovak 1%
- Foreign-born
- 9% · Canada
- Languages at home
- 71% English-only · Spanish 28%
Political lean MEDSL · Montgomery
- 2024 margin
- Solid R (+45.5) · D 26.8% · R 72.3%
- 2008→2024 swing
- +7.2pp toward D · 2008: -52.7pp · 2024: -45.5pp
- All cycles
- 2024: R+45.5 2020: R+43.8 2016: R+51.4 2012: R+60.7 2008: R+52.7
Not yet ingested
- Civics
- —
Market trends
- HPI YoY
- ▼ -6.47%
- Current HPI
- 306.9962
- Rent YoY
- —
- Metro
- Houston-The Woodlands-Sugar Land, TX
- State GDP YoY
- ▲ 3.95%
- F500 in state
- 110
Industry mix (Fortune 500 HQ in TX)
| Industry | F500 HQs | Revenue |
|---|---|---|
| Energy | 16 | $1,198B |
|
||
| Technology | 5 | $198B |
|
||
| Engineering / Construction | 4 | $72B |
|
||
| Energy Services | 3 | $60B |
|
||
| Utilities | 3 | $41B |
|
||
| Healthcare | 2 | $330B |
|
||
Price history
+11186.1% since first listed3 events — show timeline
- 2026-03-30 Listed $222,900 HARMLS
- 2025-08-30 Rental Removed $1,975 HARMLS
- 2025-08-19 Listed for Rent $1,975 HARMLS
Property tax history
+274.3%/yrLatest (2025): $7,298 · +406.7% YoY. Source: county tax records.
Cash-flow waterfall
monthlySold comps — $/sqft
last 12 mo · ≤1 miLoading sold comps…