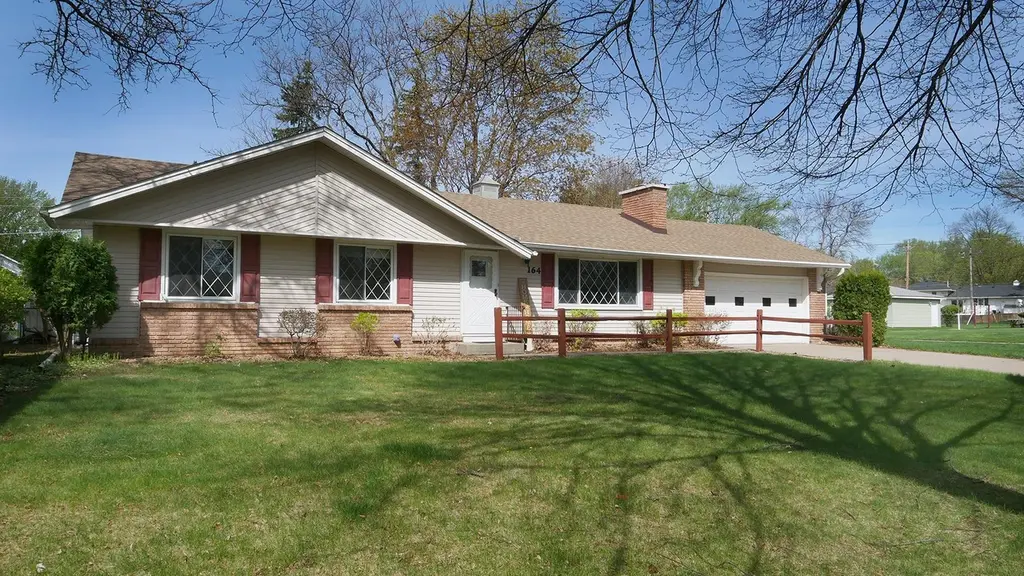
164 Linden Dr · Apple Valley, MN
Flood risk 1/10 · Minimal
- FEMA flood zone
- X (unshaded)
- Chance of flooding over 30 yrs
- 0.0%
- Est. flood insurance / yr
- $507 – $1,088
Fire risk 1/10 · Minimal
- Est. fire insurance / yr
- $888 – $1,650
Heat risk 2/10 · Minimal
- Hot days now (above 100°F)
- 7 days/yr
- Hot days in 30 yrs
- 14 days/yr
Wind risk 2/10 · Minimal
- Chance of severe wind over 30 yrs
- —
Air-quality risk 2/10 · Minimal
- Unhealthy air days now
- 1 days/yr
- Unhealthy air days in 30 yrs
- 1 days/yr
Risk factors via First Street. Map © Google.
Why this score? — see what drove the D grade
The composite is a weighted blend of 9 inputs, each scored 0–100. Each bar is that input's sub-score; the figure is the points it added to the 100-point composite (weight × sub-score).
- Cash flow +11.5/30.0
- ARV discount +7.5/15.0
- Schools +4.9/10.0
- Livability +4.3/5.0
- DSCR +3.4/10.0
- Rent growth +3.3/5.0
- 1% rule +2.9/10.0
- Condition / age +2.5/5.0
- Appreciation +0.0/10.0
$365,000
🖨 Deal sheet (PDF) 📄 Offer letter ✓ Due diligence
Listing remarks
Superbly maintained Apple Valley Rambler with 4 bedrooms on the main level. Large primary bedroom with private 3/4 bath. Hardwood flooring under the carpeting on the main floor. Newer furnace and A/C. Vaulted ceilings. Huge lower level amusement room. Large utility room with separate storage room including freezer. Water filtration system. Large corner lot with covered and glassed in porch providing covered access from home to the attached 2 car garage. Must see supplements and virtual tour!
Key facts
- Hardwood flooring
- Covered porch
- Newer furnace
Tags
Property features AI
Finance
- Other: Main level finished area and other size details available (total living area and building area totals provided)
- Financial info: Property reported as free and clear
Exterior
- Parking: Attached 2-car garage (22 x 22)
- Utilities: City water (connected); City sewer (connected); Electric service with fuses; Natural gas
- Home design: Residential property; One-level living (main living on one level); Living area arranged above and below grade (above grade finished area and finished lower level); Irregular lot dimensions; Facing along a city street with public road maintenance
- Construction: Block construction; Foundation: block; Roof replaced/age 8 years or less; Year built information not provided
- Exterior features: Corner lot with medium tree coverage; Vinyl exterior; Covered/enclosed/glass-enclosed porch
Interior
- Kitchen: Range; Dishwasher; Refrigerator
- Bedrooms: 4 bedrooms (three on main level; one bedroom on lower level noted as Amusement Room on lower level)
- Flooring: Hardwood floors
- Bathrooms: One full main-floor bathroom; Primary bathroom is a private 3/4 bath
- Heating & cooling: Forced air heating; Central air conditioning
- Interior features: Finished full basement with block foundation; Wood-burning fireplace; Informal dining area; Porch (covered, enclosed, glass-enclosed)
- Laundry & utility: Washer and dryer included; Laundry located in basement (also note of 2nd floor laundry in special search)
Neighborhood map
What this means for you Summary
Snapshot
- This is a 4-bed/2.0-bath single-family listed at $365k.
Deal economics
- At list price, monthly cash flow is $-119 ($-1k/yr) — negative.
- To cash-flow at today's rent, offer at most $344k (5.8% below list).
- To meet the 1% rule (rent ≥ 1% of price), the offer needs to be $290k (20.5% below list).
- Recommended offer: $290k (20.5% below list) — sets the bar for 1% rule.
- Cap rate 5.9% vs local median 4.0% in Apple Valley — top-decile yield for the area; either an underpriced asset or a hidden risk that comps aren't pricing in. Stress-test before assuming the spread holds.
Location & tenants
- Location reads 86/100 on livability (#10 in MN, #379 nationally) — a professional / high-income tenant draw. Strengths: commute A+, employment A+, housing A+; Watch: amenities F.
- Rosemount-Apple Valley-Eagan (suburban): math 50% / reading 58% proficiency, ranked #58 of 301 in MN (top 19%) — acceptable for families but not a draw, mixed tenant base, ~2y average lease; only 18% free/reduced lunch — higher-income household profile.
- Market conditions: Rents rising (+3.3%/yr); 277 active listings in the ZIP; 2 comparable units currently listed for rent nearby; solid renter incomes; 2,134 units permitted in Dakota County in 2024 (898 in 5+ unit buildings).
- This rent runs 36% of the median local income ($98k/yr) — at the standard rent-burdened threshold; future hikes will face affordability resistance.
Forward outlook
- Local home prices are declining (-3.0%/yr); year-one equity from $3k of loan paydown is wiped out by about $11k of value loss. Plan a longer hold.
- Dakota County population projected at +11% by 2050 — modest demand growth; plan on rents tracking national, not racing it.
Negotiation context
- Only 11 days on market — expect competitive offers; lowballing is unlikely to land.
Questions for the listing agent
- What do current leases actually rent for vs. the listed asking? Can we see a recent rent roll and the last 12 months of T-12 income?
- Built in 1963 — when were the roof, HVAC, electrical panel, plumbing, and water heater last replaced?
- Is there a deadline driving the sale (1031 exchange, divorce, estate, relocation)? That informs how much negotiation room exists.
- Schools are B-rated — typically a magnet for longer-tenancy family renters. What's the average tenant stay here, and is there a school-zone premium baked into asking?
- The area grade is low — what's the realistic commute time and amenity access for the typical tenant pool here? Any planned neighborhood developments (good or bad) we should know about?
- What's the average days-on-market for RENTAL listings here right now (not sales)? A rising rental-DOM trend means longer vacancies and softer asking-rent achievability than the comps imply.
- What's the recent tenant-quality profile in this submarket — average credit score on applications, eviction rate, late-payment / NSF rate, and stable-employment percentage? A property-management company in the area should have these aggregated.
- How much new for-sale + rental construction is in the pipeline within 1–3 miles? Heavy new supply typically softens prices + rents 12–24 months out; constrained supply supports both.
Investment metrics
- 1% rule
- 0.79% ✗
- Cap rate
- 5.90%
- Cash-on-cash
- -1.40%
- DSCR
- 0.94
- GRM
- 10.5
CMA / ARV
No comps found within radius.
Projected returns pro-forma
-3.0% appreciation · 3.27% rent growth · sell at horizon
- IRR
- -18.3%
- Equity multiple
- 0.35×
- Total profit
- $-65,980
- Equity at exit
- $54,423
- IRR
- -10.2%
- Equity multiple
- 0.37×
- Total profit
- $-64,080
- Equity at exit
- $31,559
Cash invested: $102,200 (down + closing). Projections, not guarantees.
Landlord ↔ Tenant lean methodology
- Overall (STATE)
- 46 Balanced
- State Minnesota
- 46 Balanced · D+2
- County
- — inherits STATE
- City
- — inherits STATE
ZIP-level market 55124
- Rents YoY
- 3.3%
- Active inventory
- 277
- Price-to-rent
- 10.5×
Monthly cashflow live
- Estimated rent
- $2,901 medium interval (Pro) →
- Mortgage (P&I)
- −$1,914
- Tax from tax record
- −$345 /mo · $4,142/yr
- Insurance
- −$152
- HOA
- −$0
- Vacancy / Maint / Mgmt
- −$609
- Net cashflow
- $-119
Break-even live
Sensitivity live
| Price | -10% $87 | -5% $-16 | +0% $-119 | +5% $-223 | +10% $-326 |
|---|---|---|---|---|---|
| Rent | -10% $-349 | -5% $-234 | +0% $-119 | +5% $-5 | +10% $110 |
| Rate | -1.0pp $64 | -0.5pp $-26 | base $-119 | +0.5pp $-214 | +1.0pp $-310 |
UW: 25.0% down · 7.5% · 30yr · 1.5% tax · 5.0% vac · 8.0% maint · 8.0% mgmt
Financing live
Cash to close
- Down payment
- $91,250
- Closing costs
- $10,950
- Reserves months
- —
- Total cash needed
- —
Loan-product check · same deal, 3 products live
Conventional
25% down · 7.5% · 30yr
- Down + closing
- —
- Monthly P&I
- —
- Monthly cashflow
- —
- DSCR
- —
- Eligible?
- —
Personal DTI + credit; lowest rate.
DSCR
20% down · 8.5% · 30yr
- Down + closing
- —
- Monthly P&I
- —
- Monthly cashflow
- —
- DSCR
- —
- Eligible?
- —
No personal income docs; deal must DSCR.
Hard money
10% down · 12.0% · 12mo
- Down + closing
- —
- Monthly P&I
- —
- Monthly cashflow
- —
- DSCR
- —
- Eligible?
- —
Short-term bridge; refi at stabilization.
Rent comps 2 comps
| Address | Beds | Baths | Sqft | Rent | $/sqft | DOM | Units | Dist |
|---|---|---|---|---|---|---|---|---|
| 14649 Harrington Pl Saint Paul, MN | 5.0 | 2.0 | 2062 | $2,895 | $1.40 | 15d | 1 | 0.40mi |
| 710 E 143rd St Burnsville, MN | 3.0 | 2.0 | 1790 | $2,395 | $1.34 | 2d | 1 | 1.32mi |
Listing history 3 events
-
2026-05-12status Pending
-
2026-05-05historical Contingent - Inspection
-
2026-05-01$365,000 Active
ⓘ Source: listings_history table (triggers on properties + properties_extension) + one-shot
backfill from property_details.listing_events for pre-trigger history.
Tax reassessment forecast MN · Partial reset (capped growth)
- Current annual tax
- $4,142 · $345/mo
- Projected year-2 tax
- $4,142 · $345/mo
- Expected delta
- $0/yr ($0/mo · 0.0%)
ⓘ Screening estimate from a state-policy table — verify with the county assessor before closing.
Climate risk First Street
- Flood 1/10 Low FEMA zone X (unshaded) · 0% chance over 30 yrs
- Wildfire 1/10 Low
- Heat 2/10 Low 7 d/yr ≥100°F today · 14 d/yr by 30 yrs out
- Wind 2/10 Low
- Air quality 2/10 Low 1 unhealthy d/yr today · 1 by 30 yrs out
Nearby sold comps map
Loading sold comps map…
Walkable amenities ~0.75 mi
Loading nearby amenities…
Taxation est. · year 1
- Rental income
- $34,815
- − Mortgage interest
- −$20,446
- − Property taxes
- −$4,142
- − Insurance
- −$1,825
- − Repairs & maintenance
- −$2,785
- − Management
- −$2,785
- − Depreciation
- −$10,618
- Taxable loss
- −$7,786
- Est. tax savings @ 24.0%
- +$1,869
- After-tax cash flow
- $437/yr
For passive investors: Depreciation is non-cash, so a rental often shows a tax loss while cash-flowing — sheltering income. Rental losses are passive: they offset passive income freely, and up to $25,000/yr can offset ordinary (W-2) income if you actively participate and your MAGI is under $100k (phasing out to $0 by $150k); unused losses carry forward. On sale, claimed depreciation is recaptured at up to 25%, and gains may owe capital-gains tax (a 1031 exchange can defer both). Figures are a year-1 estimate at your 24.0% rate — not tax advice; consult a CPA.
Schools (NCES district)
- District
- Rosemount-Apple Valley-Eagan
- NCES district ID
- 2732390
- Math proficiency
- 50% ▼ -14.00%
- Reading proficiency
- 58% ▼ -7.00%
- Median HH income
- $85,559
- Composite
- 49.48/100
- National rank
- #2000
- State rank
- #58 of 301 in MN
Livability — Apple Valley
- Score
- 86/100
- State rank
- #10
- US rank
- #379
Category grades
Schools grade is shown separately in the Schools card above.
Census & demographics
- Census place
- Apple Valley, MN
- County
- Dakota County · 417,704 people
- City population
- 55,658
- Metro
- Minneapolis-St. Paul-Bloomington, MN-WI
- Population (ZIP)
- 55,658
- Household income
- $97,727
- Rent vs Own
- Severe rent burden
- 1406.0
Population outlook (Dakota County) Hauer SSP2
- Today (2025)
- 450,671 people
- By 2030
- 465,068 · +3.2%
- By 2040
- 486,770 · +8.0%
- By 2050
- 498,743 · +10.7%
- By 2075
- 533,865 · +18.5%
- By 2100
- 550,133 · +22.1%
Race, ethnicity, and origin ACS 2023
- Neighborhood character
- Predominantly White (69%)
- Race & ethnicity
- White 69% Black 10% Two or more races 9% Hispanic / Latino 7% Asian 6%
- Hispanic origin (detail)
- Mexican 4% Dominican 1%
- Common ancestry
- Portuguese 10% Romanian 3% Italian 3%
- Foreign-born
- 12% · Canada, China, Vietnam
- Languages at home
- 85% English-only · Spanish 5% Other Asian/Pacific 2% Other Indo-European 1%
Political lean MEDSL · Dakota
- 2024 margin
- D (+12.9) · D 55.4% · R 42.5% · Other 2.1%
- 2008→2024 swing
- +7.4pp toward D · 2008: 5.5pp · 2024: 12.9pp
- All cycles
- 2024: D+12.9 2020: D+13.9 2016: D+4.7 2012: D+2.9 2008: D+5.5
Not yet ingested
- Civics
- —
Market trends
- HPI YoY
- ▼ -275.56%
- Current HPI
- 227.4734
- Rent YoY
- ▲ 3.27%
- Metro
- Minneapolis-St. Paul-Bloomington, MN-WI
- State GDP YoY
- ▲ 2.41%
- F500 in state
- 34
Industry mix (Fortune 500 HQ in MN)
| Industry | F500 HQs | Revenue |
|---|---|---|
| Healthcare | 2 | $407B |
|
||
| Retail | 2 | $150B |
|
||
| Consumer Goods | 2 | $32B |
|
||
| Industrial Machinery | 2 | $6B |
|
||
| Agriculture | 1 | $40B |
|
||
| Healthcare / Medical Devices | 1 | $32B |
|
||
Price history
3 events — show timeline
- 2026-05-12 Pending — NORTHSTARMLS as Distributed by MLS Grid
- 2026-05-05 Contingent — NORTHSTARMLS as Distributed by MLS Grid
- 2026-05-01 Listed $365,000 NORTHSTARMLS as Distributed by MLS Grid
Property tax history
+4.0%/yrLatest (2025): $4,142 · +3.8% YoY. Source: county tax records.
Cash-flow waterfall
monthlySold comps — $/sqft
last 12 mo · ≤1 miLoading sold comps…