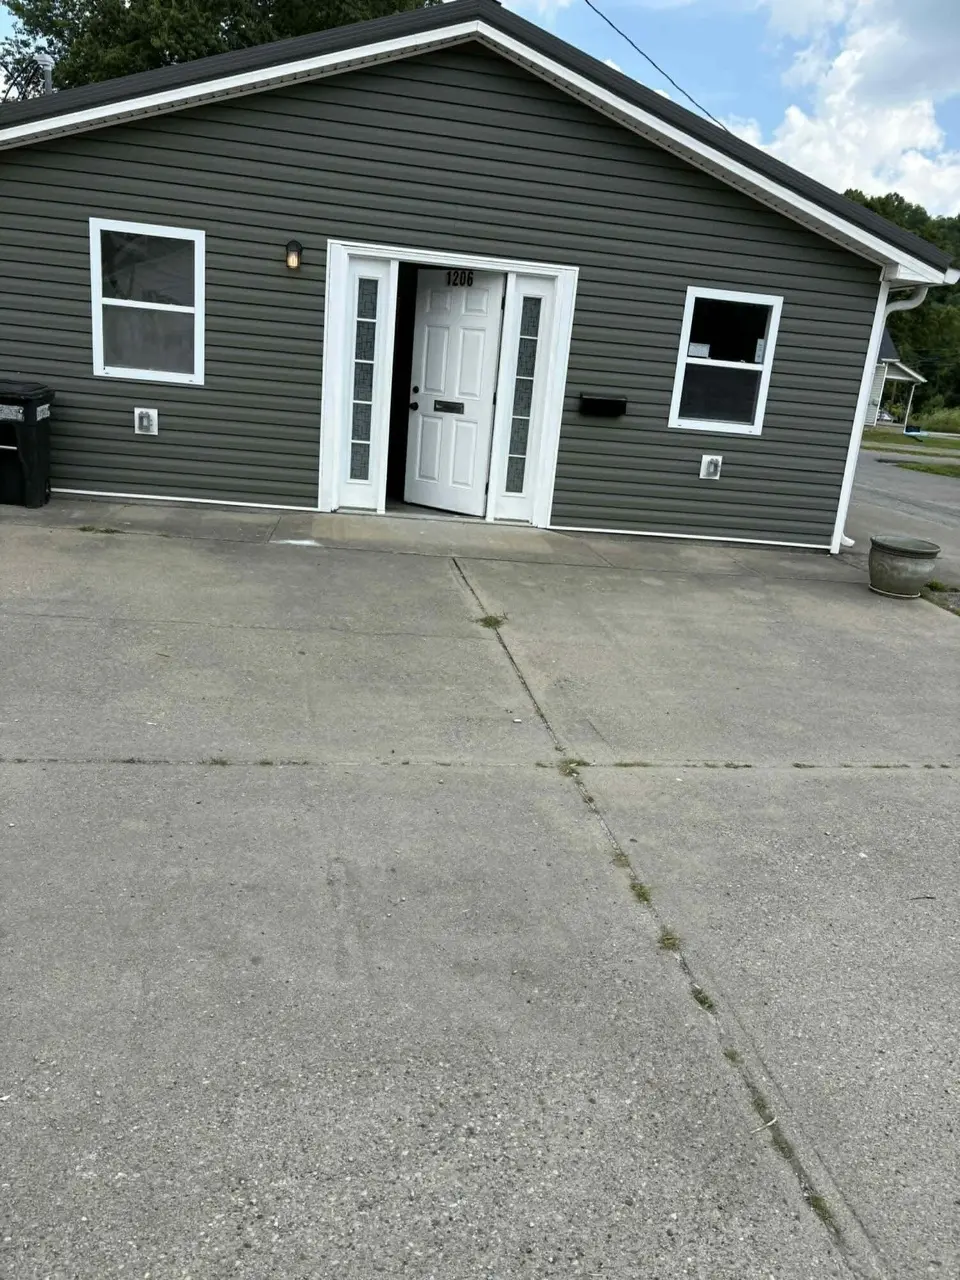
1206 W Shelby St · Falmouth, KY
Flood risk No data
- FEMA flood zone
- —
- Chance of flooding over 30 yrs
- —
- Est. flood insurance / yr
- —
Fire risk No data
- Est. fire insurance / yr
- —
Heat risk No data
- Hot days now (above threshold)
- —
- Hot days in 30 yrs
- —
Wind risk No data
- Chance of severe wind over 30 yrs
- —
Air-quality risk No data
- Unhealthy air days now
- —
- Unhealthy air days in 30 yrs
- —
Risk factors via First Street. Map © Google.
Why this score? — see what drove the B grade
The composite is a weighted blend of 9 inputs, each scored 0–100. Each bar is that input's sub-score; the figure is the points it added to the 100-point composite (weight × sub-score).
- Cash flow +28.2/30.0
- DSCR +10.0/10.0
- Appreciation +10.0/10.0
- 1% rule +7.8/10.0
- ARV discount +6.0/15.0
- Condition / age +4.0/5.0
- Livability +3.4/5.0
- Rent growth +2.5/5.0
- Schools +2.5/10.0
$92,900
🖨 Deal sheet 📄 Offer letter ✓ Due diligence
Listing remarks
Super Cute, Updated Three Bedroom 2 bath cottage in the heart of Downtown Falmouth! Ample off street parking. Would make a great first home or rental property. Excellent Price.
Key facts
- Off street parking
- 6,652 sq ft lot
- Parking
Tags
Property features AI
Exterior
- Parking: Assigned parking; Off-street parking
- Utilities: Public water; Public sewer; Cable available
- Home design: Single-family home; One level
- Construction: Vinyl siding; Slab foundation
- Exterior features: Vinyl clad windows; Shingle roof; Existing structure; Approximately 0.15-acre lot
Interior
- Kitchen: Electric range; Dishwasher; Microwave; Refrigerator
- Bedrooms: Primary bedroom (11 x 10); Bedroom 2 (11 x 10); Bedroom 3 (10 x 11)
- Bathrooms: 2 full bathrooms
- Interior features: Electric range; Dishwasher; Microwave; Refrigerator; Central air conditioning; Forced air heating
Neighborhood map
What this means for you Summary
Snapshot
- This is a 3-bed/2.0-bath single-family listed at $93k. Condition is rated good.
Deal economics
- At list price, monthly cash flow is $294 ($4k/yr) — positive.
- The deal already cash-flows at list — no discount required.
- Meets the 1% rule at list price ($1k rent vs $93k).
Location & tenants
- Location reads 68/100 on livability (#183 in KY) — a middle-class / working-renter tenant base. Strengths: cost of living A+, housing A+, crime B+; Watch: commute F, employment F.
- Pendleton County (rural): math 23% / reading 35% proficiency, ranked #110 of 165 in KY (top 67%) — low school quality limits family demand, transient renter base, plan for 1-2y turnover.
- Zoned schools: Northern Elementary School (math 31% / reading 45%, grade F, #242 of 676 statewide, top 37%, 493 students, 54% FRL); Phillip Sharp Middle School (math 17% / reading 31%, grade F, #194 of 217 statewide, top 90%, 497 students, 61% FRL); Pendleton County High School (math 22% / reading 42%, grade F, #97 of 254 statewide, top 46%, 698 students, 57% FRL).
- Market conditions: 53 active listings in the ZIP.
Forward outlook
- In year one you build about $10k of equity ($642 loan paydown + $9k appreciation (10.0% local appreciation)).
- Pendleton County population projected at -26% by 2050 — secular population decline; favor cash flow + early exit over multi-decade hold.
- At projected returns (10.0% appreciation + 3.0% rent growth), your $26k cash investment doubles in ~2 years — after that, you're playing with house money.
- By year 4, paydown + projected appreciation supports a ~$35k cash-out refi (75% LTV) — recoverable capital for the next deal without selling this one.
Negotiation context
- Only 11 days on market — expect competitive offers; lowballing is unlikely to land.
Questions for the listing agent
- Is there a deadline driving the sale (1031 exchange, divorce, estate, relocation)? That informs how much negotiation room exists.
- Schools are F-rated, which usually means shorter tenancies and higher turnover. Who's the typical renter profile here, and what's been the actual vacancy rate?
- What's the average days-on-market for RENTAL listings here right now (not sales)? A rising rental-DOM trend means longer vacancies and softer asking-rent achievability than the comps imply.
- What's the recent tenant-quality profile in this submarket — average credit score on applications, eviction rate, late-payment / NSF rate, and stable-employment percentage? A property-management company in the area should have these aggregated.
- How much new for-sale + rental construction is in the pipeline within 1–3 miles? Heavy new supply typically softens prices + rents 12–24 months out; constrained supply supports both.
Investment metrics
- 1% rule
- 1.28% ✓
- Cap rate
- 10.09%
- Cash-on-cash
- 13.56%
- DSCR
- 1.60
- GRM
- 6.5
CMA / ARV
- ARV (on-the-fly)
- $89,856
- Comps found
- 3
Show comp detail 3 sales within ~0.75 mi
| Address | Dist | Beds/Ba | Sqft | Sold | Price | $/sf | Match |
|---|---|---|---|---|---|---|---|
| 517 Pendleton St | 0.35mi | 3/1.0 | 1,386 (+11%) | 22mo | $99,900 | $72 | 43 |
| 204 Montjoy St | 0.51mi | 2/1.0 (-1) | 1,080 (-14%) | 12mo | $23,000 | $21 | 34 |
| 418 Montjoy St | 0.54mi | 3/2.0 | 1,080 (-14%) | 22mo | $80,000 | $74 | 34 |
Match score weights: distance 35% · size 25% · config 20% · recency 20%. Top-matched comps best support the ARV.
Projected returns pro-forma
10.0% appreciation · 3.0% rent growth · sell at horizon
- IRR
- 34.3%
- Equity multiple
- 3.67×
- Total profit
- $69,334
- Equity at exit
- $83,692
- IRR
- 29.5%
- Equity multiple
- 8.28×
- Total profit
- $189,492
- Equity at exit
- $180,484
Cash invested: $26,012 (down + closing). Projections, not guarantees.
Landlord ↔ Tenant lean methodology
- Overall (STATE)
- 83 Strongly Landlord-Friendly
- State Kentucky
- 83 Strongly Landlord-Friendly · R+16
- County
- — inherits STATE
- City
- — inherits STATE
ZIP-level market 41040
- Home prices YoY
- 11.9%
- Active inventory
- 53
- Price-to-rent
- 6.5×
Monthly cashflow live
- Estimated rent
- $1,185 medium interval (Pro) →
- Mortgage (P&I)
- −$487
- Tax est. 1.5%
- −$116 /mo · $1,394/yr
- Insurance
- −$39
- HOA
- −$0
- Vacancy / Maint / Mgmt
- −$249
- Net cashflow
- $294
Break-even live
UW: 25.0% down · 7.5% · 30yr · 1.5% tax · 5.0% vac · 8.0% maint · 8.0% mgmt
Financing live
Cash to close
- Down payment
- $23,225
- Closing costs
- $2,787
- Reserves months
- —
- Total cash needed
- —
Loan-product check · same deal, 3 products live
Conventional
25% down · 7.5% · 30yr
- Down + closing
- —
- Monthly P&I
- —
- Monthly cashflow
- —
- DSCR
- —
- Eligible?
- —
Personal DTI + credit; lowest rate.
DSCR
20% down · 8.5% · 30yr
- Down + closing
- —
- Monthly P&I
- —
- Monthly cashflow
- —
- DSCR
- —
- Eligible?
- —
No personal income docs; deal must DSCR.
Hard money
10% down · 12.0% · 12mo
- Down + closing
- —
- Monthly P&I
- —
- Monthly cashflow
- —
- DSCR
- —
- Eligible?
- —
Short-term bridge; refi at stabilization.
Listing history 9 events
-
2026-06-18days on market $92,900 Active 11 DOM
-
2026-06-17days on market $92,900 Active 10 DOM
-
2026-06-16days on market $92,900 Active 9 DOM
-
2026-06-15days on market $92,900 Active 8 DOM
-
2026-06-13days on market $92,900 Active 6 DOM
-
2026-06-12days on market $92,900 Active 5 DOM
-
2026-06-09days on market $92,900 Active 2 DOM
-
2026-06-07remarks 176-char remark
-
2026-06-07$92,900 Active 1 DOM
ⓘ Source: listings_history table (triggers on properties + properties_extension) + one-shot
backfill from property_details.listing_events for pre-trigger history.
Nearby sold comps map
Loading sold comps map…
Walkable amenities ~0.75 mi
Loading nearby amenities…
Taxation est. · year 1
- Rental income
- $14,217
- − Mortgage interest
- −$5,204
- − Property taxes
- −$1,394
- − Insurance
- −$464
- − Repairs & maintenance
- −$1,137
- − Management
- −$1,137
- − Depreciation
- −$2,703
- Taxable income
- $2,178
- Est. tax owed @ 24.0%
- −$523
- After-tax cash flow
- $3,005/yr
For passive investors: Depreciation is non-cash, so a rental often shows a tax loss while cash-flowing — sheltering income. Rental losses are passive: they offset passive income freely, and up to $25,000/yr can offset ordinary (W-2) income if you actively participate and your MAGI is under $100k (phasing out to $0 by $150k); unused losses carry forward. On sale, claimed depreciation is recaptured at up to 25%, and gains may owe capital-gains tax (a 1031 exchange can defer both). Figures are a year-1 estimate at your 24.0% rate — not tax advice; consult a CPA.
Condition & rehab AI · 14 photos
This property is in good condition with modern updates and a well-maintained exterior. It is ready for immediate occupancy and would be a great investment for both resale and rental.
Value-add opportunities
- Both Painting the exterior and interior — Fresh paint enhances curb appeal and interior aesthetics
- Both Landscaping improvements — Enhances curb appeal and adds value to the property
Renovation cost estimate screening
Value-add ROI direction
- Both Painting the exterior and interior — Fresh paint enhances curb appeal and interior aesthetics ↑
- Both Landscaping improvements — Enhances curb appeal and adds value to the property ↑
ⓘ Cost ranges are severity-bucket heuristics (US national rule-of-thumb). Get contractor quotes + a written scope before underwriting a rehab budget.
Schools (NCES district)
- District
- Pendleton County
- NCES district ID
- 2104740
- Math proficiency
- 23% ▼ -14.00%
- Reading proficiency
- 35% ▼ -16.00%
- Median HH income
- $47,416
- Composite
- 25.08/100
- National rank
- #7536
- State rank
- #110 of 165 in KY
Livability — Falmouth
- Score
- 68/100
- State rank
- #183
- US rank
- #9081
Category grades
Schools grade is shown separately in the Schools card above.
Census & demographics
- Census place
- Falmouth, KY
- County
- Pendleton · 10,860 people
- Metro
- Cincinnati, OH-KY-IN
- Population (ZIP)
- 6,998
- Household income
- $51,511
- Rent vs Own
- Severe rent burden
- 3.5
Population outlook (Pendleton County) Hauer SSP2
- Today (2025)
- 13,640 people
- By 2030
- 13,035 · -4.4%
- By 2040
- 11,596 · -15.0%
- By 2050
- 10,074 · -26.1%
- By 2075
- 7,095 · -48.0%
- By 2100
- 5,074 · -62.8%
Race, ethnicity, and origin ACS 2023
- Neighborhood character
- Predominantly White (95%)
- Race & ethnicity
- White 95% Two or more races 2% Hispanic / Latino 2%
- Common ancestry
- Slovak 4% Italian 1% Lithuanian 0%
- Foreign-born
- 1%
Political lean MEDSL · Pendleton
- 2024 margin
- Solid R (+63.5) · D 17.5% · R 81.1% · Other 1.4%
- 2008→2024 swing
- -35.1pp toward R · 2008: -28.4pp · 2024: -63.5pp
- All cycles
- 2024: R+63.5 2020: R+60.5 2016: R+57.3 2012: R+30.7 2008: R+28.4
Not yet ingested
- Civics
- —
Market trends
- HPI YoY
- ▲ 28.75%
- Current HPI
- 269.7591
- Rent YoY
- —
- Metro
- —
- State GDP YoY
- ▲ 1.81%
- F500 in state
- 4
Industry mix (Fortune 500 HQ in KY)
| Industry | F500 HQs | Revenue |
|---|---|---|
| Healthcare | 1 | $118B |
|
||
| Food / Beverage | 1 | $7B |
|
||
Price history
1 event — show timeline
- 2026-06-07 Listed $92,900 NKMLS
Cash-flow waterfall
monthlySold comps — $/sqft
last 12 mo · ≤1 miLoading sold comps…