22065 106th Pl SE #75 · Kent, WA
Flood risk 1/10 · Minimal
- FEMA flood zone
- X (unshaded)
- Chance of flooding over 30 yrs
- 0.0%
- Est. flood insurance / yr
- $507 – $1,088
Fire risk 1/10 · Minimal
- Est. fire insurance / yr
- $604 – $1,122
Heat risk 3/10 · Minor
- Hot days now (above 87°F)
- 7 days/yr
- Hot days in 30 yrs
- 14 days/yr
Wind risk 1/10 · Minimal
- Chance of severe wind over 30 yrs
- —
Air-quality risk 8/10 · Major
- Unhealthy air days now
- 12 days/yr
- Unhealthy air days in 30 yrs
- 12 days/yr
Risk factors via First Street. Map © Google.
Why this score? — see what drove the C grade
The composite is a weighted blend of 9 inputs, each scored 0–100. Each bar is that input's sub-score; the figure is the points it added to the 100-point composite (weight × sub-score).
- Cash flow +26.2/30.0
- DSCR +8.8/10.0
- 1% rule +7.0/10.0
- Schools +4.8/10.0
- Livability +4.0/5.0
- Condition / age +4.0/5.0
- Rent growth +3.4/5.0
- ARV discount +0.1/15.0
- Appreciation +0.0/10.0
$189,000
🖨 Deal sheet 📄 Offer letter ✓ Due diligence
Listing remarks
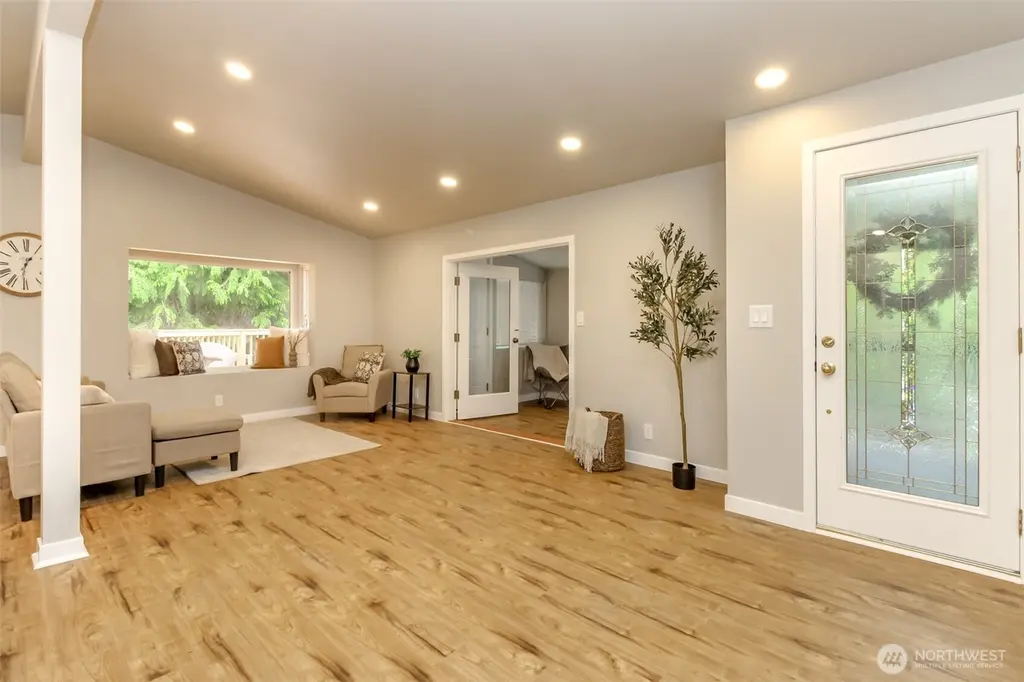
Step into this stunning 2-bedroom, 2-bathroom home with a den, fully remodeled from the studs up and offering modern comfort in every detail. With thoughtful upgrades throughout and a serene setting backing to a greenbelt, this home delivers both style and tranquility. The interior is gorgeous, truly move-in ready. Enjoy a brand-new kitchen with all new appliances, new bathrooms, updated finishes, and a layout that feels open, bright, and welcoming. A new roof, new deck, and complete top-to-bottom renovation provide peace of mind for years to come. Outside, the home offers a quiet, private setting with greenbelt views and a brand-new deck perfect for relaxing or entertaining. The community
Key facts
- Fully remodeled
- New kitchen
- New appliances
Tags
Property features AI
Finance
- Other: Land is leased
- Financial info: Listing terms include Cash, Conventional, FHA, and VA
- HOA & community: Monthly association fee (paid to park) includes water, sewer and trash; Association contact: Brad Cooke; Senior community with age restriction; Community clubhouse and trails; CCRs
Exterior
- Parking: Attached carport with 2 covered spaces
- Utilities: Electric energy source; Public water (water paid by park); Sewer connected (sewer paid by park); Power provided by PSE; Electric water heater
- Home design: Manufactured double-wide home; Single-story; Updated/Remodeled; Has a view; Built (effective) in 1980; Tie-down foundation
- Construction: Metal/vinyl construction materials; Composition roof
- Exterior features: Metal/vinyl exterior; Deck; Patio; Outbuildings; Garden space; Cable TV and high-speed internet available; Paved site
Interior
- Kitchen: Dishwasher; Refrigerator; Stove/Range
- Bedrooms: 2 bedrooms (both on main level)
- Flooring: Laminate flooring
- Bathrooms: 1 full bath; 1 half bath; 1 bathtub; 2 showers
- Heating & cooling: Forced air heating; No central cooling
- Interior features: Ceiling fans; Dining room; French doors; Vaulted ceilings; Walk-in closets; Water heater
- Laundry & utility: Water heater located in shed
Neighborhood map
What this means for you Summary
Snapshot
- This is a 2-bed/2.0-bath manufactured listed at $189k. Condition is rated good.
Deal economics
- At list price, monthly cash flow is $480 ($6k/yr) — positive.
- The deal already cash-flows at list — no discount required.
- Meets the 1% rule at list price ($2k rent vs $189k).
- Cap rate 9.3% vs local median 2.7% in Kent — top-decile yield for the area; either an underpriced asset or a hidden risk that comps aren't pricing in. Stress-test before assuming the spread holds.
Location & tenants
- Location reads 79/100 on livability (#109 in WA, #2,154 nationally) — a middle-class / working-renter tenant base. Strengths: amenities A+, commute A+, housing A+; Watch: schools C-, crime F, cost of living F.
- Kent School District (urban): math 47% / reading 57% proficiency, ranked #109 of 291 in WA (top 38%) — acceptable for families but not a draw, mixed tenant base, ~2y average lease.
- Market conditions: Rents rising (+3.5%/yr); 167 active listings in the ZIP; 19 comparable units currently listed for rent nearby; rentals at typical pace (median 21d on market — plan ~3-4 weeks tenant-placement turnaround); solid renter incomes; 10,555 units permitted in King County in 2024 (7,119 in 5+ unit buildings).
Forward outlook
- Local home prices are declining (-3.0%/yr); year-one equity from $1k of loan paydown is wiped out by about $6k of value loss. Plan a longer hold.
- King County population projected at +44% by 2050 — long-run rental-demand tailwind backs the buy-and-hold thesis.
- At projected returns (-3.0% appreciation + 3.5% rent growth), your $53k cash investment doubles in ~10 years — after that, you're playing with house money.
Negotiation context
- Only 10 days on market — expect competitive offers; lowballing is unlikely to land.
- 3 sale attempts since 20y ago with the ask held roughly flat each time — persistent listings suggest the price (not the market) is what's stuck; bring a comps-based counter.
- Current owner paid $50k; list at $189k implies a 278% gain — meaningful room to come down on a strong offer.
Questions for the listing agent
- Is there a deadline driving the sale (1031 exchange, divorce, estate, relocation)? That informs how much negotiation room exists.
- Crime grade is F in this area — have there been break-ins, vandalism, or insurance claims at this property in the last 3 years? What carrier currently insures it and at what premium?
- What's the average days-on-market for RENTAL listings here right now (not sales)? A rising rental-DOM trend means longer vacancies and softer asking-rent achievability than the comps imply.
- What's the recent tenant-quality profile in this submarket — average credit score on applications, eviction rate, late-payment / NSF rate, and stable-employment percentage? A property-management company in the area should have these aggregated.
- How much new for-sale + rental construction is in the pipeline within 1–3 miles? Heavy new supply typically softens prices + rents 12–24 months out; constrained supply supports both.
Investment metrics
- 1% rule
- 1.20% ✓
- Cap rate
- 9.34%
- Cash-on-cash
- 10.89%
- DSCR
- 1.48
- GRM
- 7.0
CMA / ARV
- ARV (on-the-fly)
- $162,400
- Comps found
- 12
Show comp detail 12 sales within ~0.75 mi
| Address | Dist | Beds/Ba | Sqft | Sold | Price | $/sf | Match |
|---|---|---|---|---|---|---|---|
| 22065 106th Pl SE #75 | 0.00mi | 2/2.0 | 1,450 (0%) | 4mo | $50,000 | $34 | 96 |
| 21908 107th Ave SE #22 | 0.12mi | 2/2.0 | 1,440 (-1%) | 7mo | $115,000 | $80 | 87 |
| 21821 107th Pl SE #13 | 0.17mi | 3/2.0 (+1) | 1,440 (-1%) | 3mo | $67,000 | $47 | 84 |
| 21800 107th Pl SE #9 | 0.18mi | 2/2.0 | 1,442 (-1%) | 12mo | $134,000 | $93 | 81 |
| 21916 107th Pl SE | 0.15mi | 3/2.0 (+1) | 1,440 (-1%) | 7mo | $161,200 | $112 | 80 |
| 10706 SE 218th Pl #45 | 0.19mi | 2/2.0 | 1,440 (-1%) | 14mo | $135,000 | $94 | 79 |
| 21920 107th Ave SE #2 | 0.12mi | 3/2.0 (+1) | 1,536 (+6%) | 14mo | $166,000 | $108 | 68 |
| 22603 115th Pl SE | 0.62mi | 3/2.0 (+1) | 1,536 (+6%) | 3mo | $470,000 | $306 | 54 |
| 22627 112th Ave SE | 0.54mi | 3/2.0 (+1) | 1,536 (+6%) | 9mo | $459,000 | $299 | 52 |
| 11029 SE 227th Pl | 0.52mi | 2/2.0 | 1,304 (-10%) | 10mo | $200,000 | $153 | 50 |
| 10921 SE 227TH Pl | 0.50mi | 3/2.0 (+1) | 1,248 (-14%) | 2mo | $155,000 | $124 | 47 |
| 22522 113th Pl SE | 0.52mi | 2/2.0 | 1,248 (-14%) | 12mo | $420,000 | $337 | 42 |
Match score weights: distance 35% · size 25% · config 20% · recency 20%. Top-matched comps best support the ARV.
Projected returns pro-forma
-3.0% appreciation · 3.53% rent growth · sell at horizon
- IRR
- 0.6%
- Equity multiple
- 1.02×
- Total profit
- $1,219
- Equity at exit
- $28,181
- IRR
- 10.8%
- Equity multiple
- 1.86×
- Total profit
- $45,630
- Equity at exit
- $16,341
Cash invested: $52,920 (down + closing). Projections, not guarantees.
Landlord ↔ Tenant lean methodology
- Overall (STATE)
- 28 Tenant-Leaning
- State Washington
- 28 Tenant-Leaning · D+8
- County
- — inherits STATE
- City
- — inherits STATE
ZIP-level market 98031
- Rents YoY
- 3.5%
- Active inventory
- 167
- Price-to-rent
- 7.0×
Monthly cashflow live
- Estimated rent
- $2,261 high interval (Pro) →
- Mortgage (P&I)
- −$991
- Tax est. 1.5%
- −$236 /mo · $2,835/yr
- Insurance
- −$79
- HOA
- −$0
- Vacancy / Maint / Mgmt
- −$475
- Net cashflow
- $480
Break-even live
UW: 25.0% down · 7.5% · 30yr · 1.5% tax · 5.0% vac · 8.0% maint · 8.0% mgmt
Financing live
Cash to close
- Down payment
- $47,250
- Closing costs
- $5,670
- Reserves months
- —
- Total cash needed
- —
Loan-product check · same deal, 3 products live
Conventional
25% down · 7.5% · 30yr
- Down + closing
- —
- Monthly P&I
- —
- Monthly cashflow
- —
- DSCR
- —
- Eligible?
- —
Personal DTI + credit; lowest rate.
DSCR
20% down · 8.5% · 30yr
- Down + closing
- —
- Monthly P&I
- —
- Monthly cashflow
- —
- DSCR
- —
- Eligible?
- —
No personal income docs; deal must DSCR.
Hard money
10% down · 12.0% · 12mo
- Down + closing
- —
- Monthly P&I
- —
- Monthly cashflow
- —
- DSCR
- —
- Eligible?
- —
Short-term bridge; refi at stabilization.
Rent comps 19 comps
| Address | Beds | Baths | Sqft | Rent | $/sqft | DOM | Units | Dist |
|---|---|---|---|---|---|---|---|---|
| 21822 107th Pl SE #6 Kent, WA | 3.0 | 1.5 | 1152 | $1,525 | $1.32 | 22d | 1 | 0.17mi |
| 11500 SE 221st Pl Kent, WA | 3.0 | 2.5 | 1770 | $3,100 | $1.75 | 43d | 1 | 0.46mi |
| 10530 SE 229th Pl Kent, WA | 3.0 | 1.0 | 1000 | $3,000 | $3.00 | 43d | 1 | 0.50mi |
| 11211 SE 226th St Kent, WA | 3.0 | 2.0 | 1012 | $2,250 | $2.22 | 18d | 1 | 0.51mi |
| 10820 SE 211th Pl Kent, WA | 1.0–3.0 | 1.0–1.5 | 907 | $2,032 | $2.24 | 2d | 20 | 0.71mi |
| 11101 SE 208th St Kent, WA | 1.0–3.0 | 1.0–2.0 | 971 | $1,978 | $2.04 | 2d | 17 | 0.72mi |
| 20803 110th Ln SE Kent, WA | 2.0 | 2.5 | 1361 | $2,845 | $2.09 | 43d | 1 | 0.82mi |
| 20805 109th Ln SE Kent, WA | 2.0 | 1.5 | 1250 | $2,700 | $2.16 | 43d | 1 | 0.82mi |
| 23613 112th Ave SE Apt J103 Kent, WA | 2.0 | 2.0 | 882 | $2,000 | $2.27 | 12d | 1 | 1.01mi |
| 9915 SE 235th Pl Kent, WA | 3.0 | 2.0 | 1250 | $2,750 | $2.20 | 20d | 1 | 1.01mi |
| 20506 103rd Ave SE Kent, WA | 3.0 | 1.0 | 1180 | $2,295 | $1.94 | 24d | 1 | 1.02mi |
| 23721 108th Ave SE Kent, WA | 2.0 | 1.0 | 1000 | $1,800 | $1.80 | 24d | 1 | 1.03mi |
| 22804 90th Way S Kent, WA | 1.0–3.0 | 1.0–2.0 | 910 | $1,794 | $1.97 | 2d | 21 | 1.05mi |
| 22328 88th Ave S Kent, WA | 3.0 | 3.0 | 1714 | $3,695 | $2.16 | 20d | 1 | 1.07mi |
| 23817 108th Ave SE Kent, WA | 1.0–2.0 | 1.0 | 874 | $1,815 | $2.08 | 3d | 6 | 1.08mi |
| 10811 SE 239th Pl Kent, WA | 1.0–3.0 | 1.0–2.0 | 917 | $1,898 | $2.07 | 2d | 28 | 1.11mi |
| 12012 SE 210th St Kent, WA | 3.0 | 1.5 | 1230 | $1,820 | $1.48 | 24d | 1 | 1.15mi |
| 21627 127th Pl SE Kent, WA | 3.0 | 2.0 | 1420 | $3,095 | $2.18 | 16d | 1 | 1.32mi |
| 1024 Central Ave N Kent, WA | 1.0–3.0 | 1.0–2.0 | 755 | $2,052 | $2.72 | 2d | 55 | 1.49mi |
Listing history 8 events
-
2026-06-18days on market $189,000 Active 10 DOM
-
2026-06-17days on market $189,000 Active 9 DOM
-
2026-06-16days on market $189,000 Active 8 DOM
-
2026-06-15days on market $189,000 Active 7 DOM
-
2026-06-13days on market $189,000 Active 5 DOM
-
2026-06-09days on market $189,000 Active 1 DOM
-
2026-06-07remarks 699-char remark
-
2026-06-07$189,000 Active 2 DOM
ⓘ Source: listings_history table (triggers on properties + properties_extension) + one-shot
backfill from property_details.listing_events for pre-trigger history.
Climate risk First Street
- Flood 1/10 Low FEMA zone X (unshaded) · 0% chance over 30 yrs
- Wildfire 1/10 Low
- Heat 3/10 Moderate 7 d/yr ≥87°F today · 14 d/yr by 30 yrs out
- Wind 1/10 Low
- Air quality 8/10 Severe 12 unhealthy d/yr today · 12 by 30 yrs out
Nearby sold comps map
Loading sold comps map…
Walkable amenities ~0.75 mi
Loading nearby amenities…
Taxation est. · year 1
- Rental income
- $27,138
- − Mortgage interest
- −$10,587
- − Property taxes
- −$2,835
- − Insurance
- −$945
- − Repairs & maintenance
- −$2,171
- − Management
- −$2,171
- − Depreciation
- −$5,498
- Taxable income
- $2,931
- Est. tax owed @ 24.0%
- −$703
- After-tax cash flow
- $5,062/yr
For passive investors: Depreciation is non-cash, so a rental often shows a tax loss while cash-flowing — sheltering income. Rental losses are passive: they offset passive income freely, and up to $25,000/yr can offset ordinary (W-2) income if you actively participate and your MAGI is under $100k (phasing out to $0 by $150k); unused losses carry forward. On sale, claimed depreciation is recaptured at up to 25%, and gains may owe capital-gains tax (a 1031 exchange can defer both). Figures are a year-1 estimate at your 24.0% rate — not tax advice; consult a CPA.
Condition & rehab AI · 12 photos
This move-in ready, fully renovated home offers modern comfort and a serene setting with a new roof, deck, and appliances.
Value-add opportunities
- Both landscaping — enhances curb appeal and adds value
- Both furniture — improves the home's livability and appeal
Renovation cost estimate screening
Value-add ROI direction
- Both landscaping — enhances curb appeal and adds value ↑
- Both furniture — improves the home's livability and appeal ↑
ⓘ Cost ranges are severity-bucket heuristics (US national rule-of-thumb). Get contractor quotes + a written scope before underwriting a rehab budget.
Schools (NCES district)
- District
- Kent School District
- NCES district ID
- 5303960
- Math proficiency
- 47% ▼ -1.00%
- Reading proficiency
- 57% ▼ -1.00%
- Median HH income
- $69,823
- Composite
- 48.25/100
- National rank
- #4714
- State rank
- #109 of 291 in WA
Livability — Kent
- Score
- 79/100
- State rank
- #109
- US rank
- #2154
Category grades
Schools grade is shown separately in the Schools card above.
Census & demographics
- Census place
- Kent, WA
- County
- King County · 2,251,916 people
- City population
- 119,479
- Metro
- Seattle-Tacoma-Bellevue, WA
- Population (ZIP)
- 40,094
- Household income
- $105,965
- Rent vs Own
- Severe rent burden
- 1151.0
Population outlook (King County) Hauer SSP2
- Today (2025)
- 2,576,485 people
- By 2030
- 2,803,316 · +8.8%
- By 2040
- 3,255,921 · +26.4%
- By 2050
- 3,706,444 · +43.9%
- By 2075
- 4,746,063 · +84.2%
- By 2100
- 5,407,730 · +109.9%
Race, ethnicity, and origin ACS 2023
- Neighborhood character
- Highly diverse neighborhood (Simpson 0.77)
- Race & ethnicity
- White 36% Asian 27% Black 13% Hispanic / Latino 13% Two or more races 13% Pacific Islander 1%
- Hispanic origin (detail)
- Mexican 9%
- Common ancestry
- Italian 5% Portuguese 2% Subsaharan African 2%
- Foreign-born
- 31% · Canada, Vietnam, China
- Languages at home
- 58% English-only · Spanish 9% Other Indo-European 7% Vietnamese 4%
Political lean MEDSL · King
- 2024 margin
- Solid D (+51.7) · D 74.2% · R 22.5% · Other 3.4%
- 2008→2024 swing
- +9.6pp toward D · 2008: 42.1pp · 2024: 51.7pp
- All cycles
- 2024: D+51.7 2020: D+52.7 2016: D+50.4 2012: D+39.9 2008: D+42.1
Not yet ingested
- Civics
- —
Market trends
- HPI YoY
- ▼ -673.58%
- Current HPI
- 308.1747
- Rent YoY
- ▲ 3.53%
- Metro
- Seattle-Tacoma-Bellevue, WA
- State GDP YoY
- ▲ 4.65%
- F500 in state
- 22
Industry mix (Fortune 500 HQ in WA)
| Industry | F500 HQs | Revenue |
|---|---|---|
| Retail | 2 | $269B |
|
||
| Technology / Retail | 1 | $638B |
|
||
| Technology | 1 | $245B |
|
||
| Telecommunications | 1 | $38B |
|
||
| Food / Beverage | 1 | $36B |
|
||
| Automotive / Trucks | 1 | $34B |
|
||
Price history
+330.0% since first listed7 events — show timeline
- 2026-05-29 Listed $189,000 NWMLS as Distributed by MLS Grid
- 2026-02-11 Sold (MLS) $50,000 NWMLS as Distributed by MLS Grid
- 2026-01-29 Pending — NWMLS as Distributed by MLS Grid
- 2026-01-12 Price Changed $99,950 NWMLS as Distributed by MLS Grid
- 2025-12-29 Listed $110,000 NWMLS as Distributed by MLS Grid
- 2006-05-12 Sold (MLS) $44,000 NWMLS as Distributed by MLS Grid
- 2006-04-06 Listed $43,950 NWMLS as Distributed by MLS Grid
Cash-flow waterfall
monthlySold comps — $/sqft
last 12 mo · ≤1 miLoading sold comps…