6265 Vista Garden Way Unit B · Lely Resort, FL
Flood risk 6/10 · Moderate
- FEMA flood zone
- X (unshaded)
- Chance of flooding over 30 yrs
- 0.58%
- Est. flood insurance / yr
- $507 – $1,088
Fire risk 4/10 · Minor
- Est. fire insurance / yr
- $947 – $1,759
Heat risk 9/10 · Severe
- Hot days now (above 107°F)
- 4 days/yr
- Hot days in 30 yrs
- 17 days/yr
Wind risk 10/10 · Severe
- Chance of severe wind over 30 yrs
- 99.0%
Air-quality risk 2/10 · Minimal
- Unhealthy air days now
- 2 days/yr
- Unhealthy air days in 30 yrs
- 2 days/yr
Risk factors via First Street. Map © Google.
Why this score? — see what drove the D grade
The composite is a weighted blend of 9 inputs, each scored 0–100. Each bar is that input's sub-score; the figure is the points it added to the 100-point composite (weight × sub-score).
- Cash flow +14.6/30.0
- ARV discount +7.5/15.0
- 1% rule +5.3/10.0
- Schools +5.0/10.0
- DSCR +4.4/10.0
- Livability +3.1/5.0
- Condition / age +2.5/5.0
- Rent growth +2.1/5.0
- Appreciation +0.0/10.0
$245,000
🖨 Deal sheet (PDF) 📄 Offer letter ✓ Due diligence
Listing remarks MLS
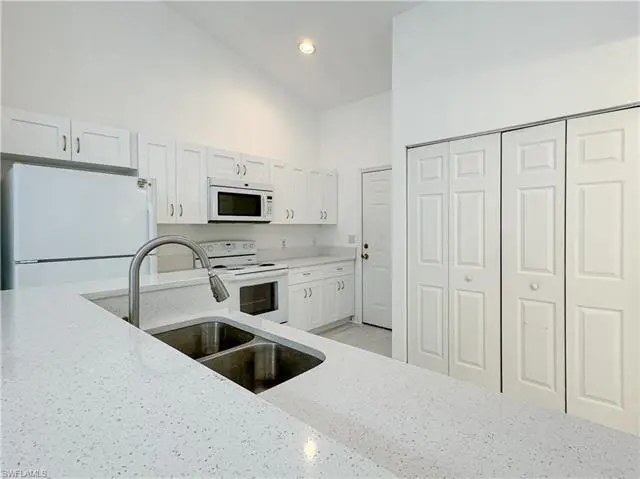
Great investment opportunity - positive cash flow - 2 Bedroom, 2 Bath Condo with vaulted ceilings, tile in dining room and wood floors in all 3 bedrooms. Just minutes to downtown Naples and the beaches. Please call for an appointment. Tenant occupied.
Key facts
- Landscaped grounds
- Screened lanai
- Vaulted ceilings
Tags
Property features AI
Finance
- Other: Unit B, Lot unit B; Deeded restrictions
- HOA & community: Master HOA $388 quarterly; Total annual recurring fees $1,552; Total one-time fees $1,225; Maintenance: None; Community/amenities: See remarks
Exterior
- Parking: 1 unit per floor within a 1-story building (complex with 24 units, 4 units per building)
- Utilities: Central water; Central sewer; Cable available
- Home design: Residential villa attached; Built in 2001; Located in Vista Gardens
- Construction: Concrete block construction
- Exterior features: Shingle roof; Single hung windows; Zero lot line; West rear exposure; Reclaimed irrigation; See remarks view
Interior
- Kitchen: Cooktop; Range; Microwave; Dishwasher; Refrigerator
- Bedrooms: 2 bedrooms
- Flooring: Carpet; Concrete; Tile
- Bathrooms: 2 full bathrooms; Master bath with combo tub and shower
- Heating & cooling: Central electric heat; Central electric cooling; Ceiling fans
- Interior features: Breakfast bar; Family room; Screened lanai/porch; See remarks
- Laundry & utility: Washer; Dryer
Neighborhood map
What this means for you Summary
Snapshot
- This is a 2-bed/2.0-bath condo listed at $245k.
Deal economics
- At list price, monthly cash flow is $57 ($679/yr) — positive.
- The deal already cash-flows at list — no discount required.
- Meets the 1% rule at list price ($3k rent vs $245k).
- Recommended offer: $238k (3.0% below list) — sets the bar for market timing.
Location & tenants
- Location reads 61/100 on livability (#786 in FL) — a middle-class / working-renter tenant base. Strengths: crime A+, employment A-; Watch: health & safety D, schools F, amenities F.
- Collier (suburban): math 60% / reading 56% proficiency, ranked #16 of 73 in FL (top 22%) — acceptable for families but not a draw, mixed tenant base, ~2y average lease.
- Market conditions: Rents soft (-1.7%/yr); 771 active listings in the ZIP; 13 comparable units currently listed for rent nearby; rentals at typical pace (median 14d on market — plan ~3-4 weeks tenant-placement turnaround); 3,520 units permitted in Collier County in 2024 (959 in 5+ unit buildings).
- This rent runs 43% of the median local income ($70k/yr) — at the standard rent-burdened threshold; future hikes will face affordability resistance.
Forward outlook
- Local home prices are declining (-3.0%/yr); year-one equity from $2k of loan paydown is wiped out by about $7k of value loss. Plan a longer hold.
- Collier County population projected at +30% by 2050 — long-run rental-demand tailwind backs the buy-and-hold thesis.
Negotiation context
- It's been on market 35 days — a 3% lower offer ($238k) is reasonable based on typical stale-listing flexibility.
- 7 sale attempts since 17y ago with the ask held roughly flat each time — persistent listings suggest the price (not the market) is what's stuck; bring a comps-based counter.
- Current owner paid $65k; list at $245k implies a 278% gain — meaningful room to come down on a strong offer.
Risks & watch-outs
- Climate carrying-cost: major flood risk; severe wind risk, 99% chance of damaging wind over 30y; extreme-heat days projected 4→17/yr by 2055 (HVAC capex compounding) — expect insurance premiums to compound above CPI over the hold.
Questions for the listing agent
- It's been on market 35 days. Have you received any prior offers? Is the seller open to a 3% concession, seller financing, or rate buy-down credit?
- What does the HOA fee cover, when was the last increase, and are there any pending special assessments or reserve-fund shortfalls?
- Any open or pending special assessments — roof, HVAC, plumbing, elevator, façade? What's the per-unit balance and payoff schedule, and is the seller paying it off at close or rolling it to the buyer?
- Is there a deadline driving the sale (1031 exchange, divorce, estate, relocation)? That informs how much negotiation room exists.
- Schools are F-rated, which usually means shorter tenancies and higher turnover. Who's the typical renter profile here, and what's been the actual vacancy rate?
- The area grade is low — what's the realistic commute time and amenity access for the typical tenant pool here? Any planned neighborhood developments (good or bad) we should know about?
- What's the average days-on-market for RENTAL listings here right now (not sales)? A rising rental-DOM trend means longer vacancies and softer asking-rent achievability than the comps imply.
- What's the recent tenant-quality profile in this submarket — average credit score on applications, eviction rate, late-payment / NSF rate, and stable-employment percentage? A property-management company in the area should have these aggregated.
- How much new apartment / multifamily construction is in the pipeline within 1–3 miles? Heavy new supply (>2% of stock underway) typically softens rents 12–24 months out; light construction supports rent growth.
Investment metrics
- 1% rule
- 1.03% ✓
- Cap rate
- 6.57%
- Cash-on-cash
- 0.99%
- DSCR
- 1.04
- GRM
- 8.1
CMA / ARV
No comps found within radius.
Projected returns pro-forma
-3.0% appreciation · 0.0% rent growth · sell at horizon
- IRR
- -18.5%
- Equity multiple
- 0.37×
- Total profit
- $-43,283
- Equity at exit
- $36,530
- IRR
- -19.8%
- Equity multiple
- 0.11×
- Total profit
- $-60,782
- Equity at exit
- $21,183
Cash invested: $68,600 (down + closing). Projections, not guarantees.
Landlord ↔ Tenant lean methodology
- Overall (STATE)
- 87 Strongly Landlord-Friendly
- State Florida
- 87 Strongly Landlord-Friendly · R+3
- County
- — inherits STATE
- City
- — inherits STATE
ZIP-level market 34112
- Rents YoY
- -1.7%
- Active inventory
- 771
- Price-to-rent
- 8.1×
Monthly cashflow live
- Estimated rent
- $2,514 high interval (Pro) →
- Mortgage (P&I)
- −$1,285
- Tax from tax record
- −$155 /mo · $1,859/yr
- Insurance
- −$102
- HOA
- −$388
- Vacancy / Maint / Mgmt
- −$528
- Net cashflow
- $57
Break-even live
Sensitivity live
| Price | -10% $195 | -5% $126 | +0% $57 | +5% $-13 | +10% $-82 |
|---|---|---|---|---|---|
| Rent | -10% $-142 | -5% $-43 | +0% $57 | +5% $156 | +10% $255 |
| Rate | -1.0pp $180 | -0.5pp $119 | base $57 | +0.5pp $-7 | +1.0pp $-71 |
UW: 25.0% down · 7.5% · 30yr · 1.5% tax · 5.0% vac · 8.0% maint · 8.0% mgmt
Financing live
Cash to close
- Down payment
- $61,250
- Closing costs
- $7,350
- Reserves months
- —
- Total cash needed
- —
Loan-product check · same deal, 3 products live
Conventional
25% down · 7.5% · 30yr
- Down + closing
- —
- Monthly P&I
- —
- Monthly cashflow
- —
- DSCR
- —
- Eligible?
- —
Personal DTI + credit; lowest rate.
DSCR
20% down · 8.5% · 30yr
- Down + closing
- —
- Monthly P&I
- —
- Monthly cashflow
- —
- DSCR
- —
- Eligible?
- —
No personal income docs; deal must DSCR.
Hard money
10% down · 12.0% · 12mo
- Down + closing
- —
- Monthly P&I
- —
- Monthly cashflow
- —
- DSCR
- —
- Eligible?
- —
Short-term bridge; refi at stabilization.
Rent comps 13 comps
| Address | Beds | Baths | Sqft | Rent | $/sqft | DOM | Units | Dist |
|---|---|---|---|---|---|---|---|---|
| 7425 Inspira Cir Naples, FL | 1.0–3.0 | 1.0–2.0 | 1066 | $2,328 | $2.18 | 14d | 17 | 0.36mi |
| 6072 Polly Ave Naples, FL | 1.0 | 1.0 | 720 | $1,800 | $2.50 | 24d | 1 | 0.61mi |
| 5841 Rattlesnake Hammock Rd Unit I-203 Naples, FL | 2.0 | 2.0 | 1015 | $3,500 | $3.45 | 14d | 1 | 0.63mi |
| 905 Augusta Blvd Naples, FL | 2.0 | 2.0 | 1125 | $1,850 | $1.64 | 24d | 1 | 0.84mi |
| 705 Augusta Blvd Unit 705-5 Naples, FL | 2.0 | 2.0 | 1125 | $2,000 | $1.78 | 14d | 1 | 0.86mi |
| 605 Augusta Blvd #14 Naples, FL | 2.0 | 2.0 | 1125 | $4,000 | $3.56 | 24d | 1 | 0.90mi |
| 605 Augusta Blvd #4 Naples, FL | 2.0 | 2.0 | 1125 | $3,950 | $3.51 | 14d | 1 | 0.90mi |
| 4556 Andover Way Unit E104 Naples, FL | 2.0 | 2.0 | 1072 | $5,000 | $4.66 | 14d | 1 | 0.99mi |
| 6026 Whitaker Rd Naples, FL | 1.0–3.0 | 1.0–2.0 | 986 | $2,880 | $2.92 | 14d | 39 | 1.00mi |
| 8120 Acacia St Naples, FL | 1.0–3.0 | 1.0–2.0 | 1128 | $2,202 | $1.95 | 14d | 33 | 1.20mi |
| 5651 Rattlesnake Hammock Rd Unit C-108 Naples, FL | 2.0 | 2.0 | 1054 | $1,800 | $1.71 | 24d | 1 | 1.25mi |
| 5635 Rattlesnake Hammock Rd Apt 203D Naples, FL | 2.0 | 2.0 | 1054 | $1,700 | $1.61 | 21d | 1 | 1.28mi |
| 5665 Whitaker Rd #202 Naples, FL | 2.0 | 2.0 | 1099 | $1,900 | $1.73 | 21d | 1 | 1.40mi |
HOA detail condo
- Monthly dues
- $388 · $4,656/yr
- Assessments
- None detected in remarks — confirm with the listing agent.
Listing history 29 events
-
2026-06-18days on market $245,000 Active 35 DOM
-
2026-06-17days on market $245,000 Active 34 DOM
-
2026-06-16days on market $245,000 Active 33 DOM
-
2026-06-15days on market $245,000 Active 32 DOM
-
2026-06-14days on market $245,000 Active 30 DOM
-
2026-06-10days on market $245,000 Active 27 DOM
-
2026-06-09days on market $245,000 Active 26 DOM
-
2026-06-08days on market $245,000 Active 25 DOM
-
2026-06-07days on market $245,000 Active 24 DOM
-
2026-06-03days on market $245,000 Active 20 DOM
-
2026-06-02days on market $245,000 Active 19 DOM
-
2026-06-01days on market $245,000 Active 18 DOM
-
2026-05-31days on market $245,000 Active 17 DOM
-
2026-05-30days on market $245,000 Active 16 DOM
-
2026-05-14$245,000 Active
-
2024-09-02historical $1,750
-
2024-08-24$1,750
-
2024-08-24historical $1,750
-
2024-08-18price $1,750
-
2024-06-18$1,850
-
2024-06-13historical $1,850
-
2024-05-23$1,850
-
2024-05-04historical $1,850
-
2024-04-27$1,850
-
2012-01-05soldstatus $64,900
-
2012-01-02soldstatus $64,900 251-char remark
Show marketing remark (251 chars)
Great investment opportunity - positive cash flow - 2 Bedroom, 2 Bath Condo with vaulted ceilings, tile in dining room and wood floors in all 3 bedrooms. Just minutes to downtown Naples and the beaches. Please call for an appointment. Tenant occupied.
-
2011-10-12$64,900 251-char remark
Show marketing remark (251 chars)
Great investment opportunity - positive cash flow - 2 Bedroom, 2 Bath Condo with vaulted ceilings, tile in dining room and wood floors in all 3 bedrooms. Just minutes to downtown Naples and the beaches. Please call for an appointment. Tenant occupied.
-
2009-04-05soldstatus $40,113 80-char remark
Show marketing remark (80 chars)
Nice ist floor 2/2 condo with lanai. Located in East Naples close to everything.
-
2009-01-23$44,900 80-char remark
Show marketing remark (80 chars)
Nice ist floor 2/2 condo with lanai. Located in East Naples close to everything.
ⓘ Source: listings_history table (triggers on properties + properties_extension) + one-shot
backfill from property_details.listing_events for pre-trigger history.
Tax reassessment forecast FL · Resets to sale price
- Current annual tax
- $1,859 · $155/mo
- Projected year-2 tax
- $2,034 · $169/mo
- Expected delta
- +$175/yr (+$15/mo · 9.4%)
ⓘ Screening estimate from a state-policy table — verify with the county assessor before closing.
Climate risk First Street
- Flood 6/10 Major FEMA zone X (unshaded) · 58% chance over 30 yrs
- Wildfire 4/10 Moderate
- Heat 9/10 Extreme 4 d/yr ≥107°F today · 17 d/yr by 30 yrs out
- Wind 10/10 Extreme 99% chance of damaging wind over 30 yrs
- Air quality 2/10 Low 2 unhealthy d/yr today · 2 by 30 yrs out
Nearby sold comps map
Loading sold comps map…
Walkable amenities ~0.75 mi
Loading nearby amenities…
Taxation est. · year 1
- Rental income
- $30,173
- − Mortgage interest
- −$13,724
- − Property taxes
- −$1,859
- − Insurance
- −$1,225
- − Repairs & maintenance
- −$2,414
- − Management
- −$2,414
- − HOA
- −$4,656
- − Depreciation
- −$7,127
- Taxable loss
- −$3,246
- Est. tax savings @ 24.0%
- +$779
- After-tax cash flow
- $1,458/yr
For passive investors: Depreciation is non-cash, so a rental often shows a tax loss while cash-flowing — sheltering income. Rental losses are passive: they offset passive income freely, and up to $25,000/yr can offset ordinary (W-2) income if you actively participate and your MAGI is under $100k (phasing out to $0 by $150k); unused losses carry forward. On sale, claimed depreciation is recaptured at up to 25%, and gains may owe capital-gains tax (a 1031 exchange can defer both). Figures are a year-1 estimate at your 24.0% rate — not tax advice; consult a CPA.
Schools (NCES district)
- District
- Collier
- NCES district ID
- 1200330
- Math proficiency
- 60% ▼ -4.00%
- Reading proficiency
- 56% ▼ -2.00%
- Median HH income
- $58,275
- Composite
- 50.23/100
- National rank
- #1892
- State rank
- #16 of 73 in FL
Livability — Lely Resort
- Score
- 61/100
- State rank
- #786
- US rank
- #17981
Category grades
Schools grade is shown separately in the Schools card above.
Census & demographics
- County
- Collier County · 396,295 people
- Metro
- Naples-Marco Island, FL
- Population (ZIP)
- 27,193
- Household income
- $69,842
- Rent vs Own
- Severe rent burden
- 980.0
Population outlook (Collier County) Hauer SSP2
- Today (2025)
- 420,858 people
- By 2030
- 450,054 · +6.9%
- By 2040
- 502,232 · +19.3%
- By 2050
- 544,932 · +29.5%
- By 2075
- 627,203 · +49.0%
- By 2100
- 659,015 · +56.6%
Race, ethnicity, and origin ACS 2023
- Neighborhood character
- Predominantly White (74%)
- Race & ethnicity
- White 74% Hispanic / Latino 18% Two or more races 9% Black 6% Native American 2% Asian 1%
- Hispanic origin (detail)
- Mexican 7% Puerto Rican 2% Cuban 4% Dominican 1%
- Common ancestry
- Hispanic 4% Romanian 3% Portuguese 2%
- Foreign-born
- 19% · Canada, Jamaica
- Languages at home
- 75% English-only · Spanish 17% French/Haitian/Cajun 4% German/W. Germanic 1%
Political lean MEDSL · Collier
- 2024 margin
- Solid R (+33.1) · D 33.1% · R 66.2%
- 2008→2024 swing
- -10.6pp toward R · 2008: -22.5pp · 2024: -33.1pp
- All cycles
- 2024: R+33.1 2020: R+24.7 2016: R+26.0 2012: R+30.1 2008: R+22.5
Not yet ingested
- Civics
- —
Market trends
- HPI YoY
- ▼ -235.10%
- Current HPI
- 256.9182
- Rent YoY
- ▼ -1.69%
- Metro
- Naples-Marco Island, FL
- State GDP YoY
- ▲ 3.28%
- F500 in state
- 36
Industry mix (Fortune 500 HQ in FL)
| Industry | F500 HQs | Revenue |
|---|---|---|
| Industrial Technology | 2 | $29B |
|
||
| Insurance | 2 | $17B |
|
||
| Retail | 1 | $60B |
|
||
| Technology Distribution | 1 | $58B |
|
||
| Homebuilding | 1 | $35B |
|
||
| Technology Manufacturing | 1 | $35B |
|
||
Price history
+445.7% since first listed15 events — show timeline
- 2026-05-14 Listed $245,000 NAPLESMLS
- 2024-09-02 Rental Removed $1,750 NAPLESMLS
- 2024-08-24 Listed for Rent $1,750 NAPLESMLS
- 2024-08-24 Rental Removed $1,750 APPFOLIO
- 2024-08-18 Price Changed $1,750 APPFOLIO
- 2024-06-18 Listed for Rent $1,850 APPFOLIO
- 2024-06-13 Rental Removed $1,850 APPFOLIO
- 2024-05-23 Listed for Rent $1,850 APPFOLIO
- 2024-05-04 Rental Removed $1,850 APPFOLIO
- 2024-04-27 Listed for Rent $1,850 APPFOLIO
- 2012-01-05 Sold (Public Records) $64,900 Public Records
- 2012-01-02 Sold (MLS) $64,900 NAPLESMLS
- 2011-10-12 Listed $64,900 NAPLESMLS
- 2009-04-05 Sold (MLS) $40,113 NAPLESMLS
- 2009-01-23 Listed $44,900 NAPLESMLS
Property tax history
+10.7%/yrLatest (2025): $1,859 · +7.6% YoY. Source: county tax records.
Cash-flow waterfall
monthlySold comps — $/sqft
last 12 mo · ≤1 miLoading sold comps…