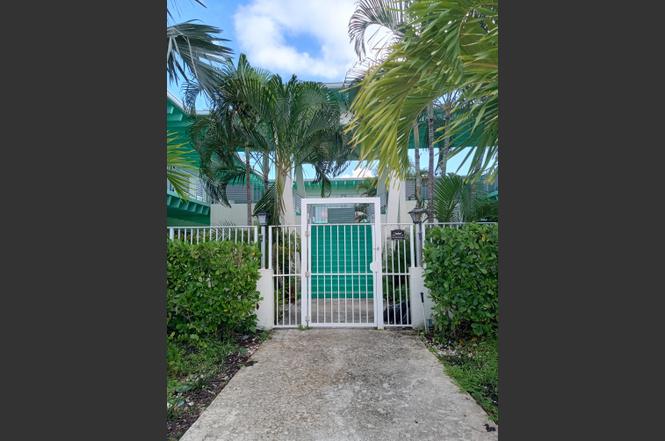
702 N Federal Hwy Unit B6 · Lake Worth Beach, FL
Flood risk 5/10 · Moderate
- FEMA flood zone
- X (unshaded)
- Chance of flooding over 30 yrs
- 0.23%
- Est. flood insurance / yr
- $507 – $1,088
Fire risk 1/10 · Minimal
- Est. fire insurance / yr
- $947 – $1,759
Heat risk 10/10 · Severe
- Hot days now (above 105°F)
- 7 days/yr
- Hot days in 30 yrs
- 26 days/yr
Wind risk 10/10 · Severe
- Chance of severe wind over 30 yrs
- 99.0%
Air-quality risk 2/10 · Minimal
- Unhealthy air days now
- 0 days/yr
- Unhealthy air days in 30 yrs
- 2 days/yr
Risk factors via First Street. Map © Google.
Why this score? — see what drove the B- grade
The composite is a weighted blend of 9 inputs, each scored 0–100. Each bar is that input's sub-score; the figure is the points it added to the 100-point composite (weight × sub-score).
- Cash flow +26.2/30.0
- 1% rule +10.0/10.0
- DSCR +8.9/10.0
- ARV discount +7.5/15.0
- Schools +4.3/10.0
- Rent growth +3.4/5.0
- Livability +2.5/5.0
- Condition / age +2.5/5.0
- Appreciation +0.0/10.0
$111,900
🖨 Deal sheet 📄 Offer letter ✓ Due diligence
Listing remarks
This is a 55+ adult commuity building. Art Deco Design, lush south florida landscape, commuity courtyard to enjoy with a grill and tables for enjoyment. This unit is just moments to the ocean, fishing pier, movies, eats, kayaing, bike riding, golfing and all the perks of SoFlo Living! Laundry on premis and a private storage for each unit. TURNKEY. CASH ONLY
Key facts
- $225 HOA
- Built 1959
- Listed 191 days
Property features AI
Finance
- Other: Building area reported as 528 (per public records)
- Financial info: Pets allowed with restrictions (breed, number, and size limits)
- HOA & community: Monthly association fee ($225) covering insurance, water, and common areas; Association amenities include laundry and storage; Senior community
Exterior
- Parking: Assigned parking
- Security: Gated community without a guard
- Utilities: Public water; Public sewer; Three-phase electric; Cable available; Water available; Sewer available
- Home design: Condominium; Two-story building; Faces west; Resale property
- Construction: Concrete / CBS construction
- Exterior features: Porch
Interior
- Kitchen: Electric range; Microwave; Refrigerator
- Bedrooms: One bedroom on the main level
- Flooring: Laminate flooring; Tile flooring
- Bathrooms: One full bathroom (main level)
- Heating & cooling: Window/wall heating; Ceiling fan(s); Wall/window cooling units
- Interior features: No special interior features listed; Partially furnished
- Laundry & utility: Building association provides laundry; Storage available through association
Neighborhood map
What this means for you Summary
Snapshot
- This is a 1-bed/1.0-bath condo listed at $112k.
Deal economics
- At list price, monthly cash flow is $287 ($3k/yr) — positive.
- The deal already cash-flows at list — no discount required.
- Meets the 1% rule at list price ($2k rent vs $112k).
- Recommended offer: $98k (12.0% below list) — sets the bar for market timing.
Location & tenants
- Location reads: area grade B — affects rentability + tenant quality, not the cash-flow math above.
- Palm Beach (suburban): math 46% / reading 53% proficiency, ranked #34 of 73 in FL (top 47%) — families likely to look elsewhere, expect single-tenant / working-renter base with shorter leases.
- Market conditions: Rents rising (+3.5%/yr); 249 active listings in the ZIP; 40 comparable units currently listed for rent nearby; rentals at typical pace (median 24d on market — plan ~3-4 weeks tenant-placement turnaround); 3,974 units permitted in Palm Beach County in 2024 (1,012 in 5+ unit buildings).
- This rent runs 33% of the median local income ($62k/yr) — at the standard rent-burdened threshold; future hikes will face affordability resistance.
Forward outlook
- Local home prices are declining (-3.0%/yr); year-one equity from $774 of loan paydown is wiped out by about $3k of value loss. Plan a longer hold.
- Palm Beach County population projected at +30% by 2050 — long-run rental-demand tailwind backs the buy-and-hold thesis.
- At projected returns (-3.0% appreciation + 3.5% rent growth), your $31k cash investment doubles in ~10 years — after that, you're playing with house money.
Negotiation context
- It's been on market 192 days — a 12% lower offer ($98k) is reasonable based on typical stale-listing flexibility.
- 2 sale attempts; this cycle's ask has dropped $18k (14%) from the opening price — seller is motivated, your offer sets the floor, not the list.
Risks & watch-outs
- Watch-outs: built in 1959 — expect roof / HVAC / electrical / plumbing capex.
- Climate carrying-cost: moderate flood risk; severe wind risk, 99% chance of damaging wind over 30y; extreme-heat days projected 7→26/yr by 2055 (HVAC capex compounding) — expect insurance premiums to compound above CPI over the hold.
Questions for the listing agent
- It's been on market 192 days. Have you received any prior offers? Is the seller open to a 12% concession, seller financing, or rate buy-down credit?
- Built in 1959 — when were the roof, HVAC, electrical panel, plumbing, and water heater last replaced?
- What does the HOA fee cover, when was the last increase, and are there any pending special assessments or reserve-fund shortfalls?
- Any open or pending special assessments — roof, HVAC, plumbing, elevator, façade? What's the per-unit balance and payoff schedule, and is the seller paying it off at close or rolling it to the buyer?
- Why hasn't it sold? Are there any deal-killer items the seller is aware of (foundation, flood, title, zoning, code violations)?
- Is there a deadline driving the sale (1031 exchange, divorce, estate, relocation)? That informs how much negotiation room exists.
- What's the average days-on-market for RENTAL listings here right now (not sales)? A rising rental-DOM trend means longer vacancies and softer asking-rent achievability than the comps imply.
- What's the recent tenant-quality profile in this submarket — average credit score on applications, eviction rate, late-payment / NSF rate, and stable-employment percentage? A property-management company in the area should have these aggregated.
- How much new apartment / multifamily construction is in the pipeline within 1–3 miles? Heavy new supply (>2% of stock underway) typically softens rents 12–24 months out; light construction supports rent growth.
Investment metrics
- 1% rule
- 1.51% ✓
- Cap rate
- 9.37%
- Cash-on-cash
- 10.98%
- DSCR
- 1.49
- GRM
- 5.5
CMA / ARV
No comps found within radius.
Projected returns pro-forma
-3.0% appreciation · 3.53% rent growth · sell at horizon
- IRR
- 1.0%
- Equity multiple
- 1.04×
- Total profit
- $1,224
- Equity at exit
- $16,685
- IRR
- 11.4%
- Equity multiple
- 1.93×
- Total profit
- $29,108
- Equity at exit
- $9,675
Cash invested: $31,332 (down + closing). Projections, not guarantees.
Landlord ↔ Tenant lean methodology
- Overall (STATE)
- 87 Strongly Landlord-Friendly
- State Florida
- 87 Strongly Landlord-Friendly · R+3
- County
- — inherits STATE
- City
- — inherits STATE
ZIP-level market 33460
- Rents YoY
- 3.5%
- Active inventory
- 249
- Price-to-rent
- 5.5×
Monthly cashflow live
- Estimated rent
- $1,685 high interval (Pro) →
- Mortgage (P&I)
- −$587
- Tax from tax record
- −$186 /mo · $2,234/yr
- Insurance
- −$47
- HOA
- −$225
- Vacancy / Maint / Mgmt
- −$354
- Net cashflow
- $287
Break-even live
UW: 25.0% down · 7.5% · 30yr · 1.5% tax · 5.0% vac · 8.0% maint · 8.0% mgmt
Financing live
Cash to close
- Down payment
- $27,975
- Closing costs
- $3,357
- Reserves months
- —
- Total cash needed
- —
Loan-product check · same deal, 3 products live
Conventional
25% down · 7.5% · 30yr
- Down + closing
- —
- Monthly P&I
- —
- Monthly cashflow
- —
- DSCR
- —
- Eligible?
- —
Personal DTI + credit; lowest rate.
DSCR
20% down · 8.5% · 30yr
- Down + closing
- —
- Monthly P&I
- —
- Monthly cashflow
- —
- DSCR
- —
- Eligible?
- —
No personal income docs; deal must DSCR.
Hard money
10% down · 12.0% · 12mo
- Down + closing
- —
- Monthly P&I
- —
- Monthly cashflow
- —
- DSCR
- —
- Eligible?
- —
Short-term bridge; refi at stabilization.
Rent comps 40 comps
| Address | Beds | Baths | Sqft | Rent | $/sqft | DOM | Units | Dist |
|---|---|---|---|---|---|---|---|---|
| 626 N Federal Hwy Unit 3 Lake Worth Beach, FL | 1.0 | 1.0 | 640 | $1,600 | $2.50 | 24d | 1 | 0.04mi |
| 605 N Federal Hwy #9 Lake Worth Beach, FL | — | 1.0 | 400 | $1,650 | $4.12 | 15d | 1 | 0.09mi |
| 605 N Federal Hwy Unit 13 Lake Worth Beach, FL | — | 1.0 | 500 | $1,600 | $3.20 | 15d | 1 | 0.09mi |
| 625 N M St #1 Lake Worth Beach, FL | 1.0 | 1.0 | 640 | $1,600 | $2.50 | 24d | 1 | 0.10mi |
| 721 N M St Lake Worth Beach, FL | 1.0 | 1.0 | 450 | $1,800 | $4.00 | 24d | 1 | 0.10mi |
| 702 N L St Lake Worth, FL | 1.0 | 1.0 | 643 | $1,474 | $2.29 | 5d | 2 | 0.10mi |
| 509 6th Ave N Unit 3B Lake Worth, FL | 1.0 | 1.0 | 540 | $1,595 | $2.95 | 24d | 1 | 0.14mi |
| 526 6th Ave N Unit 519 Lake Worth Beach, FL | 1.0 | 1.0 | 700 | $1,395 | $1.99 | 22d | 1 | 0.14mi |
| 504 9th Ave N Unit 508 Lake Worth Beach, FL | 1.0 | 1.0 | 625 | $1,650 | $2.64 | 20d | 1 | 0.18mi |
| 911 N Federal Hwy Unit 205 Lake Worth Beach, FL | — | 1.0 | 500 | $2,150 | $4.30 | 24d | 1 | 0.19mi |
| 911 N Federal Hwy #106 Lake Worth Beach, FL | — | 1.0 | 400 | $2,200 | $5.50 | 24d | 1 | 0.19mi |
| 914 N Federal Hwy Unit 3 Lake Worth Beach, FL | 1.0 | 1.0 | 609 | $1,800 | $2.96 | 24d | 1 | 0.19mi |
| 430 N L St Lake Worth Beach, FL | 1.0 | 1.0 | 523 | $2,475 | $4.73 | 24d | 1 | 0.23mi |
| 430 N L St Lake Worth Beach, FL | 1.0 | 1.0 | 523 | $2,190 | $4.19 | 18d | 1 | 0.23mi |
| 817 N J St Lake Worth, FL | 2.0 | 1.0 | 652 | $2,000 | $3.07 | 24d | 1 | 0.28mi |
| 417 N K St Unit 1A Lake Worth Beach, FL | 1.0 | 1.0 | 620 | $1,550 | $2.50 | 5d | 1 | 0.30mi |
| 325 N L St Lake Worth Beach, FL | 2.0 | 1.0 | 500 | $1,600 | $3.20 | 24d | 1 | 0.32mi |
| 301 N Federal Hwy #2 Lake Worth, FL | — | 1.0 | 400 | $1,465 | $3.66 | 2d | 1 | 0.34mi |
| 1111 N Federal Hwy #6 Lake Worth Beach, FL | 1.0 | 1.0 | 494 | $1,550 | $3.14 | 24d | 1 | 0.35mi |
| 1111 N Federal Hwy #5 Lake Worth Beach, FL | 1.0 | 1.0 | 494 | $1,450 | $2.94 | 17d | 1 | 0.35mi |
| 801 N H St #1 Lake Worth Beach, FL | 1.0 | 1.0 | 600 | $1,550 | $2.58 | 24d | 1 | 0.41mi |
| 312 N H St Unit A Lake Worth Beach, FL | 2.0 | 2.0 | 594 | $2,200 | $3.70 | 24d | 1 | 0.47mi |
| 124 N Palmway Apt 5 Lake Worth Beach, FL | 1.0 | 1.0 | 624 | $1,525 | $2.44 | 24d | 1 | 0.48mi |
| 912 11th Ave N Lake Worth Beach, FL | 1.0 | 1.0 | 600 | $1,100 | $1.83 | 20d | 1 | 0.48mi |
| 120 N Palmway Unit 5 Lake Worth Beach, FL | 1.0 | 1.0 | 622 | $1,525 | $2.45 | 5d | 1 | 0.49mi |
| 920 11th Ave N Unit 912 Lake Worth Beach, FL | 1.0 | 1.0 | 600 | $1,100 | $1.83 | 20d | 1 | 0.49mi |
| 317 N H St Unit B Lake Worth Beach, FL | 1.0 | 1.0 | 420 | $1,200 | $2.86 | 24d | 1 | 0.49mi |
| 1118 N H St Unit 15 Lake Worth Beach, FL | 1.0 | 1.0 | 483 | $1,550 | $3.21 | 14d | 1 | 0.51mi |
| 112 Lake Ave Unit 10 Lake Worth Beach, FL | — | 1.0 | 450 | $1,850 | $4.11 | 7d | 1 | 0.57mi |
| 0 N K St Lake Worth Beach, FL | — | 1.0 | 500 | $1,450 | $2.90 | 24d | 1 | 0.60mi |
| 14 S M St Apt 3 Lake Worth Beach, FL | 1.0 | 1.0 | 600 | $1,800 | $3.00 | 3d | 1 | 0.61mi |
| 413 N E St Lake Worth Beach, FL | 2.0 | 1.0 | 646 | $2,000 | $3.10 | 24d | 1 | 0.62mi |
| 417 N E St Unit 39 Lake Worth Beach, FL | 1.0 | 1.0 | 700 | $1,550 | $2.21 | 24d | 1 | 0.62mi |
| 417 N E St Unit 36 Lake Worth Beach, FL | 1.0 | 1.0 | 650 | $1,550 | $2.38 | 12d | 1 | 0.62mi |
| 318 N E St Lake Worth Beach, FL | — | 1.0 | 584 | $1,800 | $3.08 | 14d | 1 | 0.62mi |
| 17 S L St #4 Lake Worth Beach, FL | — | 1.0 | 400 | $1,700 | $4.25 | 24d | 1 | 0.63mi |
| 15 S Golfview Rd Lake Worth, FL | 1.0 | 1.0 | 550 | $1,712 | $3.11 | 11d | 2 | 0.65mi |
| 15 S Golfview Rd #204 Lake Worth Beach, FL | 1.0 | 1.0 | 550 | $1,850 | $3.36 | 10d | 1 | 0.65mi |
| 30 S J St #14 Lake Worth Beach, FL | 1.0 | 1.0 | 620 | $1,500 | $2.42 | 24d | 1 | 0.67mi |
| 223 N E St Unit 4 Lake Worth Beach, FL | 1.0 | 1.0 | 650 | $1,695 | $2.61 | 24d | 1 | 0.68mi |
HOA detail condo
- Monthly dues
- $225 · $2,700/yr
- Assessments
- None detected in remarks — confirm with the listing agent.
Listing history 16 events
-
2026-06-18days on market $111,900 Active 192 DOM
-
2026-06-17days on market $111,900 Active 191 DOM
-
2026-06-16days on market $111,900 Active 190 DOM
-
2026-06-15days on market $111,900 Active 189 DOM
-
2026-06-13days on market $111,900 Active 187 DOM
-
2026-06-09days on market $111,900 Active 183 DOM
-
2026-06-07days on market $111,900 Active 181 DOM
-
2026-06-04pricedays on market $111,900 Active 178 DOM
-
2026-06-03days on market $119,000 Active 177 DOM
-
2026-06-01days on market $119,000 Active 175 DOM
-
2026-05-31days on market $119,000 Active 174 DOM
-
2026-05-22status Active
-
2026-05-22price $119,000
-
2026-05-15historical
-
2025-12-01$129,900 Active
-
2025-11-10historical $129,900
ⓘ Source: listings_history table (triggers on properties + properties_extension) + one-shot
backfill from property_details.listing_events for pre-trigger history.
Tax reassessment forecast FL · Resets to sale price
- Current annual tax
- $2,234 · $186/mo
- Projected year-2 tax
- $2,234 · $186/mo
- Expected delta
- $0/yr ($0/mo · 0.0%)
ⓘ Screening estimate from a state-policy table — verify with the county assessor before closing.
Climate risk First Street
- Flood 5/10 Major FEMA zone X (unshaded) · 23% chance over 30 yrs
- Wildfire 1/10 Low
- Heat 10/10 Extreme 7 d/yr ≥105°F today · 26 d/yr by 30 yrs out
- Wind 10/10 Extreme 99% chance of damaging wind over 30 yrs
- Air quality 2/10 Low 0 unhealthy d/yr today · 2 by 30 yrs out
Nearby sold comps map
Loading sold comps map…
Walkable amenities ~0.75 mi
Loading nearby amenities…
Taxation est. · year 1
- Rental income
- $20,223
- − Mortgage interest
- −$6,268
- − Property taxes
- −$2,234
- − Insurance
- −$560
- − Repairs & maintenance
- −$1,618
- − Management
- −$1,618
- − HOA
- −$2,700
- − Depreciation
- −$3,255
- Taxable income
- $1,970
- Est. tax owed @ 24.0%
- −$473
- After-tax cash flow
- $2,968/yr
For passive investors: Depreciation is non-cash, so a rental often shows a tax loss while cash-flowing — sheltering income. Rental losses are passive: they offset passive income freely, and up to $25,000/yr can offset ordinary (W-2) income if you actively participate and your MAGI is under $100k (phasing out to $0 by $150k); unused losses carry forward. On sale, claimed depreciation is recaptured at up to 25%, and gains may owe capital-gains tax (a 1031 exchange can defer both). Figures are a year-1 estimate at your 24.0% rate — not tax advice; consult a CPA.
Schools (NCES district)
- District
- Palm Beach
- NCES district ID
- 1201500
- Math proficiency
- 46% ▼ -16.00%
- Reading proficiency
- 53% ▼ -4.00%
- Median HH income
- $53,943
- Composite
- 42.72/100
- National rank
- #3160
- State rank
- #34 of 73 in FL
Livability — Lake Worth Beach
No livability data for this city. (Only ~50 U.S. cities are tracked.)
Census & demographics
- Census place
- Lake Worth Beach, FL
- County
- Palm Beach County · 1,438,312 people
- City population
- 129,577
- Metro
- Miami-Fort Lauderdale-Pompano Beach, FL
- Population (ZIP)
- 37,795
- Household income
- $62,090
- Rent vs Own
- Severe rent burden
- 2429.0
Population outlook (Palm Beach County) Hauer SSP2
- Today (2025)
- 1,637,487 people
- By 2030
- 1,743,255 · +6.5%
- By 2040
- 1,948,712 · +19.0%
- By 2050
- 2,132,979 · +30.3%
- By 2075
- 2,530,027 · +54.5%
- By 2100
- 2,706,979 · +65.3%
Race, ethnicity, and origin ACS 2023
- Neighborhood character
- Diverse neighborhood (Simpson 0.64)
- Race & ethnicity
- Hispanic / Latino 49% White 30% Two or more races 21% Black 17%
- Hispanic origin (detail)
- Mexican 5% Puerto Rican 5% Cuban 5% Dominican 2%
- Common ancestry
- Hispanic 8% Lithuanian 2% Slovak 1%
- Foreign-born
- 40% · Canada, Jamaica
- Languages at home
- 44% English-only · Spanish 42% French/Haitian/Cajun 9% Other Indo-European 2%
Political lean MEDSL · Palm Beach
- 2024 margin
- Toss-up / Even · D 50.0% · R 49.2%
- 2008→2024 swing
- -22.1pp toward R · 2008: 22.9pp · 2024: 0.8pp
- All cycles
- 2024: D+0.8 2020: D+12.8 2016: D+15.3 2012: D+17.0 2008: D+22.9
Not yet ingested
- Civics
- —
Market trends
- HPI YoY
- ▼ -345.65%
- Current HPI
- 484.2793
- Rent YoY
- ▲ 3.53%
- Metro
- Miami-Fort Lauderdale-Pompano Beach, FL
- State GDP YoY
- ▲ 3.28%
- F500 in state
- 36
Industry mix (Fortune 500 HQ in FL)
| Industry | F500 HQs | Revenue |
|---|---|---|
| Industrial Technology | 2 | $29B |
|
||
| Insurance | 2 | $17B |
|
||
| Retail | 1 | $60B |
|
||
| Technology Distribution | 1 | $58B |
|
||
| Homebuilding | 1 | $35B |
|
||
| Technology Manufacturing | 1 | $35B |
|
||
Price history
-8.4% since first listed5 events — show timeline
- 2026-05-22 Relisted — Beaches MLS
- 2026-05-22 Price Changed $119,000 Beaches MLS
- 2026-05-15 Listing Removed — Beaches MLS
- 2025-12-01 Listed $129,900 Beaches MLS
- 2025-11-10 Coming Soon $129,900 Beaches MLS
Property tax history
+20.0%/yrLatest (2025): $2,234 · +4.3% YoY. Source: county tax records.
Cash-flow waterfall
monthlySold comps — $/sqft
last 12 mo · ≤1 miLoading sold comps…