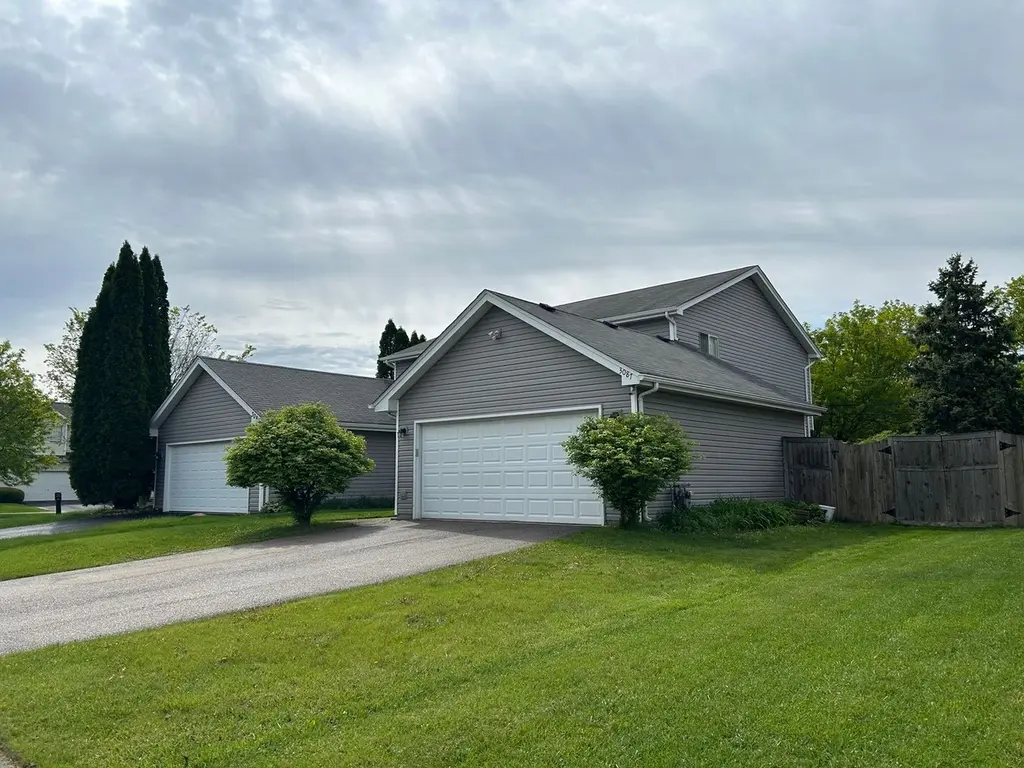
3087 Kelly Ct · Aurora, IL
Flood risk No data
- FEMA flood zone
- —
- Chance of flooding over 30 yrs
- —
- Est. flood insurance / yr
- —
Fire risk No data
- Est. fire insurance / yr
- —
Heat risk No data
- Hot days now (above threshold)
- —
- Hot days in 30 yrs
- —
Wind risk No data
- Chance of severe wind over 30 yrs
- —
Air-quality risk No data
- Unhealthy air days now
- —
- Unhealthy air days in 30 yrs
- —
Risk factors via First Street. Map © Google.
Why this score? — see what drove the D- grade
The composite is a weighted blend of 9 inputs, each scored 0–100. Each bar is that input's sub-score; the figure is the points it added to the 100-point composite (weight × sub-score).
- Cash flow +12.1/30.0
- ARV discount +5.4/15.0
- Schools +4.5/10.0
- Livability +3.8/5.0
- Rent growth +3.7/5.0
- 1% rule +3.6/10.0
- DSCR +3.6/10.0
- Condition / age +2.5/5.0
- Appreciation +0.0/10.0
$300,000
🖨 Deal sheet (PDF) 📄 Offer letter ✓ Due diligence
Listing remarks
Welcome to Aurora IL. Home to Illinois' oldest farmers market and so much more! Live peacefully in a Modern Townhome, that has everything you need, and lives much more like a detached home. This home has been very well cared for. From the second you enter the generously sized foyer to the great room! This space shows a vast bright living room, & open concept dining room space, finished with a contemporary chandelier, built-in buffet table, and wood laminate flooring. Buffet table is moveable and can be moved and used as a kitchen island. The walls and trims have been painted and are complimented with gray, cream and white, tones, and new baseboards; leading you to your clean light gra
Key facts
- Bright living room
- Great room
- $23 HOA
Tags
Property features AI
Exterior
- Parking: Includes a garage
- Home design: Condo; Two-story building; Two units in building
Interior
- Kitchen: Microwave; Dishwasher
- Bedrooms: Three bedrooms
- Bathrooms: One full bathroom and one half bathroom
- Heating & cooling: Air conditioning
- Interior features: Six total rooms
- Laundry & utility: Washer; Dryer
Neighborhood map
What this means for you Summary
Snapshot
- This is a 3-bed/1.5-bath townhouse listed at $300k.
Deal economics
- At list price, monthly cash flow is $-66 ($-791/yr) — negative.
- To cash-flow at today's rent, offer at most $290k (3.2% below list).
- To meet the 1% rule (rent ≥ 1% of price), the offer needs to be $257k (14.3% below list).
- Recommended offer: $257k (14.3% below list) — sets the bar for 1% rule.
- Cap rate 6.0% vs local median 3.5% in Aurora — top-decile yield for the area; either an underpriced asset or a hidden risk that comps aren't pricing in. Stress-test before assuming the spread holds.
Location & tenants
- Location reads 75/100 on livability (#232 in IL, #4,272 nationally) — a middle-class / working-renter tenant base. Strengths: commute A+, housing A+, employment A-; Watch: amenities F, health & safety F.
- Indian Prairie CUSD 204 (urban): math 47% / reading 47% proficiency, ranked #52 of 620 in IL (top 8%) — families likely to look elsewhere, expect single-tenant / working-renter base with shorter leases; only 13% free/reduced lunch — higher-income household profile.
- Zoned schools: Peter M Gombert Elementary Sch (math 27% / reading 22%, grade F, #850 of 2,056 statewide, top 45%, 403 students, 0% FRL); Still Middle School (math 37% / reading 40%, grade F, #154 of 665 statewide, top 24%, 642 students, 0% FRL); Waubonsie Valley High School (math 47% / reading 52%, grade D, #44 of 693 statewide, top 7%, 2,766 students, 0% FRL).
- Market conditions: Rents rising fast (+4.9%/yr); 60 active listings in the ZIP; 40 comparable units currently listed for rent nearby; rentals at typical pace (median 20d on market — plan ~3-4 weeks tenant-placement turnaround); solid renter incomes; 1,378 units permitted in DuPage County in 2024 (594 in 5+ unit buildings).
- This rent runs 31% of the median local income ($98k/yr) — at the standard rent-burdened threshold; future hikes will face affordability resistance.
Forward outlook
- Local home prices are declining (-3.0%/yr); year-one equity from $2k of loan paydown is wiped out by about $9k of value loss. Plan a longer hold.
Negotiation context
- Only 2 days on market — expect competitive offers; lowballing is unlikely to land.
Questions for the listing agent
- What do current leases actually rent for vs. the listed asking? Can we see a recent rent roll and the last 12 months of T-12 income?
- What does the HOA fee cover, when was the last increase, and are there any pending special assessments or reserve-fund shortfalls?
- Is there a deadline driving the sale (1031 exchange, divorce, estate, relocation)? That informs how much negotiation room exists.
- Schools are F-rated, which usually means shorter tenancies and higher turnover. Who's the typical renter profile here, and what's been the actual vacancy rate?
- The area grade is low — what's the realistic commute time and amenity access for the typical tenant pool here? Any planned neighborhood developments (good or bad) we should know about?
- What's the average days-on-market for RENTAL listings here right now (not sales)? A rising rental-DOM trend means longer vacancies and softer asking-rent achievability than the comps imply.
- What's the recent tenant-quality profile in this submarket — average credit score on applications, eviction rate, late-payment / NSF rate, and stable-employment percentage? A property-management company in the area should have these aggregated.
- How much new for-sale + rental construction is in the pipeline within 1–3 miles? Heavy new supply typically softens prices + rents 12–24 months out; constrained supply supports both.
Investment metrics
- 1% rule
- 0.86% ✗
- Cap rate
- 6.03%
- Cash-on-cash
- -0.94%
- DSCR
- 0.96
- GRM
- 9.7
CMA / ARV
- ARV (on-the-fly)
- $286,479
- Comps found
- 12
Show comp detail 12 sales within ~0.75 mi
| Address | Dist | Beds/Ba | Sqft | Sold | Price | $/sf | Match |
|---|---|---|---|---|---|---|---|
| 2843 Dorothy Dr | 0.22mi | 3/1.5 | 1,251 (0%) | 3mo | $325,000 | $260 | 87 |
| 2970 Dorothy Dr | 0.14mi | 3/1.5 | 1,270 (+2%) | 8mo | $298,000 | $235 | 85 |
| 2992 Dorothy Dr | 0.12mi | 3/1.5 | 1,251 (0%) | 14mo | $270,000 | $216 | 83 |
| 2870 Dorothy Dr | 0.25mi | 3/1.5 | 1,235 (-1%) | 7mo | $270,000 | $219 | 80 |
| 2922 Dorothy Dr | 0.19mi | 3/1.5 | 1,251 (0%) | 16mo | $285,000 | $228 | 78 |
| 1154 Brunswick Ln | 0.62mi | 3/1.5 | 1,297 (+4%) | 1mo | $322,500 | $249 | 64 |
| 1140 Brunswick Ln | 0.60mi | 3/1.5 | 1,194 (-5%) | 2mo | $210,020 | $176 | 63 |
| 1200 Andover Cir | 0.56mi | 3/1.5 | 1,159 (-7%) | 7mo | $265,000 | $229 | 56 |
| 1114 Brunswick Ln | 0.68mi | 3/1.5 | 1,194 (-5%) | 7mo | $300,000 | $251 | 55 |
| 1165 S Brockton Ct | 0.57mi | 3/1.5 | 1,194 (-5%) | 19mo | $264,900 | $222 | 50 |
| 3180 Cambria Ct #3180 | 0.29mi | 2/1.5 (-1) | 1,405 (+12%) | 15mo | $277,000 | $197 | 48 |
| 1202 Andover Cir | 0.56mi | 3/1.5 | 1,194 (-5%) | 22mo | $285,000 | $239 | 48 |
Match score weights: distance 35% · size 25% · config 20% · recency 20%. Top-matched comps best support the ARV.
Projected returns pro-forma
-3.0% appreciation · 4.91% rent growth · sell at horizon
- IRR
- -15.7%
- Equity multiple
- 0.43×
- Total profit
- $-47,723
- Equity at exit
- $44,731
- IRR
- -4.2%
- Equity multiple
- 0.70×
- Total profit
- $-25,269
- Equity at exit
- $25,939
Cash invested: $84,000 (down + closing). Projections, not guarantees.
Landlord ↔ Tenant lean methodology
- Overall (STATE)
- 43 Moderately Tenant-Leaning
- State Illinois
- 43 Moderately Tenant-Leaning · D+7
- County
- — inherits STATE
- City
- — inherits STATE
ZIP-level market 60504
- Home prices YoY
- -33.8%
- Rents YoY
- 4.9%
- Active inventory
- 60
- Price-to-rent
- 9.7×
Monthly cashflow live
- Estimated rent
- $2,570 high interval (Pro) →
- Mortgage (P&I)
- −$1,573
- Tax est. 1.5%
- −$375 /mo · $4,500/yr
- Insurance
- −$125
- HOA
- −$23
- Vacancy / Maint / Mgmt
- −$540
- Net cashflow
- $-66
Break-even live
Sensitivity live
| Price | -10% $141 | -5% $38 | +0% $-66 | +5% $-170 | +10% $-273 |
|---|---|---|---|---|---|
| Rent | -10% $-269 | -5% $-167 | +0% $-66 | +5% $36 | +10% $137 |
| Rate | -1.0pp $85 | -0.5pp $10 | base $-66 | +0.5pp $-144 | +1.0pp $-223 |
UW: 25.0% down · 7.5% · 30yr · 1.5% tax · 5.0% vac · 8.0% maint · 8.0% mgmt
Financing live
Cash to close
- Down payment
- $75,000
- Closing costs
- $9,000
- Reserves months
- —
- Total cash needed
- —
Loan-product check · same deal, 3 products live
Conventional
25% down · 7.5% · 30yr
- Down + closing
- —
- Monthly P&I
- —
- Monthly cashflow
- —
- DSCR
- —
- Eligible?
- —
Personal DTI + credit; lowest rate.
DSCR
20% down · 8.5% · 30yr
- Down + closing
- —
- Monthly P&I
- —
- Monthly cashflow
- —
- DSCR
- —
- Eligible?
- —
No personal income docs; deal must DSCR.
Hard money
10% down · 12.0% · 12mo
- Down + closing
- —
- Monthly P&I
- —
- Monthly cashflow
- —
- DSCR
- —
- Eligible?
- —
Short-term bridge; refi at stabilization.
Rent comps 40 comps
| Address | Beds | Baths | Sqft | Rent | $/sqft | DOM | Units | Dist |
|---|---|---|---|---|---|---|---|---|
| 3162 Cambria Ct Aurora, IL | 3.0 | 2.5 | 1620 | $2,500 | $1.54 | 45d | 1 | 0.26mi |
| 1860 Middlebury Dr Unit 1860 Aurora, IL | 2.0 | 2.5 | 1471 | $2,450 | $1.67 | 21d | 1 | 0.30mi |
| 3153 Teal Bay Ct Aurora, IL | 2.0 | 2.5 | 1600 | $2,400 | $1.50 | 9d | 1 | 0.34mi |
| 3192 Teal Bay Ct Aurora, IL | 2.0 | 2.5 | 1600 | $2,500 | $1.56 | 45d | 1 | 0.34mi |
| 1914 Spinnaker Ct Aurora, IL | 3.0 | 2.5 | 1412 | $3,000 | $2.12 | 45d | 1 | 0.34mi |
| 1632 Normantown Rd Naperville, IL | 2.0 | 1.5 | 1052 | $2,150 | $2.04 | 3d | 1 | 0.35mi |
| 1420 Andover Dr Aurora, IL | 3.0 | 1.5 | 1300 | $2,200 | $1.69 | 4d | 1 | 0.41mi |
| 1516 Normantown Rd Unit 1516 Naperville, IL | 2.0 | 1.5 | 1052 | $2,100 | $2.00 | 26d | 1 | 0.41mi |
| 1210 Andover Cir Aurora, IL | 3.0 | 1.5 | 1194 | $2,100 | $1.76 | 9d | 1 | 0.59mi |
| 1464 Farrington Ln Aurora, IL | 4.0 | 2.5 | 1836 | $3,300 | $1.80 | 0d | 1 | 0.62mi |
| 1419 Farrington Ln Aurora, IL | 3.0 | 1.5 | 1476 | $2,959 | $2.00 | 4d | 1 | 0.62mi |
| 1227 Andover Cir Aurora, IL | 3.0 | 1.5 | 1194 | $2,300 | $1.93 | 45d | 1 | 0.63mi |
| 1111 Brunswick Ln Aurora, IL | 3.0 | 1.5 | 1159 | $2,200 | $1.90 | 14d | 1 | 0.67mi |
| 1111 Brunswick Ln Aurora, IL | 3.0 | 2.0 | 1159 | $2,200 | $1.90 | 8d | 1 | 0.67mi |
| 1045 Camden Ln Aurora, IL | 3.0 | 1.5 | 1620 | $2,836 | $1.75 | 13d | 1 | 0.83mi |
| 2598 Hillsboro Blvd Aurora, IL | 3.0 | 2.5 | 1482 | $2,395 | $1.62 | 22d | 1 | 0.87mi |
| 1009 Pheasant Run Ln Aurora, IL | 3.0 | 2.0 | 1034 | $2,050 | $1.98 | 45d | 1 | 0.88mi |
| 2516 Hillsboro Blvd Aurora, IL | 2.0 | 2.5 | 1482 | $2,300 | $1.55 | 19d | 1 | 0.90mi |
| 2575 Hillsboro Blvd Aurora, IL | 3.0 | 2.5 | 1530 | $2,500 | $1.63 | 45d | 1 | 0.91mi |
| 826 Terrace Lake Dr Aurora, IL | 2.0 | 1.5 | 1090 | $2,132 | $1.96 | 0d | 9 | 0.93mi |
| 2270 Georgetown Cir Unit 2270 Aurora, IL | 3.0 | 2.5 | 1533 | $2,800 | $1.83 | 45d | 1 | 0.94mi |
| 4475 Monroe Ct Naperville, IL | 2.0 | 2.5 | 1555 | $3,100 | $1.99 | 0d | 1 | 0.99mi |
| 2460 Georgetown Cir Aurora, IL | 2.0 | 2.5 | 1532 | $2,400 | $1.57 | 3d | 1 | 1.03mi |
| 4462 Monroe Ct Naperville, IL | 2.0 | 2.5 | 1783 | $3,400 | $1.91 | 45d | 1 | 1.03mi |
| 2531 Congress Ave #2531 Aurora, IL | 3.0 | 2.5 | 1532 | $2,500 | $1.63 | 45d | 1 | 1.03mi |
| 4456 Monroe Ct Naperville, IL | 2.0 | 2.5 | 1588 | $2,795 | $1.76 | 45d | 1 | 1.03mi |
| 4456 Monroe Ct Naperville, IL | 2.0 | 2.5 | 1600 | $2,850 | $1.78 | 3d | 1 | 1.03mi |
| 4456 Monroe Ct Naperville, IL | 2.0 | 2.5 | 1588 | $2,795 | $1.76 | 13d | 1 | 1.03mi |
| 2550 Providence Ave Aurora, IL | 2.0 | 2.5 | 1550 | $2,300 | $1.48 | 45d | 1 | 1.04mi |
| 4444 Monroe Ct Unit 4444 Naperville, IL | 3.0 | 2.5 | 1783 | $3,300 | $1.85 | 3d | 1 | 1.04mi |
| 4444 Monroe Ct Naperville, IL | 3.0 | 2.5 | 1783 | $3,300 | $1.85 | 0d | 1 | 1.04mi |
| 2226 Daybreak Dr #2226 Aurora, IL | 3.0 | 2.5 | 1627 | $2,500 | $1.54 | 45d | 1 | 1.06mi |
| 2909 Madison Dr Naperville, IL | 3.0 | 2.5 | 1783 | $3,095 | $1.74 | 20d | 1 | 1.09mi |
| 2205 Daybreak Dr #2205 Aurora, IL | 2.0 | 2.5 | 1700 | $2,500 | $1.47 | 7d | 1 | 1.10mi |
| 2923 Madison Dr Naperville, IL | 2.0 | 2.5 | 1550 | $2,550 | $1.65 | 23d | 1 | 1.11mi |
| 2933 Madison Dr Naperville, IL | 2.0 | 2.5 | 1783 | $3,000 | $1.68 | 12d | 1 | 1.12mi |
| 2995 Madison Dr Naperville, IL | 2.0 | 2.5 | 1793 | $3,000 | $1.67 | 13d | 1 | 1.19mi |
| 2420 Harbor Ct Aurora, IL | 3.0 | 2.0 | 1705 | $3,150 | $1.85 | 26d | 1 | 1.21mi |
| 710 S Eola Rd Aurora, IL | 1.0–2.0 | 1.0–2.0 | 1105 | $2,448 | $2.22 | 0d | 32 | 1.23mi |
| 3302 Acorn Ct Aurora, IL | 3.0 | 1.0 | 1018 | $1,900 | $1.87 | 26d | 1 | 1.27mi |
HOA detail
- Monthly dues
- $23 · $276/yr
Listing history 6 events
-
2026-06-21statusdays on market $300,000 Active 2 DOM
-
2026-06-18days on market $300,000 Coming Soon 3 DOM
-
2026-06-17days on market $300,000 Coming Soon 2 DOM
-
2026-06-16remarks 695-char remark
-
2026-06-16remarks 691-char remark
-
2026-06-16$300,000 Coming Soon 1 DOM
ⓘ Source: listings_history table (triggers on properties + properties_extension) + one-shot
backfill from property_details.listing_events for pre-trigger history.
Nearby sold comps map
Loading sold comps map…
Walkable amenities ~0.75 mi
Loading nearby amenities…
Taxation est. · year 1
- Rental income
- $30,841
- − Mortgage interest
- −$16,805
- − Property taxes
- −$4,500
- − Insurance
- −$1,500
- − Repairs & maintenance
- −$2,467
- − Management
- −$2,467
- − HOA
- −$276
- − Depreciation
- −$8,727
- Taxable loss
- −$5,902
- Est. tax savings @ 24.0%
- +$1,416
- After-tax cash flow
- $626/yr
For passive investors: Depreciation is non-cash, so a rental often shows a tax loss while cash-flowing — sheltering income. Rental losses are passive: they offset passive income freely, and up to $25,000/yr can offset ordinary (W-2) income if you actively participate and your MAGI is under $100k (phasing out to $0 by $150k); unused losses carry forward. On sale, claimed depreciation is recaptured at up to 25%, and gains may owe capital-gains tax (a 1031 exchange can defer both). Figures are a year-1 estimate at your 24.0% rate — not tax advice; consult a CPA.
Schools (NCES district)
- District
- Indian Prairie CUSD 204
- NCES district ID
- 1741690
- Math proficiency
- 47% ▼ -10.00%
- Reading proficiency
- 47% ▼ -12.00%
- Median HH income
- $100,618
- Composite
- 45.14/100
- National rank
- #2680
- State rank
- #52 of 620 in IL
Livability — Aurora
- Score
- 75/100
- State rank
- #232
- US rank
- #4272
Category grades
Schools grade is shown separately in the Schools card above.
Census & demographics
- Census place
- Aurora, IL
- County
- DuPage County · 904,569 people
- City population
- 186,692
- Metro
- Chicago-Naperville-Elgin, IL-IN-WI
- Population (ZIP)
- 39,358
- Household income
- $98,008
- Rent vs Own
- Severe rent burden
- 1270.0
Population outlook (DuPage County) Hauer SSP2
- Today (2025)
- 960,187 people
- By 2030
- 965,850 · +0.6%
- By 2040
- 965,812 · +0.6%
- By 2050
- 954,890 · -0.6%
- By 2075
- 910,185 · -5.2%
- By 2100
- 816,255 · -15.0%
Race, ethnicity, and origin ACS 2023
- Neighborhood character
- Highly diverse neighborhood (Simpson 0.75)
- Race & ethnicity
- White 38% Hispanic / Latino 23% Asian 20% Two or more races 15% Black 14%
- Hispanic origin (detail)
- Mexican 18% Puerto Rican 1%
- Common ancestry
- Romanian 5% Italian 1% Slovak 1%
- Foreign-born
- 24% · Canada, China, South Korea
- Languages at home
- 64% English-only · Spanish 16% Other Indo-European 8% Other Asian/Pacific 5%
Political lean MEDSL · DuPage
- 2024 margin
- D (+13.3) · D 55.9% · R 42.5% · Other 1.6%
- 2008→2024 swing
- +2.5pp toward D · 2008: 10.8pp · 2024: 13.3pp
- All cycles
- 2024: D+13.3 2020: D+18.1 2016: D+14.1 2012: D+1.0 2008: D+10.8
Not yet ingested
- Civics
- —
Market trends
- HPI YoY
- ▼ -116.46%
- Current HPI
- 228.255
- Rent YoY
- ▲ 4.91%
- Metro
- Chicago-Naperville-Elgin, IL-IN-WI
- State GDP YoY
- ▲ 1.59%
- F500 in state
- 60
Industry mix (Fortune 500 HQ in IL)
| Industry | F500 HQs | Revenue |
|---|---|---|
| Insurance | 4 | $201B |
|
||
| Consumer Goods | 4 | $87B |
|
||
| Industrial Machinery | 3 | $64B |
|
||
| Healthcare | 2 | $55B |
|
||
| Retail / Pharmacy | 1 | $148B |
|
||
| Agriculture / Food | 1 | $86B |
|
||
Cash-flow waterfall
monthlySold comps — $/sqft
last 12 mo · ≤1 miLoading sold comps…