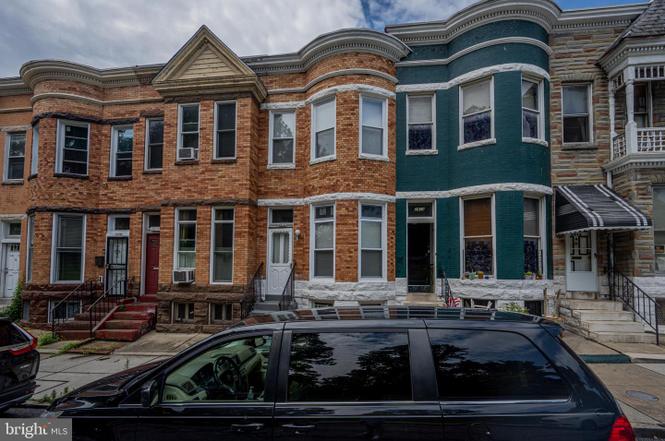
2812 Auchentoroly Ter · Baltimore, MD
Flood risk 1/10 · Minimal
- FEMA flood zone
- X (unshaded)
- Chance of flooding over 30 yrs
- 0.0%
- Est. flood insurance / yr
- $473 – $860
Fire risk 1/10 · Minimal
- Est. fire insurance / yr
- $755 – $1,403
Heat risk 7/10 · Major
- Hot days now (above 103°F)
- 7 days/yr
- Hot days in 30 yrs
- 15 days/yr
Wind risk 6/10 · Moderate
- Chance of severe wind over 30 yrs
- 27.0%
Air-quality risk 4/10 · Minor
- Unhealthy air days now
- 6 days/yr
- Unhealthy air days in 30 yrs
- 7 days/yr
Risk factors via First Street. Map © Google.
Why this score? — see what drove the C- grade
The composite is a weighted blend of 9 inputs, each scored 0–100. Each bar is that input's sub-score; the figure is the points it added to the 100-point composite (weight × sub-score).
- Cash flow +22.4/30.0
- ARV discount +7.5/15.0
- DSCR +7.2/10.0
- 1% rule +5.6/10.0
- Rent growth +4.2/5.0
- Livability +3.8/5.0
- Condition / age +2.5/5.0
- Schools +1.0/10.0
- Appreciation +0.0/10.0
$159,000
🖨 Deal sheet 📄 Offer letter ✓ Due diligence
Listing remarks
Back on Market! Buyer's home sale contingency fell through. Don't Miss Out: $10,000 Price Improvement! Experience city living & nature in this expansive multi-level 3-bedroom historic Townhouse by Druid Hill Park! Featuring a finished basement, dedicated laundry room, separate living/dining areas, lovely deck, and backyard for entertaining, plus multi-million dollar park upgrades coming soon. Now is the time to invest in this sought-after, tranquil neighborhood in Reservoir Hill. Your ready-to-move-in home awaits.
Key facts
- Laundry room
- Separate dining room
- Backyard
Tags
Property features AI
Exterior
- Parking: On-street parking
- Utilities: Public water; Public sewer
- Home design: Interior townhouse/rowhouse; Fee simple ownership
- Construction: Brick construction; Brick/mortar foundation; Built year recorded by assessor
- Exterior features: Basement present (other type); Below-grade and above-grade structures
Interior
- Kitchen: Gas oven/range; Refrigerator; Kitchen table space
- Bedrooms: Three bedrooms on the first upper level
- Flooring: Carpet
- Bathrooms: One full bathroom (all upper levels)
- Heating & cooling: Radiator heating (natural gas); Central air conditioning (natural gas)
- Interior features: Carpeted areas; Ceiling fans; Traditional floor plan; Formal dining room; Dining area; Master bedroom with bay front; Walk-in closet(s); Skylight(s); Kitchen with table space; Tub/shower
- Laundry & utility: Washer; Gas dryer; Gas water heater
Neighborhood map
What this means for you Summary
Snapshot
- This is a 3-bed/1.0-bath townhouse listed at $159k.
Deal economics
- At list price, monthly cash flow is $265 ($3k/yr) — positive.
- The deal already cash-flows at list — no discount required.
- Meets the 1% rule at list price ($2k rent vs $159k).
- Recommended offer: $140k (12.0% below list) — sets the bar for market timing.
- Cap rate 8.3% vs local median 6.0% in Baltimore — top-decile yield for the area; either an underpriced asset or a hidden risk that comps aren't pricing in. Stress-test before assuming the spread holds.
Location & tenants
- Location reads 76/100 on livability (#90 in MD, #3,396 nationally) — a middle-class / working-renter tenant base. Strengths: amenities A+, commute A+, housing A+; Watch: schools D, crime F.
- Baltimore City Public Schools (urban): math 7% / reading 16% proficiency, ranked #24 of 24 in MD (top 100%) — low school quality limits family demand, transient renter base, plan for 1-2y turnover; 79% free/reduced lunch — lower-income household profile, screen leases tightly.
- Market conditions: Rents rising fast (+6.6%/yr); 331 active listings in the ZIP; 40 comparable units currently listed for rent nearby; rentals at typical pace (median 24d on market — plan ~3-4 weeks tenant-placement turnaround); 42% of comp listings sitting > 30 days — soft ceiling on asking rent; lower-income renter base — watch delinquency; 1,273 units permitted in Baltimore city in 2024 (1,104 in 5+ unit buildings).
- At $1,679/mo this rent would consume 52% of the median local household income ($38k/yr) (locally 2921% of renters already pay >50% of income on rent) — very limited rent-growth headroom before tenants either downsize or default.
Forward outlook
- Local home prices are declining (-3.0%/yr); year-one equity from $1k of loan paydown is wiped out by about $5k of value loss. Plan a longer hold.
- Baltimore County population projected to shrink 4% by 2050 — rents likely to lag national; underwrite the cash flow, not the appreciation.
- At projected returns (-3.0% appreciation + 6.6% rent growth), your $45k cash investment doubles in ~9 years — after that, you're playing with house money.
Negotiation context
- It's been on market 248 days — a 12% lower offer ($140k) is reasonable based on typical stale-listing flexibility.
- 7 sale attempts since 30y ago; this cycle's ask has dropped $10k (6%) from the opening price — seller is motivated, your offer sets the floor, not the list.
- Current owner paid $65k; list at $159k implies a 145% gain — meaningful room to come down on a strong offer.
Risks & watch-outs
- Watch-outs: built in 1900 — expect roof / HVAC / electrical / plumbing capex.
- Climate carrying-cost: major wind risk, 27% chance of damaging wind over 30y; extreme-heat days projected 7→15/yr by 2055 (HVAC capex compounding) — expect insurance premiums to compound above CPI over the hold.
Questions for the listing agent
- It's been on market 248 days. Have you received any prior offers? Is the seller open to a 12% concession, seller financing, or rate buy-down credit?
- Built in 1900 — when were the roof, HVAC, electrical panel, plumbing, and water heater last replaced?
- Why hasn't it sold? Are there any deal-killer items the seller is aware of (foundation, flood, title, zoning, code violations)?
- Is there a deadline driving the sale (1031 exchange, divorce, estate, relocation)? That informs how much negotiation room exists.
- Schools are D-rated, which usually means shorter tenancies and higher turnover. Who's the typical renter profile here, and what's been the actual vacancy rate?
- Crime grade is F in this area — have there been break-ins, vandalism, or insurance claims at this property in the last 3 years? What carrier currently insures it and at what premium?
- What's the average days-on-market for RENTAL listings here right now (not sales)? A rising rental-DOM trend means longer vacancies and softer asking-rent achievability than the comps imply.
- What's the recent tenant-quality profile in this submarket — average credit score on applications, eviction rate, late-payment / NSF rate, and stable-employment percentage? A property-management company in the area should have these aggregated.
- How much new for-sale + rental construction is in the pipeline within 1–3 miles? Heavy new supply typically softens prices + rents 12–24 months out; constrained supply supports both.
Investment metrics
- 1% rule
- 1.06% ✓
- Cap rate
- 8.29%
- Cash-on-cash
- 7.13%
- DSCR
- 1.32
- GRM
- 7.9
CMA / ARV
- ARV (on-the-fly)
- $99,084
- Comps found
- 12
Show comp detail 12 sales within ~0.75 mi
| Address | Dist | Beds/Ba | Sqft | Sold | Price | $/sf | Match |
|---|---|---|---|---|---|---|---|
| 2453 Mcculloh St | 0.37mi | 3/1.0 | 1,460 (+2%) | 3mo | $99,900 | $68 | 77 |
| 2311 Orem Ave | 0.09mi | 3/1.0 | 1,284 (-11%) | 4mo | $35,000 | $27 | 74 |
| 2105 Whittier Ave | 0.24mi | 3/1.5 | 1,587 (+10%) | 1mo | $80,000 | $50 | 68 |
| 2818 Woodbrook Ave | 0.12mi | 3/1.0 | 1,232 (-14%) | 3mo | $45,500 | $37 | 68 |
| 2820 Woodbrook Ave | 0.12mi | 3/1.5 | 1,232 (-14%) | 2mo | $85,000 | $69 | 67 |
| 2521 Reisterstown Rd | 0.33mi | 3/2.0 | 1,578 (+10%) | 3mo | $215,000 | $136 | 62 |
| 1719 Baker St | 0.63mi | 2/1.0 (-1) | 1,400 (-2%) | 2mo | $19,250 | $14 | 60 |
| 1722 N Bentalou St | 0.71mi | 4/2.0 (+1) | 1,450 (+1%) | 3mo | $245,000 | $169 | 54 |
| 2115 Mcculloh St | 0.67mi | 3/1.5 | 1,350 (-6%) | 4mo | $77,000 | $57 | 54 |
| 700 Cumberland St | 0.50mi | 4/2.0 (+1) | 1,280 (-11%) | 3mo | $107,800 | $84 | 47 |
| 1735 N Payson St | 0.55mi | 3/1.5 | 1,250 (-13%) | 6mo | $95,000 | $76 | 46 |
| 2009 Ruxton Ave | 0.61mi | 4/2.0 (+1) | 1,600 (+11%) | 1mo | $234,000 | $146 | 43 |
Match score weights: distance 35% · size 25% · config 20% · recency 20%. Top-matched comps best support the ARV.
Projected returns pro-forma
-3.0% appreciation · 6.63% rent growth · sell at horizon
- IRR
- -1.5%
- Equity multiple
- 0.94×
- Total profit
- $-2,555
- Equity at exit
- $23,707
- IRR
- 11.7%
- Equity multiple
- 2.07×
- Total profit
- $47,592
- Equity at exit
- $13,747
Cash invested: $44,520 (down + closing). Projections, not guarantees.
Landlord ↔ Tenant lean methodology
- Overall (CITY)
- 12 Strongly Tenant-Friendly
- State Maryland
- 27 Tenant-Leaning · D+14
- County
- — inherits STATE
- City Baltimore
- 12 Strongly Tenant-Friendly · D+58
ZIP-level market 21217
- Rents YoY
- 6.6%
- Active inventory
- 331
- Price-to-rent
- 7.9×
Monthly cashflow live
- Estimated rent
- $1,679 high interval (Pro) →
- Mortgage (P&I)
- −$834
- Tax from tax record
- −$162 /mo · $1,942/yr
- Insurance
- −$66
- HOA
- −$0
- Vacancy / Maint / Mgmt
- −$353
- Net cashflow
- $265
Break-even live
UW: 25.0% down · 7.5% · 30yr · 1.5% tax · 5.0% vac · 8.0% maint · 8.0% mgmt
Financing live
Cash to close
- Down payment
- $39,750
- Closing costs
- $4,770
- Reserves months
- —
- Total cash needed
- —
Loan-product check · same deal, 3 products live
Conventional
25% down · 7.5% · 30yr
- Down + closing
- —
- Monthly P&I
- —
- Monthly cashflow
- —
- DSCR
- —
- Eligible?
- —
Personal DTI + credit; lowest rate.
DSCR
20% down · 8.5% · 30yr
- Down + closing
- —
- Monthly P&I
- —
- Monthly cashflow
- —
- DSCR
- —
- Eligible?
- —
No personal income docs; deal must DSCR.
Hard money
10% down · 12.0% · 12mo
- Down + closing
- —
- Monthly P&I
- —
- Monthly cashflow
- —
- DSCR
- —
- Eligible?
- —
Short-term bridge; refi at stabilization.
Rent comps 40 comps
| Address | Beds | Baths | Sqft | Rent | $/sqft | DOM | Units | Dist |
|---|---|---|---|---|---|---|---|---|
| 2231 Orem Ave Baltimore, MD | 3.0 | 1.5 | 1140 | $1,750 | $1.54 | 17d | 1 | 0.14mi |
| 2301 Whittier Ave Unit 3 Baltimore, MD | 2.0 | 2.0 | 1104 | $1,650 | $1.49 | 43d | 1 | 0.15mi |
| 2301 Whittier Ave Unit 1 Baltimore, MD | 2.0 | 1.0 | 1104 | $1,400 | $1.27 | 43d | 1 | 0.15mi |
| 2301 Whittier Ave Unit 2 Baltimore, MD | 2.0 | 2.0 | 1104 | $1,400 | $1.27 | 43d | 1 | 0.15mi |
| 2201 Whittier Ave Baltimore, MD | 4.0 | 2.0 | 1750 | $1,700 | $0.97 | 18d | 1 | 0.19mi |
| 2201 Whittier Ave Baltimore, MD | 4.0 | 2.0 | 1750 | $1,700 | $0.97 | 43d | 1 | 0.19mi |
| 2330 Bryant Ave Unit 4 Baltimore, MD | 2.0 | 1.0 | 950 | $1,500 | $1.58 | 20d | 1 | 0.19mi |
| 2505 Woodbrook Ave Baltimore, MD | 4.0 | 2.0 | 1256 | $1,745 | $1.39 | 2d | 1 | 0.26mi |
| 2636 Pennsylvania Ave Baltimore, MD | 1.0–2.0 | 1.0 | 846 | $956 | $1.13 | 24d | 4 | 0.28mi |
| 1507 Retreat St Unit 1 Baltimore, MD | 3.0 | 3.0 | 1098 | $2,500 | $2.28 | 43d | 1 | 0.29mi |
| 1515 Retreat St Baltimore, MD | 3.0 | 2.0 | 1098 | $1,800 | $1.64 | 24d | 1 | 0.30mi |
| 3401 Woodbrook Ave Unit 1 Baltimore, MD | 3.0 | 1.0 | 900 | $1,199 | $1.33 | 24d | 1 | 0.30mi |
| 2614 Pennsylvania Ave Baltimore, MD | 1.0–3.0 | 1.0–2.0 | 982 | $1,141 | $1.16 | 4d | 4 | 0.32mi |
| 2511 Madison Ave #2 Baltimore, MD | 3.0 | 1.0 | 1100 | $1,650 | $1.50 | 43d | 1 | 0.36mi |
| 2449 Druid Hill Ave Baltimore, MD | 2.0 | 1.0 | 1100 | $1,800 | $1.64 | 43d | 1 | 0.36mi |
| 2433 Druid Hill Ave Baltimore, MD | 2.0 | 2.5 | 1092 | $1,999 | $1.83 | 43d | 1 | 0.38mi |
| 2409 Francis St Baltimore, MD | 3.0 | 1.0 | 1298 | $1,500 | $1.16 | 43d | 1 | 0.39mi |
| 1121 Whitelock St Baltimore, MD | 2.0 | 1.0 | 1180 | $1,300 | $1.10 | 43d | 1 | 0.45mi |
| 1930 N Payson St Baltimore, MD | 2.0 | 2.0 | 980 | $1,500 | $1.53 | 24d | 1 | 0.46mi |
| 1624 Westwood Ave Baltimore, MD | 3.0 | 2.0 | 1000 | $1,900 | $1.90 | 43d | 1 | 0.47mi |
| 1806 N Mount St Baltimore, MD | 3.0 | 3.0 | 1200 | $1,700 | $1.42 | 20d | 1 | 0.47mi |
| 1729 N Fulton Ave Baltimore, MD | 3.0 | 2.0 | 1081 | $1,795 | $1.66 | 43d | 1 | 0.51mi |
| 1205 Clendenin St Baltimore, MD | 3.0 | 1.5 | 1560 | $800 | $0.51 | 24d | 1 | 0.52mi |
| 519 Sanford Pl Baltimore, MD | 3.0 | 1.0 | 1300 | $1,650 | $1.27 | 16d | 1 | 0.53mi |
| 2339 Eutaw Pl Ste 1 Baltimore, MD | 2.0 | 1.0 | 1300 | $1,275 | $0.98 | 43d | 1 | 0.53mi |
| 2204 Clifton Ave Baltimore, MD | 3.0 | 1.0 | 1400 | $1,450 | $1.04 | 4d | 1 | 0.53mi |
| 810 Brooks Ln Unit 2 Baltimore, MD | 3.0 | 1.0 | 900 | $1,350 | $1.50 | 20d | 1 | 0.55mi |
| 1722 N Monroe St Baltimore, MD | 3.0 | 1.5 | 1000 | $1,350 | $1.35 | 24d | 1 | 0.55mi |
| 2401 Brookfield Ave Baltimore, MD | 2.0–3.0 | 1.0–2.0 | 1102 | $1,675 | $1.52 | 24d | 3 | 0.61mi |
| 2407 Brookfield Ave Unit 4 Baltimore, MD | 2.0 | 2.0 | 1300 | $1,550 | $1.19 | 43d | 1 | 0.61mi |
| 1614 N Calhoun St Baltimore, MD | 2.0 | 1.0 | 950 | $1,300 | $1.37 | 43d | 1 | 0.62mi |
| 1616 N Fulton Ave Baltimore, MD | 3.0 | 2.0 | 1620 | $1,795 | $1.11 | 4d | 1 | 0.62mi |
| 2143 Druid Hill Ave Unit 2 Baltimore, MD | 2.0 | 1.0 | 915 | $1,400 | $1.53 | 43d | 1 | 0.64mi |
| 2202 Brookfield Ave Baltimore, MD | 2.0 | 1.0 | 980 | $1,600 | $1.63 | 43d | 1 | 0.65mi |
| 2402 Lakeview Ave Apt 2 Baltimore, MD | 2.0 | 1.0 | 900 | $1,250 | $1.39 | 12d | 1 | 0.66mi |
| 2910 Reisterstown Rd Baltimore, MD | 1.0–3.0 | 1.0 | 950 | $1,414 | $1.49 | 15d | 4 | 0.66mi |
| 1534 N Stricker St Baltimore, MD | 2.0 | 1.5 | 900 | $1,475 | $1.64 | 15d | 1 | 0.68mi |
| 823 Newington Ave Unit 1 Baltimore, MD | 2.0 | 1.0 | 913 | $1,700 | $1.86 | 18d | 1 | 0.68mi |
| 1516 N Mount St Baltimore, MD | 3.0 | 1.5 | 1830 | $1,750 | $0.96 | 15d | 1 | 0.69mi |
| 1816 N Bentalou St Baltimore, MD | 3.0 | 2.0 | 1350 | $1,700 | $1.26 | 24d | 1 | 0.69mi |
Listing history 23 events
-
2026-05-20status Pending
-
2026-04-27historical Active Under Contract
-
2026-04-17status Active
-
2026-03-29status Pending
-
2026-02-22historical Active Under Contract
-
2025-12-29price $159,000
-
2025-12-27status Active
-
2025-12-25historical
-
2025-06-27$169,000 Active
-
2023-11-13historical $1,550
-
2023-10-12price $1,550
-
2023-09-23$1,650
-
2023-08-11status Pending
-
2023-08-11historical
-
2023-07-28historical Active Under Contract
-
2023-07-20$159,000 Active
-
2003-08-28soldstatus $65,000
-
2003-08-07soldstatus $65,000
-
2003-07-14$65,000
-
2003-07-14historical
-
1999-10-18soldstatus $38,350
-
1996-11-01historical
-
1996-08-22
ⓘ Source: listings_history table (triggers on properties + properties_extension) + one-shot
backfill from property_details.listing_events for pre-trigger history.
Tax reassessment forecast MD · Partial reset (capped growth)
- Current annual tax
- $1,942 · $162/mo
- Projected year-2 tax
- $1,942 · $162/mo
- Expected delta
- $0/yr ($0/mo · 0.0%)
ⓘ Screening estimate from a state-policy table — verify with the county assessor before closing.
Climate risk First Street
- Flood 1/10 Low FEMA zone X (unshaded) · 0% chance over 30 yrs
- Wildfire 1/10 Low
- Heat 7/10 Severe 7 d/yr ≥103°F today · 15 d/yr by 30 yrs out
- Wind 6/10 Major 27% chance of damaging wind over 30 yrs
- Air quality 4/10 Moderate 6 unhealthy d/yr today · 7 by 30 yrs out
Nearby sold comps map
Loading sold comps map…
Walkable amenities ~0.75 mi
Loading nearby amenities…
Taxation est. · year 1
- Rental income
- $20,150
- − Mortgage interest
- −$8,906
- − Property taxes
- −$1,942
- − Insurance
- −$795
- − Repairs & maintenance
- −$1,612
- − Management
- −$1,612
- − Depreciation
- −$4,625
- Taxable income
- $656
- Est. tax owed @ 24.0%
- −$158
- After-tax cash flow
- $3,017/yr
For passive investors: Depreciation is non-cash, so a rental often shows a tax loss while cash-flowing — sheltering income. Rental losses are passive: they offset passive income freely, and up to $25,000/yr can offset ordinary (W-2) income if you actively participate and your MAGI is under $100k (phasing out to $0 by $150k); unused losses carry forward. On sale, claimed depreciation is recaptured at up to 25%, and gains may owe capital-gains tax (a 1031 exchange can defer both). Figures are a year-1 estimate at your 24.0% rate — not tax advice; consult a CPA.
Schools (NCES district)
- District
- Baltimore City Public Schools
- NCES district ID
- 2400090
- Math proficiency
- 7% ▼ -9.00%
- Reading proficiency
- 16% ▼ -5.00%
- Median HH income
- $42,108
- Composite
- 10.08/100
- National rank
- #9805
- State rank
- #24 of 24 in MD
Livability — Baltimore
- Score
- 76/100
- State rank
- #90
- US rank
- #3396
Category grades
Schools grade is shown separately in the Schools card above.
Census & demographics
- Census place
- Baltimore, MD
- County
- Baltimore City · 558,601 people
- City population
- 588,727
- Metro
- Baltimore-Columbia-Towson, MD
- Population (ZIP)
- 30,792
- Household income
- $38,409
- Rent vs Own
- Severe rent burden
- 2921.0
Population outlook (Baltimore County) Hauer SSP2
- Today (2025)
- 624,249 people
- By 2030
- 621,541 · -0.4%
- By 2040
- 609,756 · -2.3%
- By 2050
- 597,249 · -4.3%
- By 2075
- 552,236 · -11.5%
- By 2100
- 513,934 · -17.7%
Race, ethnicity, and origin ACS 2023
- Neighborhood character
- Predominantly Black (81%)
- Race & ethnicity
- Black 81% White 12% Two or more races 4% Hispanic / Latino 2% Asian 2%
- Common ancestry
- Romanian 1% Hispanic 1% Italian 1%
- Foreign-born
- 5% · Canada, China, South Korea
- Languages at home
- 94% English-only · Spanish 2% French/Haitian/Cajun 1% Chinese 1%
Political lean MEDSL · Baltimore
- 2024 margin
- Solid D (+73.0) · D 85.2% · R 12.2% · Other 2.6%
- 2008→2024 swing
- -2.5pp toward R · 2008: 75.5pp · 2024: 73.0pp
- All cycles
- 2024: D+73.0 2020: D+76.6 2016: D+74.6 2012: D+76.4 2008: D+75.5
Not yet ingested
- Civics
- —
Market trends
- HPI YoY
- ▼ -187.20%
- Current HPI
- 104.2102
- Rent YoY
- ▲ 6.63%
- Metro
- Baltimore-Columbia-Towson, MD
- State GDP YoY
- ▲ 2.97%
- F500 in state
- 12
Industry mix (Fortune 500 HQ in MD)
| Industry | F500 HQs | Revenue |
|---|---|---|
| Aerospace / Defense | 1 | $71B |
|
||
| Utilities | 1 | $25B |
|
||
| Hotels | 1 | $24B |
|
||
| Consumer Goods | 1 | $7B |
|
||
| Real Estate | 1 | $6B |
|
||
| Chemicals | 1 | $2B |
|
||
Price history
+314.6% since first listed23 events — show timeline
- 2026-05-20 Pending — BRIGHT MLS
- 2026-04-27 Contingent — BRIGHT MLS
- 2026-04-17 Relisted — BRIGHT MLS
- 2026-03-29 Pending — BRIGHT MLS
- 2026-02-22 Contingent — BRIGHT MLS
- 2025-12-29 Price Changed $159,000 BRIGHT MLS
- 2025-12-27 Relisted — BRIGHT MLS
- 2025-12-25 Listing Removed — BRIGHT MLS
- 2025-06-27 Listed $169,000 BRIGHT MLS
- 2023-11-13 Rental Removed $1,550 BRIGHTMLS
- 2023-10-12 Price Changed $1,550 BRIGHTMLS
- 2023-09-23 Listed for Rent $1,650 BRIGHTMLS
- 2023-08-11 Pending — BRIGHT MLS
- 2023-08-11 Listing Removed — BRIGHT MLS
- 2023-07-28 Contingent — BRIGHT MLS
- 2023-07-20 Listed $159,000 BRIGHT MLS
- 2003-08-28 Sold (Public Records) $65,000 Public Records
- 2003-08-07 Sold (MLS) $65,000 MRIS
- 2003-07-14 Delisted — MRIS
- 2003-07-14 Listed $65,000 MRIS
- 1999-10-18 Sold (Public Records) $38,350 Public Records
- 1996-11-01 Delisted — MRIS
- 1996-08-22 Listed — MRIS
Property tax history
-0.0%/yrLatest (2025): $1,942 · +0.0% YoY. Source: county tax records.
Cash-flow waterfall
monthlySold comps — $/sqft
last 12 mo · ≤1 miLoading sold comps…