4030 Christinas Brk · San Antonio, TX
Flood risk 3/10 · Minor
- FEMA flood zone
- X (unshaded)
- Chance of flooding over 30 yrs
- 0.2%
- Est. flood insurance / yr
- $507 – $1,088
Fire risk 5/10 · Moderate
- Est. fire insurance / yr
- $1,222 – $2,270
Heat risk 8/10 · Major
- Hot days now (above 109°F)
- 7 days/yr
- Hot days in 30 yrs
- 22 days/yr
Wind risk 6/10 · Moderate
- Chance of severe wind over 30 yrs
- 77.0%
Air-quality risk 2/10 · Minimal
- Unhealthy air days now
- 1 days/yr
- Unhealthy air days in 30 yrs
- 1 days/yr
Risk factors via First Street. Map © Google.
Why this score? — see what drove the C- grade
The composite is a weighted blend of 9 inputs, each scored 0–100. Each bar is that input's sub-score; the figure is the points it added to the 100-point composite (weight × sub-score).
- Cash flow +16.6/30.0
- ARV discount +8.1/15.0
- DSCR +5.2/10.0
- 1% rule +5.1/10.0
- Condition / age +5.0/5.0
- Schools +4.4/10.0
- Livability +4.0/5.0
- Rent growth +1.7/5.0
- Appreciation +0.0/10.0
$172,999
🖨 Deal sheet (PDF) 📄 Offer letter ✓ Due diligence
Listing remarks
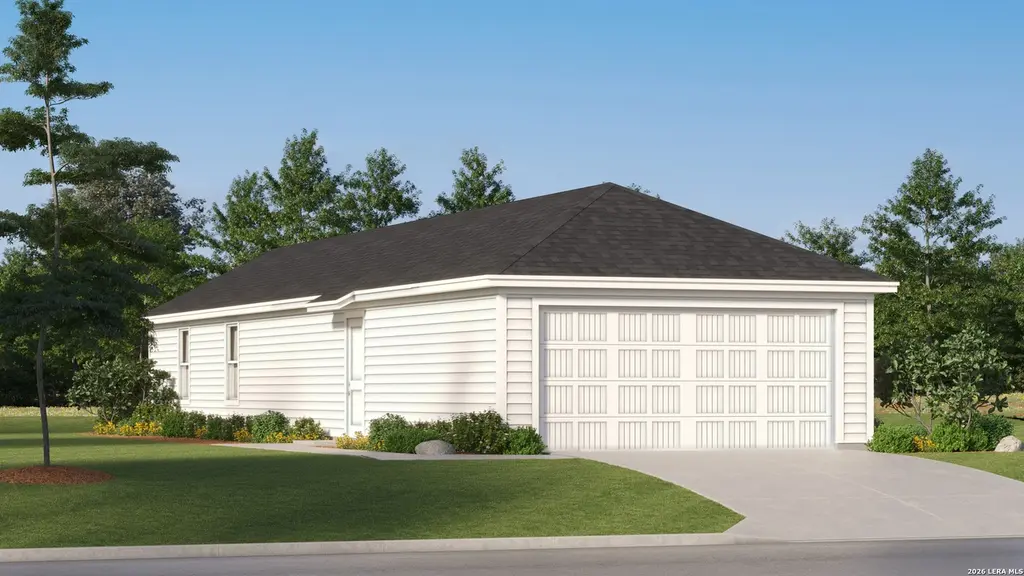
The Hazel - This new single-level home boasts a modern, low-maintenance layout. An inviting open-concept layout can be found off the entry, combining the kitchen, living and dining areas to simplify everyday multitasking. Three bedrooms are tucked away at the back of the home, including the luxurious owner's suite with a generous walk-in closet and en-suite bathroom. Estimated Completion August 2026. The completion date, prices and features may vary and are subject to change. Please verify with Lennar directly. Photos are for illustrative purposes only.
Key facts
- Walk-in closet
- En-suite bathroom
- Open-concept layout
Tags
Property features AI
Finance
- HOA & community: Mandatory HOA; HOA fee $225 quarterly; Association transfer fee $450
Exterior
- Parking: 2-car garage
- Utilities: Water system (SAWS); Sewer system (SAWS); Electricity supplied by CPS; Gas supplied by Unigas; Garbage service by Frontier
- Home design: New construction by Lennar
- Construction: Slab foundation; Composition roof
- Exterior features: Siding and cement fiber exterior; Access to community pool, clubhouse, park/playground, and jogging trails
Interior
- Kitchen: Kitchen 11 x 11; Stove/Range; Dishwasher
- Bedrooms: Master bedroom on lower level with walk-in closet and full bath; Bedroom 2: 9 x 10; Bedroom 3: 9 x 10; Master bedroom dimensions: 9 x 13
- Flooring: Carpeting; Vinyl flooring
- Bathrooms: 2 full bathrooms; Master bath with shower only and single vanity
- Heating & cooling: Central heating; Electric heat; Natural gas heat; Central air conditioning
- Interior features: Open floor plan; One living area; Utility room inside; Walk-in closets; All bedrooms downstairs; Laundry room (lower level)
- Laundry & utility: Washer connection; Dryer connection; Laundry room
Neighborhood map
What this means for you Summary
Snapshot
- This is a 3-bed/2.0-bath single-family listed at $173k. Condition is rated excellent.
Deal economics
- At list price, monthly cash flow is $106 ($1k/yr) — positive.
- The deal already cash-flows at list — no discount required.
- Meets the 1% rule at list price ($2k rent vs $173k).
- Recommended offer: $170k (1.5% below list) — sets the bar for market timing.
- Cap rate 7.0% vs local median 3.8% in San Antonio — top-decile yield for the area; either an underpriced asset or a hidden risk that comps aren't pricing in. Stress-test before assuming the spread holds.
Location & tenants
- Location reads 80/100 on livability (#31 in TX, #1,616 nationally) — a professional / high-income tenant draw. Strengths: amenities A+, commute A+, cost of living A+; Watch: crime F.
- Medina Valley ISD (rural): math 48% / reading 53% proficiency, ranked #148 of 826 in TX (top 18%) — acceptable for families but not a draw, mixed tenant base, ~2y average lease.
- Zoned schools: Ladera El (756 students, 51% FRL); Medina Valley Middle (math 47% / reading 49%, grade C-, #400 of 1,662 statewide, top 24%, 1,029 students, 62% FRL); Medina Valley H S (math 34% / reading 55%, grade F, #652 of 1,632 statewide, top 43%, 2,147 students, 51% FRL) — zoned schools at 54% FRL track the district average.
- Market conditions: Rents falling (-3.0%/yr); 1172 active listings in the ZIP; 11 comparable units currently listed for rent nearby; rentals at typical pace (median 17d on market — plan ~3-4 weeks tenant-placement turnaround); solid renter incomes; 8,308 units permitted in Bexar County in 2024 (2,506 in 5+ unit buildings).
Forward outlook
- Local home prices are declining (-3.0%/yr); year-one equity from $1k of loan paydown is wiped out by about $5k of value loss. Plan a longer hold.
- Bexar County population projected at +50% by 2050 — long-run rental-demand tailwind backs the buy-and-hold thesis.
Negotiation context
- It's been on market 22 days — a 2% lower offer ($170k) is reasonable based on typical stale-listing flexibility.
Risks & watch-outs
- Climate carrying-cost: major wind risk, 77% chance of damaging wind over 30y; moderate wildfire risk; extreme-heat days projected 7→22/yr by 2055 (HVAC capex compounding) — expect insurance premiums to compound above CPI over the hold.
Questions for the listing agent
- What does the HOA fee cover, when was the last increase, and are there any pending special assessments or reserve-fund shortfalls?
- Is there a deadline driving the sale (1031 exchange, divorce, estate, relocation)? That informs how much negotiation room exists.
- Crime grade is F in this area — have there been break-ins, vandalism, or insurance claims at this property in the last 3 years? What carrier currently insures it and at what premium?
- What's the average days-on-market for RENTAL listings here right now (not sales)? A rising rental-DOM trend means longer vacancies and softer asking-rent achievability than the comps imply.
- What's the recent tenant-quality profile in this submarket — average credit score on applications, eviction rate, late-payment / NSF rate, and stable-employment percentage? A property-management company in the area should have these aggregated.
- How much new for-sale + rental construction is in the pipeline within 1–3 miles? Heavy new supply typically softens prices + rents 12–24 months out; constrained supply supports both.
Investment metrics
- 1% rule
- 1.01% ✓
- Cap rate
- 7.03%
- Cash-on-cash
- 2.63%
- DSCR
- 1.12
- GRM
- 8.3
CMA / ARV
- ARV (median comp)
- $175,499
- List price
- $172,999
- Delta
- -1.42%
- Verdict
- FAIR
- Comps
- 20 within 1.0 mi
Show comp detail 12 sales within ~0.75 mi
| Address | Dist | Beds/Ba | Sqft | Sold | Price | $/sf | Match |
|---|---|---|---|---|---|---|---|
| 12144 La Cuchilla | 0.00mi | 2/2.5 (-1) | 1,013 (-3%) | 4mo | $152,999 | $151 | 84 |
| 12120 La Cuchilla | 0.00mi | 2/2.5 (-1) | 1,013 (-3%) | 7mo | $157,999 | $156 | 81 |
| 14725 Briscoe Downs | 0.00mi | 3/2.0 | 1,156 (+10%) | 6mo | $242,950 | $210 | 78 |
| 12121 La Cuchilla | 0.00mi | 3/2.5 | 1,189 (+13%) | 1mo | $166,999 | $140 | 75 |
| 12129 La Cuchilla | 0.00mi | 3/2.5 | 1,189 (+13%) | 2mo | $169,999 | $143 | 74 |
| 12149 La Cuchilla | 0.00mi | 3/2.5 | 1,189 (+13%) | 3mo | $187,999 | $158 | 74 |
| 12165 La Cuchilla | 0.00mi | 3/2.5 | 1,189 (+13%) | 3mo | $172,999 | $145 | 73 |
| 12046 La Cuchilla | 0.00mi | 3/2.5 | 1,189 (+13%) | 3mo | $166,999 | $140 | 73 |
| 12026 La Cuchilla | 0.00mi | 3/2.5 | 1,189 (+13%) | 5mo | $187,999 | $158 | 72 |
| 12014 La Cuchilla | 0.00mi | 3/2.5 | 1,189 (+13%) | 6mo | $170,999 | $144 | 71 |
| 12062 La Cuchilla | 0.00mi | 3/2.5 | 1,189 (+13%) | 6mo | $167,999 | $141 | 71 |
| 11726 Wentwood Vale | 0.59mi | 3/2.0 | 1,156 (+10%) | 5mo | $265,950 | $230 | 51 |
Match score weights: distance 35% · size 25% · config 20% · recency 20%. Top-matched comps best support the ARV.
Projected returns pro-forma
-3.0% appreciation · 0.0% rent growth · sell at horizon
- IRR
- -15.7%
- Equity multiple
- 0.46×
- Total profit
- $-26,312
- Equity at exit
- $25,795
- IRR
- -14.1%
- Equity multiple
- 0.31×
- Total profit
- $-33,655
- Equity at exit
- $14,958
Cash invested: $48,440 (down + closing). Projections, not guarantees.
Landlord ↔ Tenant lean methodology
- Overall (STATE)
- 87 Strongly Landlord-Friendly
- State Texas
- 87 Strongly Landlord-Friendly · R+5
- County
- — inherits STATE
- City
- — inherits STATE
ZIP-level market 78245
- Home prices YoY
- -18.5%
- Rents YoY
- -3.0%
- Active inventory
- 1172
- Price-to-rent
- 8.3×
Monthly cashflow live
- Estimated rent
- $1,743 high interval (Pro) →
- Mortgage (P&I)
- −$907
- Tax est. 1.5%
- −$216 /mo · $2,595/yr
- Insurance
- −$72
- HOA
- −$75
- Vacancy / Maint / Mgmt
- −$366
- Net cashflow
- $106
Break-even live
Sensitivity live
| Price | -10% $226 | -5% $166 | +0% $106 | +5% $46 | +10% $-13 |
|---|---|---|---|---|---|
| Rent | -10% $-32 | -5% $37 | +0% $106 | +5% $175 | +10% $244 |
| Rate | -1.0pp $193 | -0.5pp $150 | base $106 | +0.5pp $61 | +1.0pp $16 |
UW: 25.0% down · 7.5% · 30yr · 1.5% tax · 5.0% vac · 8.0% maint · 8.0% mgmt
Financing live
Cash to close
- Down payment
- $43,250
- Closing costs
- $5,190
- Reserves months
- —
- Total cash needed
- —
Loan-product check · same deal, 3 products live
Conventional
25% down · 7.5% · 30yr
- Down + closing
- —
- Monthly P&I
- —
- Monthly cashflow
- —
- DSCR
- —
- Eligible?
- —
Personal DTI + credit; lowest rate.
DSCR
20% down · 8.5% · 30yr
- Down + closing
- —
- Monthly P&I
- —
- Monthly cashflow
- —
- DSCR
- —
- Eligible?
- —
No personal income docs; deal must DSCR.
Hard money
10% down · 12.0% · 12mo
- Down + closing
- —
- Monthly P&I
- —
- Monthly cashflow
- —
- DSCR
- —
- Eligible?
- —
Short-term bridge; refi at stabilization.
Rent comps 11 comps
| Address | Beds | Baths | Sqft | Rent | $/sqft | DOM | Units | Dist |
|---|---|---|---|---|---|---|---|---|
| 14618 Fowler Rdg San Antonio, TX | 3.0 | 2.0 | 1266 | $1,776 | $1.40 | 16d | 1 | 0.03mi |
| 3203 Onion Crk San Antonio, TX | 3.0 | 2.0 | 1413 | $1,750 | $1.24 | 0d | 1 | 0.60mi |
| 3232 Onion Crk San Antonio, TX | 3.0 | 2.0 | 1168 | $1,495 | $1.28 | 45d | 1 | 0.66mi |
| 3303 Mission Riv San Antonio, TX | 3.0 | 2.0 | 1489 | $1,850 | $1.24 | 45d | 1 | 0.70mi |
| 12126 Sampson Crk San Antonio, TX | 3.0 | 2.0 | 1489 | $1,895 | $1.27 | 25d | 1 | 0.72mi |
| 11902 Mulberry Crk San Antonio, TX | 3.0 | 2.0 | 1413 | $1,647 | $1.17 | 45d | 1 | 0.75mi |
| 12141 Pease Riv San Antonio, TX | 3.0 | 2.0 | 1396 | $1,595 | $1.14 | 4d | 1 | 0.75mi |
| 12010 Mulberry Crk Unit NA San Antonio, TX | 3.0 | 2.0 | 1296 | $1,850 | $1.43 | 16d | 1 | 0.76mi |
| 1526 Alaskan Wolf San Antonio, TX | 3.0 | 2.0 | 1099 | $1,400 | $1.27 | 5d | 1 | 1.42mi |
| 2422 Buffalo Pass Dr San Antonio, TX | 3.0 | 2.5 | 1500 | $1,500 | $1.00 | 45d | 1 | 1.44mi |
| 11727 Black Rose San Antonio, TX | 3.0 | 2.0 | 1316 | $1,595 | $1.21 | 0d | 1 | 1.48mi |
HOA detail
- Monthly dues
- $75 · $900/yr
Listing history 5 events
-
2026-05-06price $172,999 559-char remark
-
2026-05-05price $172,999 357-char remark
-
2026-04-29price $170,999 357-char remark
-
2026-04-29$170,999 New 559-char remark
-
2026-04-22$190,999 Active 357-char remark
ⓘ Source: listings_history table (triggers on properties + properties_extension) + one-shot
backfill from property_details.listing_events for pre-trigger history.
Climate risk First Street
- Flood 3/10 Moderate FEMA zone X (unshaded) · 20% chance over 30 yrs
- Wildfire 5/10 Major
- Heat 8/10 Severe 7 d/yr ≥109°F today · 22 d/yr by 30 yrs out
- Wind 6/10 Major 77% chance of damaging wind over 30 yrs
- Air quality 2/10 Low 1 unhealthy d/yr today · 1 by 30 yrs out
Nearby sold comps map
Loading sold comps map…
Walkable amenities ~0.75 mi
Loading nearby amenities…
Taxation est. · year 1
- Rental income
- $20,911
- − Mortgage interest
- −$9,691
- − Property taxes
- −$2,595
- − Insurance
- −$865
- − Repairs & maintenance
- −$1,673
- − Management
- −$1,673
- − HOA
- −$900
- − Depreciation
- −$5,033
- Taxable loss
- −$1,518
- Est. tax savings @ 24.0%
- +$364
- After-tax cash flow
- $1,637/yr
For passive investors: Depreciation is non-cash, so a rental often shows a tax loss while cash-flowing — sheltering income. Rental losses are passive: they offset passive income freely, and up to $25,000/yr can offset ordinary (W-2) income if you actively participate and your MAGI is under $100k (phasing out to $0 by $150k); unused losses carry forward. On sale, claimed depreciation is recaptured at up to 25%, and gains may owe capital-gains tax (a 1031 exchange can defer both). Figures are a year-1 estimate at your 24.0% rate — not tax advice; consult a CPA.
Condition & rehab AI · 12 photos
This modern, single-level home is move-in ready with a clean and well-maintained interior and exterior. Upgrades to the exterior and interior can further enhance its curb appeal and value.
Value-add opportunities
- Resale Painting the exterior siding to a darker color — Enhances curb appeal and modernizes the home.
- Resale Updating the kitchen backsplash — Modernizes the kitchen and adds value.
- Resale Upgrading the flooring in the bathrooms — Improves the overall aesthetic and adds value.
- Both Adding smart home features — Enhances convenience and adds value for both resale and rental.
Renovation cost estimate screening
Value-add ROI direction
- Resale Painting the exterior siding to a darker color — Enhances curb appeal and modernizes the home. ↑
- Resale Updating the kitchen backsplash — Modernizes the kitchen and adds value. ↑
- Resale Upgrading the flooring in the bathrooms — Improves the overall aesthetic and adds value. ↑
- Both Adding smart home features — Enhances convenience and adds value for both resale and rental. ↑
ⓘ Cost ranges are severity-bucket heuristics (US national rule-of-thumb). Get contractor quotes + a written scope before underwriting a rehab budget.
Schools (NCES district)
- District
- Medina Valley ISD
- NCES district ID
- 4830060
- Math proficiency
- 48% ▼ -9.00%
- Reading proficiency
- 53% ▼ -2.00%
- Median HH income
- $60,596
- Composite
- 44.2/100
- National rank
- #2851
- State rank
- #148 of 826 in TX
Livability — San Antonio
- Score
- 80/100
- State rank
- #31
- US rank
- #1616
Category grades
Schools grade is shown separately in the Schools card above.
Census & demographics
- County
- Bexar County · 1,990,555 people
- City population
- 1,806,925
- Metro
- San Antonio-New Braunfels, TX
- Population (ZIP)
- 96,015
- Household income
- $90,029
- Rent vs Own
- Severe rent burden
- 2466.0
Population outlook (Bexar County) Hauer SSP2
- Today (2025)
- 2,336,851 people
- By 2030
- 2,560,728 · +9.6%
- By 2040
- 3,020,569 · +29.3%
- By 2050
- 3,493,522 · +49.5%
- By 2075
- 4,668,459 · +99.8%
- By 2100
- 5,533,242 · +136.8%
Race, ethnicity, and origin ACS 2023
- Neighborhood character
- Majority Hispanic (64%)
- Race & ethnicity
- Hispanic / Latino 64% Two or more races 27% White 20% Black 9% Asian 2%
- Hispanic origin (detail)
- Mexican 53% Puerto Rican 2%
- Common ancestry
- Slovak 1% Lithuanian 1% Romanian 1%
- Foreign-born
- 9% · Canada, Vietnam
- Languages at home
- 66% English-only · Spanish 30% Arabic 1% Tagalog/Filipino 1%
Political lean MEDSL · Bexar
- 2024 margin
- Lean D (+9.8) · D 54.3% · R 44.6% · Other 1.1%
- 2008→2024 swing
- +4.2pp toward D · 2008: 5.6pp · 2024: 9.8pp
- All cycles
- 2024: D+9.8 2020: D+18.2 2016: D+13.5 2012: D+4.6 2008: D+5.6
Not yet ingested
- Civics
- —
Market trends
- HPI YoY
- ▼ -53.31%
- Current HPI
- 234.7931
- Rent YoY
- ▼ -3.02%
- Metro
- San Antonio-New Braunfels, TX
- State GDP YoY
- ▲ 3.95%
- F500 in state
- 110
Industry mix (Fortune 500 HQ in TX)
| Industry | F500 HQs | Revenue |
|---|---|---|
| Energy | 16 | $1,198B |
|
||
| Technology | 5 | $198B |
|
||
| Engineering / Construction | 4 | $72B |
|
||
| Energy Services | 3 | $60B |
|
||
| Utilities | 3 | $41B |
|
||
| Healthcare | 2 | $330B |
|
||
Price history
+1.2% since first listed3 events — show timeline
- 2026-05-21 Pending — LERA
- 2026-05-06 Price Changed $172,999 LERA
- 2026-04-29 Listed $170,999 LERA
Cash-flow waterfall
monthlySold comps — $/sqft
last 12 mo · ≤1 miLoading sold comps…