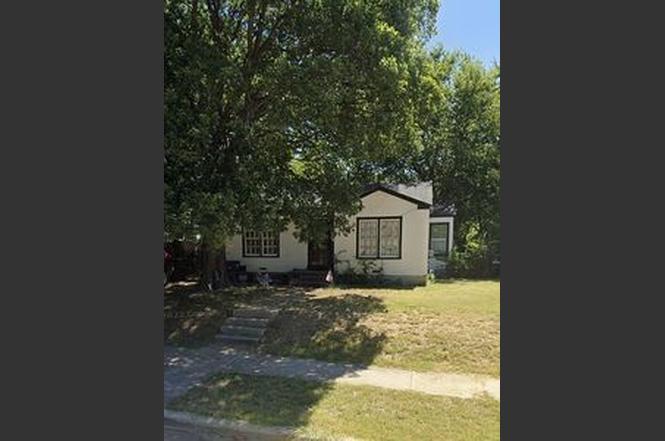
3256 Ray Simon Dr · Fort Worth, TX
Flood risk 1/10 · Minimal
- FEMA flood zone
- X (unshaded)
- Chance of flooding over 30 yrs
- 0.0%
- Est. flood insurance / yr
- $507 – $1,088
Fire risk 1/10 · Minimal
- Est. fire insurance / yr
- $1,222 – $2,270
Heat risk 7/10 · Major
- Hot days now (above 109°F)
- 7 days/yr
- Hot days in 30 yrs
- 23 days/yr
Wind risk 4/10 · Minor
- Chance of severe wind over 30 yrs
- 24.0%
Air-quality risk 4/10 · Minor
- Unhealthy air days now
- 4 days/yr
- Unhealthy air days in 30 yrs
- 5 days/yr
Risk factors via First Street. Map © Google.
Why this score? — see what drove the D grade
The composite is a weighted blend of 9 inputs, each scored 0–100. Each bar is that input's sub-score; the figure is the points it added to the 100-point composite (weight × sub-score).
- Cash flow +15.2/30.0
- ARV discount +8.6/15.0
- DSCR +4.7/10.0
- 1% rule +4.5/10.0
- Livability +4.0/5.0
- Condition / age +2.5/5.0
- Rent growth +2.2/5.0
- Schools +2.0/10.0
- Appreciation +0.0/10.0
$170,000
🖨 Deal sheet (PDF) 📄 Offer letter ✓ Due diligence
Listing remarks
?? LESS THAN 3 MILES FROM THE STOCKYARDS! ?? Welcome to this charming 1949 pier & amp; beam starter home located in the high-demand 76106 ZIP code of Fort Worth. Priced competitively at just $170,000, this property offers an incredibly rare, affordable opportunity for homeownership or a cash-flowing investment in one of the most rapidly growing cultural hubs in Texas. WHY THIS IS AN ABSOLUTE STEAL: Buying an older home usually means worrying about hidden, expensive structural issues. Not here! The current owners have already invested heavily in the most expensive & quot; invisible& quot; costs so you don& apos; t have to. Check out these massive capital upgrades completed w
Key facts
- Modern flooring
- Brand new roof
- New water heater
Tags
Neighborhood map
What this means for you Summary
Snapshot
- This is a 3-bed/1.0-bath single-family listed at $170k.
Deal economics
- At list price, monthly cash flow is $59 ($712/yr) — positive.
- The deal already cash-flows at list — no discount required.
- To meet the 1% rule (rent ≥ 1% of price), the offer needs to be $162k (4.5% below list).
- Recommended offer: $162k (4.5% below list) — sets the bar for 1% rule.
- Cap rate 6.7% vs local median 3.9% in Fort Worth — top-decile yield for the area; either an underpriced asset or a hidden risk that comps aren't pricing in. Stress-test before assuming the spread holds.
Location & tenants
- Location reads 80/100 on livability (#49 in TX, #1,954 nationally) — a professional / high-income tenant draw. Strengths: amenities A+, cost of living A+, housing A+; Watch: schools D+, crime F.
- Fort Worth ISD (urban): math 18% / reading 28% proficiency, ranked #742 of 826 in TX (top 90%) — low school quality limits family demand, transient renter base, plan for 1-2y turnover; 73% free/reduced lunch — lower-income household profile, screen leases tightly.
- Market conditions: Rents soft (-1.0%/yr); 67 active listings in the ZIP; 6 comparable units currently listed for rent nearby; rentals at typical pace (median 21d on market — plan ~3-4 weeks tenant-placement turnaround); 18,938 units permitted in Tarrant County in 2024 (8,336 in 5+ unit buildings).
- This rent runs 35% of the median local income ($55k/yr) — at the standard rent-burdened threshold; future hikes will face affordability resistance.
Forward outlook
- Local home prices are declining (-3.0%/yr); year-one equity from $1k of loan paydown is wiped out by about $5k of value loss. Plan a longer hold.
- Tarrant County population projected at +41% by 2050 — long-run rental-demand tailwind backs the buy-and-hold thesis.
Negotiation context
- Only 5 days on market — expect competitive offers; lowballing is unlikely to land.
Risks & watch-outs
- Climate carrying-cost: extreme-heat days projected 7→23/yr by 2055 (HVAC capex compounding) — expect insurance premiums to compound above CPI over the hold.
Questions for the listing agent
- Built in 1975 — when were the roof, HVAC, electrical panel, plumbing, and water heater last replaced?
- Is there a deadline driving the sale (1031 exchange, divorce, estate, relocation)? That informs how much negotiation room exists.
- Schools are D-rated, which usually means shorter tenancies and higher turnover. Who's the typical renter profile here, and what's been the actual vacancy rate?
- Crime grade is F in this area — have there been break-ins, vandalism, or insurance claims at this property in the last 3 years? What carrier currently insures it and at what premium?
- The area grade is low — what's the realistic commute time and amenity access for the typical tenant pool here? Any planned neighborhood developments (good or bad) we should know about?
- What's the average days-on-market for RENTAL listings here right now (not sales)? A rising rental-DOM trend means longer vacancies and softer asking-rent achievability than the comps imply.
- What's the recent tenant-quality profile in this submarket — average credit score on applications, eviction rate, late-payment / NSF rate, and stable-employment percentage? A property-management company in the area should have these aggregated.
- How much new for-sale + rental construction is in the pipeline within 1–3 miles? Heavy new supply typically softens prices + rents 12–24 months out; constrained supply supports both.
Investment metrics
- 1% rule
- 0.95% ✗
- Cap rate
- 6.71%
- Cash-on-cash
- 1.50%
- DSCR
- 1.07
- GRM
- 8.7
CMA / ARV
- ARV (on-the-fly)
- $174,087
- Comps found
- 6
Show comp detail 6 sales within ~0.75 mi
| Address | Dist | Beds/Ba | Sqft | Sold | Price | $/sf | Match |
|---|---|---|---|---|---|---|---|
| 2537 Quentin Ct | 0.03mi | 2/1.0 (-1) | 841 (0%) | 20mo | $175,000 | $208 | 77 |
| 3265 Grover Ave | 0.23mi | 3/1.0 | 928 (+10%) | 18mo | $215,000 | $232 | 57 |
| 2509 Vera Cruz St | 0.14mi | 2/1.0 (-1) | 941 (+12%) | 20mo | $138,000 | $147 | 52 |
| 3002 Runnels St | 0.42mi | 2/1.0 (-1) | 768 (-9%) | 13mo | $139,900 | $182 | 50 |
| 2805 Hale Ave | 0.60mi | 3/1.0 | 960 (+14%) | 2mo | $199,000 | $207 | 46 |
| 3209 Hutchinson St | 0.41mi | 2/1.0 (-1) | 780 (-7%) | 23mo | $149,900 | $192 | 45 |
Match score weights: distance 35% · size 25% · config 20% · recency 20%. Top-matched comps best support the ARV.
Projected returns pro-forma
-3.0% appreciation · 0.0% rent growth · sell at horizon
- IRR
- -17.5%
- Equity multiple
- 0.40×
- Total profit
- $-28,471
- Equity at exit
- $25,348
- IRR
- -16.8%
- Equity multiple
- 0.20×
- Total profit
- $-38,089
- Equity at exit
- $14,698
Cash invested: $47,600 (down + closing). Projections, not guarantees.
Landlord ↔ Tenant lean methodology
- Overall (STATE)
- 87 Strongly Landlord-Friendly
- State Texas
- 87 Strongly Landlord-Friendly · R+5
- County
- — inherits STATE
- City
- — inherits STATE
ZIP-level market 76106
- Home prices YoY
- -6.9%
- Rents YoY
- -1.0%
- Active inventory
- 67
- Price-to-rent
- 8.7×
Monthly cashflow live
- Estimated rent
- $1,623 high interval (Pro) →
- Mortgage (P&I)
- −$891
- Tax from tax record
- −$261 /mo · $3,126/yr
- Insurance
- −$71
- HOA
- −$0
- Vacancy / Maint / Mgmt
- −$341
- Net cashflow
- $59
Break-even live
Sensitivity live
| Price | -10% $156 | -5% $107 | +0% $59 | +5% $11 | +10% $-37 |
|---|---|---|---|---|---|
| Rent | -10% $-69 | -5% $-5 | +0% $59 | +5% $123 | +10% $188 |
| Rate | -1.0pp $145 | -0.5pp $103 | base $59 | +0.5pp $15 | +1.0pp $-30 |
UW: 25.0% down · 7.5% · 30yr · 1.5% tax · 5.0% vac · 8.0% maint · 8.0% mgmt
Financing live
Cash to close
- Down payment
- $42,500
- Closing costs
- $5,100
- Reserves months
- —
- Total cash needed
- —
Loan-product check · same deal, 3 products live
Conventional
25% down · 7.5% · 30yr
- Down + closing
- —
- Monthly P&I
- —
- Monthly cashflow
- —
- DSCR
- —
- Eligible?
- —
Personal DTI + credit; lowest rate.
DSCR
20% down · 8.5% · 30yr
- Down + closing
- —
- Monthly P&I
- —
- Monthly cashflow
- —
- DSCR
- —
- Eligible?
- —
No personal income docs; deal must DSCR.
Hard money
10% down · 12.0% · 12mo
- Down + closing
- —
- Monthly P&I
- —
- Monthly cashflow
- —
- DSCR
- —
- Eligible?
- —
Short-term bridge; refi at stabilization.
Rent comps 6 comps
| Address | Beds | Baths | Sqft | Rent | $/sqft | DOM | Units | Dist |
|---|---|---|---|---|---|---|---|---|
| 2204 Salisbury Ave Fort Worth, TX | 2.0 | 1.0 | 910 | $1,400 | $1.54 | 26d | 1 | 0.67mi |
| 2903 Weber St Fort Worth, TX | 4.0 | 1.0 | 1064 | $1,695 | $1.59 | 45d | 1 | 0.80mi |
| 2104 W Lotus Ave Fort Worth, TX | 2.0 | 1.0 | 1039 | $1,600 | $1.54 | 8d | 1 | 1.01mi |
| 4301 Weber St Fort Worth, TX | 2.0–3.0 | 1.0–2.0 | 1050 | $1,375 | $1.31 | 0d | 11 | 1.41mi |
| 1852 E Northside Dr Fort Worth, TX | 2.0 | 2.0 | 1083 | $2,055 | $1.90 | 20d | 1 | 1.45mi |
| 601 Stockyards Blvd Fort Worth, TX | 2.0 | 1.0–2.0 | 815 | $2,814 | $3.45 | 0d | 61 | 1.49mi |
Listing history 4 events
-
2026-06-21days on market $170,000 Active 5 DOM
-
2026-06-18days on market $170,000 Active 2 DOM
-
2026-06-17remarks 683-char remark
-
2026-06-17$170,000 Active 1 DOM
ⓘ Source: listings_history table (triggers on properties + properties_extension) + one-shot
backfill from property_details.listing_events for pre-trigger history.
Tax reassessment forecast TX · Resets to sale price
- Current annual tax
- $3,126 · $261/mo
- Projected year-2 tax
- $3,126 · $261/mo
- Expected delta
- $0/yr ($0/mo · 0.0%)
ⓘ Screening estimate from a state-policy table — verify with the county assessor before closing.
Climate risk First Street
- Flood 1/10 Low FEMA zone X (unshaded) · 0% chance over 30 yrs
- Wildfire 1/10 Low
- Heat 7/10 Severe 7 d/yr ≥109°F today · 23 d/yr by 30 yrs out
- Wind 4/10 Moderate 24% chance of damaging wind over 30 yrs
- Air quality 4/10 Moderate 4 unhealthy d/yr today · 5 by 30 yrs out
Nearby sold comps map
Loading sold comps map…
Walkable amenities ~0.75 mi
Loading nearby amenities…
Taxation est. · year 1
- Rental income
- $19,476
- − Mortgage interest
- −$9,523
- − Property taxes
- −$3,126
- − Insurance
- −$850
- − Repairs & maintenance
- −$1,558
- − Management
- −$1,558
- − Depreciation
- −$4,945
- Taxable loss
- −$2,084
- Est. tax savings @ 24.0%
- +$500
- After-tax cash flow
- $1,212/yr
For passive investors: Depreciation is non-cash, so a rental often shows a tax loss while cash-flowing — sheltering income. Rental losses are passive: they offset passive income freely, and up to $25,000/yr can offset ordinary (W-2) income if you actively participate and your MAGI is under $100k (phasing out to $0 by $150k); unused losses carry forward. On sale, claimed depreciation is recaptured at up to 25%, and gains may owe capital-gains tax (a 1031 exchange can defer both). Figures are a year-1 estimate at your 24.0% rate — not tax advice; consult a CPA.
Schools (NCES district)
- District
- Fort Worth ISD
- NCES district ID
- 4819700
- Math proficiency
- 18% ▼ -16.00%
- Reading proficiency
- 28% ▼ -6.00%
- Median HH income
- $42,109
- Composite
- 19.61/100
- National rank
- #8753
- State rank
- #742 of 826 in TX
Livability — Fort Worth
- Score
- 80/100
- State rank
- #49
- US rank
- #1954
Category grades
Schools grade is shown separately in the Schools card above.
Census & demographics
- Census place
- Fort Worth, TX
- County
- Tarrant County · 2,033,669 people
- City population
- 911,619
- Metro
- Dallas-Fort Worth-Arlington, TX
- Population (ZIP)
- 35,946
- Household income
- $55,431
- Rent vs Own
- Severe rent burden
- 1539.0
Population outlook (Tarrant County) Hauer SSP2
- Today (2025)
- 2,380,417 people
- By 2030
- 2,578,900 · +8.3%
- By 2040
- 2,974,995 · +25.0%
- By 2050
- 3,350,489 · +40.8%
- By 2075
- 4,216,909 · +77.2%
- By 2100
- 4,741,527 · +99.2%
Race, ethnicity, and origin ACS 2023
- Neighborhood character
- Predominantly Hispanic (80%)
- Race & ethnicity
- Hispanic / Latino 80% Two or more races 30% White 9% Black 9% Asian 1%
- Hispanic origin (detail)
- Mexican 71%
- Common ancestry
- Ukrainian 1%
- Foreign-born
- 33% · Canada
- Languages at home
- 30% English-only · Spanish 66% Other Indo-European 1% Arabic 1%
Political lean MEDSL · Tarrant
- 2024 margin
- Lean R (+5.1) · D 46.7% · R 51.9% · Other 1.4%
- 2008→2024 swing
- +6.6pp toward D · 2008: -11.7pp · 2024: -5.1pp
- All cycles
- 2024: R+5.1 2020: D+0.2 2016: R+8.7 2012: R+15.7 2008: R+11.7
Not yet ingested
- Civics
- —
Market trends
- HPI YoY
- ▼ -24.42%
- Current HPI
- 329.4589
- Rent YoY
- ▼ -1.02%
- Metro
- Dallas-Fort Worth-Arlington, TX
- State GDP YoY
- ▲ 3.95%
- F500 in state
- 110
Industry mix (Fortune 500 HQ in TX)
| Industry | F500 HQs | Revenue |
|---|---|---|
| Energy | 16 | $1,198B |
|
||
| Technology | 5 | $198B |
|
||
| Engineering / Construction | 4 | $72B |
|
||
| Energy Services | 3 | $60B |
|
||
| Utilities | 3 | $41B |
|
||
| Healthcare | 2 | $330B |
|
||
Price history
4 events — show timeline
- 2026-06-17 Listed $170,000 FSBO.com
- 2023-03-20 Sold (Public Records) — Public Records
- 2019-11-08 Sold (Public Records) — Public Records
- 1998-12-22 Sold (Public Records) — Public Records
Property tax history
+7.4%/yrLatest (2025): $3,126 · -2.4% YoY. Source: county tax records.
Cash-flow waterfall
monthlySold comps — $/sqft
last 12 mo · ≤1 miLoading sold comps…