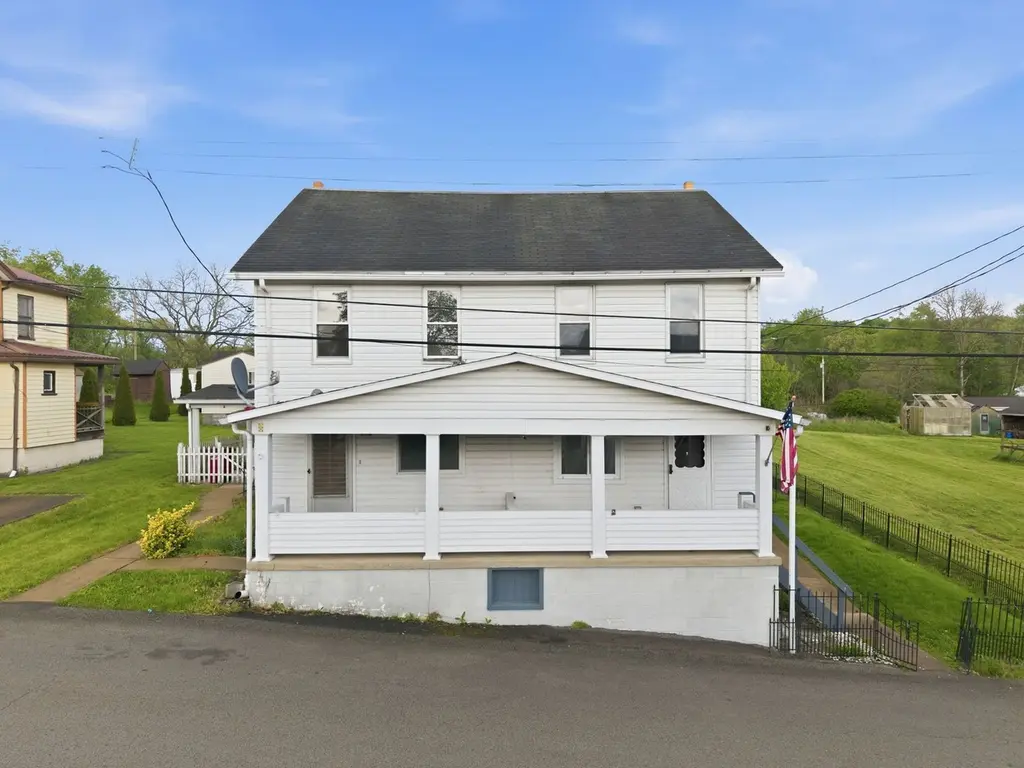
 Duplex
174/176 Roosevelt Way · North Huntingdon, PA
Flood risk 1/10 · Minimal
- FEMA flood zone
- X (unshaded)
- Chance of flooding over 30 yrs
- 0.0%
- Est. flood insurance / yr
- $507 – $1,088
Fire risk 1/10 · Minimal
- Est. fire insurance / yr
- $511 – $949
Heat risk 3/10 · Minor
- Hot days now (above 96°F)
- 7 days/yr
- Hot days in 30 yrs
- 18 days/yr
Wind risk 2/10 · Minimal
- Chance of severe wind over 30 yrs
- —
Air-quality risk 3/10 · Minor
- Unhealthy air days now
- 3 days/yr
- Unhealthy air days in 30 yrs
- 5 days/yr
Risk factors via First Street. Map © Google.
Why this score? — see what drove the B grade
The composite is a weighted blend of 9 inputs, each scored 0–100. Each bar is that input's sub-score; the figure is the points it added to the 100-point composite (weight × sub-score).
- Cash flow +30.0/30.0
- DSCR +10.0/10.0
- 1% rule +8.5/10.0
- ARV discount +7.5/15.0
- Schools +5.9/10.0
- Appreciation +5.0/10.0
- Rent growth +2.5/5.0
- Livability +2.5/5.0
- Condition / age +2.2/5.0
$169,900
🖨 Deal sheet 📄 Offer letter ✓ Due diligence
Multi-family units
County records classify this as Multi-Family (2-4 Unit). Listing-text estimate: 2 units. confirmed
Listing remarks
Spacious income-producing opportunity featuring a duplex plus a detached trailer, creating a unique 3-unit investment setup with endless potential! Each unit offers 2 bedrooms and 1 full bathroom, providing layouts tenants are always looking for. The detached trailer, added in 1995, has never been occupied, presenting a rare opportunity for future use, storage, or additional possibilities for the next owner to explore. The property also features a fenced yard, covered front porch, off-street parking behind the duplex, a detached garage with added storage space, and an additional shed for even more functionality. Separate septic systems service each unit, with the duplex septic systems recen
Key facts
- Covered front porch
- Off street parking
- Fenced yard
Tags
Property features AI
Exterior
- Parking: Off-street parking
- Home design: Multi-unit property with 3 total units
- Construction: Brick and vinyl siding exterior; Asphalt roof
- Exterior features: Lot approximately 0.224 acres (32.5 x 300); Zoned R2
Interior
- Bedrooms: Three units with 2 bedrooms each
- Bathrooms: Each unit has 1 full bathroom
- Interior features: Unfinished basement
Neighborhood map
What this means for you Summary
Snapshot
- This is a 2 × 3-bed/?-bath units multifamily listed at $170k. Condition is rated fair.
Deal economics
- At list price, monthly cash flow is $633 ($8k/yr) — positive. Per door: $316/mo.
- The deal already cash-flows at list — no discount required.
- Meets the 1% rule at list price ($2k rent vs $170k).
- Recommended offer: $165k (3.0% below list) — sets the bar for market timing.
Location & tenants
- Location reads: area grade B — affects rentability + tenant quality, not the cash-flow math above.
- Norwin SD (suburban): math 60% / reading 76% proficiency, ranked #32 of 539 in PA (top 6%) — acceptable for families but not a draw, mixed tenant base, ~2y average lease; only 18% free/reduced lunch — higher-income household profile.
- Market conditions: 1 active listings in the ZIP; 2 comparable units currently listed for rent nearby; 415 units permitted in Westmoreland County in 2024 (10 in 5+ unit buildings).
Forward outlook
- In year one you build about $6k of equity ($1k loan paydown + $5k appreciation (3.0% local appreciation)).
- Westmoreland County population projected at -19% by 2050 — secular population decline; favor cash flow + early exit over multi-decade hold.
- At projected returns (3.0% appreciation + 3.0% rent growth), your $48k cash investment doubles in ~4 years — after that, you're playing with house money.
- By year 6, paydown + projected appreciation supports a ~$33k cash-out refi (75% LTV) — recoverable capital for the next deal without selling this one.
Negotiation context
- It's been on market 35 days — a 3% lower offer ($165k) is reasonable based on typical stale-listing flexibility.
Questions for the listing agent
- It's been on market 35 days. Have you received any prior offers? Is the seller open to a 3% concession, seller financing, or rate buy-down credit?
- Can we see the unit-by-unit rent roll, current vacancy, and any below-market leases? What's the average tenancy length?
- What capital expenditures (roof, boiler, parking lot, exteriors) have been made in the last 5 years, and what's planned in the next 2?
- Have any recent inspections been done? Can we get a copy of the seller's disclosures and any deferred-maintenance estimates?
- Is there a deadline driving the sale (1031 exchange, divorce, estate, relocation)? That informs how much negotiation room exists.
- What's the average days-on-market for RENTAL listings here right now (not sales)? A rising rental-DOM trend means longer vacancies and softer asking-rent achievability than the comps imply.
- What's the recent tenant-quality profile in this submarket — average credit score on applications, eviction rate, late-payment / NSF rate, and stable-employment percentage? A property-management company in the area should have these aggregated.
- How much new apartment / multifamily construction is in the pipeline within 1–3 miles? Heavy new supply (>2% of stock underway) typically softens rents 12–24 months out; light construction supports rent growth.
Investment metrics
- 1% rule
- 1.35% ✓
- Cap rate
- 10.76%
- Cash-on-cash
- 15.96%
- DSCR
- 1.71
- GRM
- 6.2
CMA / ARV
No comps found within radius.
Projected returns pro-forma
3.0% appreciation · 3.0% rent growth · sell at horizon
- IRR
- 22.5%
- Equity multiple
- 2.28×
- Total profit
- $60,791
- Equity at exit
- $76,394
- IRR
- 23.5%
- Equity multiple
- 4.36×
- Total profit
- $160,021
- Equity at exit
- $117,733
Cash invested: $47,572 (down + closing). Projections, not guarantees.
Landlord ↔ Tenant lean methodology
- Overall (STATE)
- 62 Landlord-Friendly
- State Pennsylvania
- 62 Landlord-Friendly · EVEN
- County
- — inherits STATE
- City
- — inherits STATE
ZIP-level market 15624
- Active inventory
- 1
- Price-to-rent
- 12.4×
Monthly cashflow live
- Estimated rent
- $2,287 high interval (Pro) →
- Mortgage (P&I)
- −$891
- Tax est. 1.5%
- −$212 /mo · $2,548/yr
- Insurance
- −$71
- HOA
- −$0
- Vacancy / Maint / Mgmt
- −$480
- Net cashflow
- $633
Break-even live
2-unit breakdown (identical units grouped — click to expand)
| Units | Beds | Baths | Est. rent |
|---|---|---|---|
| 2× units | 3 | — | $2,286 |
| #1 | 3 | — | $1,143 |
| #2 | 3 | — | $1,143 |
| Total (2 units) | $2,287 | ||
UW: 25.0% down · 7.5% · 30yr · 1.5% tax · 5.0% vac · 8.0% maint · 8.0% mgmt
Financing live
Cash to close
- Down payment
- $42,475
- Closing costs
- $5,097
- Reserves months
- —
- Total cash needed
- —
Loan-product check · same deal, 3 products live
Conventional
25% down · 7.5% · 30yr
- Down + closing
- —
- Monthly P&I
- —
- Monthly cashflow
- —
- DSCR
- —
- Eligible?
- —
Personal DTI + credit; lowest rate.
DSCR
20% down · 8.5% · 30yr
- Down + closing
- —
- Monthly P&I
- —
- Monthly cashflow
- —
- DSCR
- —
- Eligible?
- —
No personal income docs; deal must DSCR.
Hard money
10% down · 12.0% · 12mo
- Down + closing
- —
- Monthly P&I
- —
- Monthly cashflow
- —
- DSCR
- —
- Eligible?
- —
Short-term bridge; refi at stabilization.
Rent comps 2 comps
| Address | Beds | Baths | Sqft | Rent | $/sqft | DOM | Units | Dist |
|---|---|---|---|---|---|---|---|---|
| 20 1st St Irwin, PA | 5.0 | 2.0 | — | $1,900 | — | 1d | 1 | 1.37mi |
| 1500 Pennsylvania Ave Unit NA Irwin, PA | 5.0 | 1.0 | 2200 | $2,800 | $1.27 | 43d | 1 | 1.43mi |
Listing history 15 events
-
2026-06-18days on market $169,900 Active 35 DOM
-
2026-06-17price $169,900 Active 34 DOM
-
2026-06-17days on market $179,900 Active 34 DOM
-
2026-06-16days on market $179,900 Active 33 DOM
-
2026-06-15days on market $179,900 Active 32 DOM
-
2026-06-13days on market $179,900 Active 30 DOM
-
2026-06-13days on market $179,900 Active 29 DOM
-
2026-06-09days on market $179,900 Active 26 DOM
-
2026-06-08days on market $179,900 Active 25 DOM
-
2026-06-07days on market $179,900 Active 24 DOM
-
2026-06-03days on market $179,900 Active 20 DOM
-
2026-06-02days on market $179,900 Active 19 DOM
-
2026-06-01days on market $179,900 Active 18 DOM
-
2026-05-31days on market $179,900 Active 17 DOM
-
2026-05-14$189,900 Active 983-char remark
ⓘ Source: listings_history table (triggers on properties + properties_extension) + one-shot
backfill from property_details.listing_events for pre-trigger history.
Climate risk First Street
- Flood 1/10 Low FEMA zone X (unshaded) · 0% chance over 30 yrs
- Wildfire 1/10 Low
- Heat 3/10 Moderate 7 d/yr ≥96°F today · 18 d/yr by 30 yrs out
- Wind 2/10 Low
- Air quality 3/10 Moderate 3 unhealthy d/yr today · 5 by 30 yrs out
Nearby sold comps map
Loading sold comps map…
Walkable amenities ~0.75 mi
Loading nearby amenities…
Taxation est. · year 1
- Rental income
- $27,444
- − Mortgage interest
- −$9,517
- − Property taxes
- −$2,548
- − Insurance
- −$850
- − Repairs & maintenance
- −$2,196
- − Management
- −$2,196
- − Depreciation
- −$4,943
- Taxable income
- $5,195
- Est. tax owed @ 24.0%
- −$1,247
- After-tax cash flow
- $6,344/yr
For passive investors: Depreciation is non-cash, so a rental often shows a tax loss while cash-flowing — sheltering income. Rental losses are passive: they offset passive income freely, and up to $25,000/yr can offset ordinary (W-2) income if you actively participate and your MAGI is under $100k (phasing out to $0 by $150k); unused losses carry forward. On sale, claimed depreciation is recaptured at up to 25%, and gains may owe capital-gains tax (a 1031 exchange can defer both). Figures are a year-1 estimate at your 24.0% rate — not tax advice; consult a CPA.
Condition & rehab AI · 30 photos
A fair condition multi-family home with moderate rehab needs, offering potential for significant value increase through updates.
Repairs flagged
- Moderate exterior siding — Visible wear and discoloration
- Minor interior paint — Some wear
- Minor kitchen cabinets — Some wear
Value-add opportunities
- Both update exterior siding — Enhances curb appeal and value
- Both paint interior walls — Improves appearance and value
- Both replace worn carpet — Enhances comfort and value
- Both update kitchen cabinets — Modernizes kitchen and adds value
Renovation cost estimate screening
| Repair item | Severity | Est. cost |
|---|---|---|
| exterior siding · Visible wear and discoloration | Moderate | $3,000–15,000 |
| interior paint · Some wear | Minor | $500–3,000 |
| kitchen cabinets · Some wear | Minor | $500–3,000 |
| Total estimated repair cost · 3 items | $4,000–21,000 |
Value-add ROI direction
- Both update exterior siding — Enhances curb appeal and value ↑
- Both paint interior walls — Improves appearance and value ↑
- Both replace worn carpet — Enhances comfort and value ↑
- Both update kitchen cabinets — Modernizes kitchen and adds value ↑
ⓘ Cost ranges are severity-bucket heuristics (US national rule-of-thumb). Get contractor quotes + a written scope before underwriting a rehab budget.
Schools (NCES district)
- District
- Norwin SD
- NCES district ID
- 4217940
- Math proficiency
- 60% ▼ -11.00%
- Reading proficiency
- 76% ▼ -6.00%
- Median HH income
- $62,686
- Composite
- 58.86/100
- National rank
- #973
- State rank
- #32 of 539 in PA
Livability — North Huntingdon
No livability data for this city. (Only ~50 U.S. cities are tracked.)
Census & demographics
- Population (ZIP)
- 489
Population outlook (Westmoreland County) Hauer SSP2
- Today (2025)
- 342,555 people
- By 2030
- 331,717 · -3.2%
- By 2040
- 304,976 · -11.0%
- By 2050
- 277,444 · -19.0%
- By 2075
- 224,607 · -34.4%
- By 2100
- 171,084 · -50.1%
Race, ethnicity, and origin ACS 2023
- Neighborhood character
- Predominantly White (99%)
- Race & ethnicity
- White 99%
- Common ancestry
- Romanian 38%
- Foreign-born
- 1% · Canada
- Languages at home
- 99% English-only · Spanish 1%
Political lean MEDSL · Westmoreland
- 2024 margin
- Strong R (+28.4) · D 35.4% · R 63.9%
- 2008→2024 swing
- -11.7pp toward R · 2008: -16.7pp · 2024: -28.4pp
- All cycles
- 2024: R+28.4 2020: R+28.3 2016: R+31.3 2012: R+23.7 2008: R+16.7
Not yet ingested
- Civics
- —
Market trends
- HPI YoY
- —
- Current HPI
- —
- Rent YoY
- —
- Metro
- —
- State GDP YoY
- ▲ 1.68%
- F500 in state
- 34
Industry mix (Fortune 500 HQ in PA)
| Industry | F500 HQs | Revenue |
|---|---|---|
| Healthcare | 2 | $309B |
|
||
| Insurance | 2 | $27B |
|
||
| Telecommunications / Media | 1 | $124B |
|
||
| Industrial Distribution | 1 | $22B |
|
||
| Financial Services | 1 | $20B |
|
||
| Chemicals / Materials | 1 | $18B |
|
||
Price history
-10.5% since first listed3 events — show timeline
- 2026-06-17 Price Changed $169,900 West Penn MLS
- 2026-05-26 Price Changed $179,900 West Penn MLS
- 2026-05-14 Listed $189,900 West Penn MLS
Cash-flow waterfall
monthlySold comps — $/sqft
last 12 mo · ≤1 miLoading sold comps…