1719 St Louis Ave · Fort Worth, TX
Flood risk No data
- FEMA flood zone
- —
- Chance of flooding over 30 yrs
- —
- Est. flood insurance / yr
- —
Fire risk No data
- Est. fire insurance / yr
- —
Heat risk No data
- Hot days now (above threshold)
- —
- Hot days in 30 yrs
- —
Wind risk No data
- Chance of severe wind over 30 yrs
- —
Air-quality risk No data
- Unhealthy air days now
- —
- Unhealthy air days in 30 yrs
- —
Risk factors via First Street. Map © Google.
Why this score? — see what drove the C grade
The composite is a weighted blend of 9 inputs, each scored 0–100. Each bar is that input's sub-score; the figure is the points it added to the 100-point composite (weight × sub-score).
- Cash flow +24.3/30.0
- DSCR +7.8/10.0
- ARV discount +7.5/15.0
- 1% rule +5.1/10.0
- Livability +4.0/5.0
- Rent growth +2.7/5.0
- Condition / age +2.5/5.0
- Schools +2.0/10.0
- Appreciation +0.0/10.0
$199,000
🖨 Deal sheet 📄 Offer letter ✓ Due diligence
Listing remarks
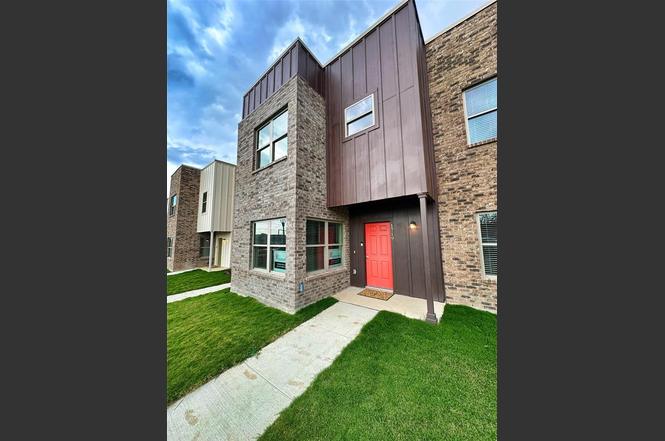
Come and look at this beautiful 2-story, 3-bedroom, 2 and a half-bath townhome offering 1,263 square feet of thoughtfully designed living space. In the heart of Fort Worth new construction features modern finishes throughout, including stainless steel appliances, quality cabinetry, and durable flooring. The open-concept main level is ideal for both daily living and entertaining, while all bedrooms are located upstairs for added privacy. The spacious primary suite includes a private bath. A 2-car garage provides added convenience. Located next to the hospital district, with easy access to shopping, dining, and major highways—this move-in-ready home is the perfect blend of comfort, styl
Key facts
- Durable flooring
- New construction
- Modern finishes
Tags
Property features AI
Finance
- Other: Builder special listing condition; Possession 30-60 days or at closing/funding
- Financial info: Listing accepts Cash, Conventional, FHA, and VA financing; No second mortgage recorded
- HOA & community: No association
Exterior
- Parking: 2 covered parking spaces; 2-car attached garage; No carport
- Utilities: City water; City sewer; Not in a municipal utility district
- Home design: Residential townhouse; Attached property; New construction completed in 2025
- Construction: Built with block, brick, metal siding and siding materials; Slab foundation; Shingle roof not specified
- Exterior features: Small lot (less than 0.5 acre)
Interior
- Kitchen: Electric range; Microwave; Refrigerator
- Bedrooms: 3 bedrooms (all on the main level)
- Bathrooms: 3 total bathrooms (2 full, 1 half)
- Heating & cooling: Electric heating; Electric cooling
- Interior features: Two-level layout; Open living area (1 living area); General interior listed as 'Other'
Neighborhood map
What this means for you Summary
Snapshot
- This is a 3-bed/2.5-bath other listed at $199k.
Deal economics
- At list price, monthly cash flow is $402 ($5k/yr) — positive.
- The deal already cash-flows at list — no discount required.
- Meets the 1% rule at list price ($2k rent vs $199k).
- Recommended offer: $181k (9.0% below list) — sets the bar for market timing.
- Cap rate 8.7% vs local median 3.9% in Fort Worth — top-decile yield for the area; either an underpriced asset or a hidden risk that comps aren't pricing in. Stress-test before assuming the spread holds.
Location & tenants
- Location reads 80/100 on livability (#49 in TX, #1,954 nationally) — a professional / high-income tenant draw. Strengths: amenities A+, cost of living A+, housing A+; Watch: crime F.
- Fort Worth ISD (urban): math 18% / reading 28% proficiency, ranked #742 of 826 in TX (top 90%) — low school quality limits family demand, transient renter base, plan for 1-2y turnover; 73% free/reduced lunch — lower-income household profile, screen leases tightly.
- Zoned schools: De Zavala El (math 17% / reading 32%, grade F, #3,052 of 4,322 statewide, top 74%, 266 students, 81% FRL).
- Market conditions: Rents flat; 150 active listings in the ZIP; 40 comparable units currently listed for rent nearby; rentals at typical pace (median 18d on market — plan ~3-4 weeks tenant-placement turnaround); 18,938 units permitted in Tarrant County in 2024 (8,336 in 5+ unit buildings).
- This rent runs 35% of the median local income ($70k/yr) — at the standard rent-burdened threshold; future hikes will face affordability resistance.
Forward outlook
- Local home prices are declining (-3.0%/yr); year-one equity from $1k of loan paydown is wiped out by about $6k of value loss. Plan a longer hold.
- Tarrant County population projected at +41% by 2050 — long-run rental-demand tailwind backs the buy-and-hold thesis.
Negotiation context
- It's been on market 116 days — a 9% lower offer ($181k) is reasonable based on typical stale-listing flexibility.
Questions for the listing agent
- It's been on market 116 days. Have you received any prior offers? Is the seller open to a 9% concession, seller financing, or rate buy-down credit?
- Why hasn't it sold? Are there any deal-killer items the seller is aware of (foundation, flood, title, zoning, code violations)?
- Is there a deadline driving the sale (1031 exchange, divorce, estate, relocation)? That informs how much negotiation room exists.
- Schools are D-rated, which usually means shorter tenancies and higher turnover. Who's the typical renter profile here, and what's been the actual vacancy rate?
- Crime grade is F in this area — have there been break-ins, vandalism, or insurance claims at this property in the last 3 years? What carrier currently insures it and at what premium?
- What's the average days-on-market for RENTAL listings here right now (not sales)? A rising rental-DOM trend means longer vacancies and softer asking-rent achievability than the comps imply.
- What's the recent tenant-quality profile in this submarket — average credit score on applications, eviction rate, late-payment / NSF rate, and stable-employment percentage? A property-management company in the area should have these aggregated.
- How much new for-sale + rental construction is in the pipeline within 1–3 miles? Heavy new supply typically softens prices + rents 12–24 months out; constrained supply supports both.
Investment metrics
- 1% rule
- 1.01% ✓
- Cap rate
- 8.72%
- Cash-on-cash
- 8.65%
- DSCR
- 1.38
- GRM
- 8.2
CMA / ARV
No comps found within radius.
Projected returns pro-forma
-3.0% appreciation · 0.7% rent growth · sell at horizon
- IRR
- -5.6%
- Equity multiple
- 0.80×
- Total profit
- $-11,305
- Equity at exit
- $29,672
- IRR
- 1.4%
- Equity multiple
- 1.09×
- Total profit
- $4,897
- Equity at exit
- $17,206
Cash invested: $55,720 (down + closing). Projections, not guarantees.
Landlord ↔ Tenant lean methodology
- Overall (STATE)
- 87 Strongly Landlord-Friendly
- State Texas
- 87 Strongly Landlord-Friendly · R+5
- County
- — inherits STATE
- City
- — inherits STATE
ZIP-level market 76110
- Rents YoY
- 0.7%
- Active inventory
- 150
- Price-to-rent
- 8.2×
Monthly cashflow live
- Estimated rent
- $2,015 high interval (Pro) →
- Mortgage (P&I)
- −$1,044
- Tax from tax record
- −$64 /mo · $766/yr
- Insurance
- −$83
- HOA
- −$0
- Vacancy / Maint / Mgmt
- −$423
- Net cashflow
- $402
Break-even live
UW: 25.0% down · 7.5% · 30yr · 1.5% tax · 5.0% vac · 8.0% maint · 8.0% mgmt
Financing live
Cash to close
- Down payment
- $49,750
- Closing costs
- $5,970
- Reserves months
- —
- Total cash needed
- —
Loan-product check · same deal, 3 products live
Conventional
25% down · 7.5% · 30yr
- Down + closing
- —
- Monthly P&I
- —
- Monthly cashflow
- —
- DSCR
- —
- Eligible?
- —
Personal DTI + credit; lowest rate.
DSCR
20% down · 8.5% · 30yr
- Down + closing
- —
- Monthly P&I
- —
- Monthly cashflow
- —
- DSCR
- —
- Eligible?
- —
No personal income docs; deal must DSCR.
Hard money
10% down · 12.0% · 12mo
- Down + closing
- —
- Monthly P&I
- —
- Monthly cashflow
- —
- DSCR
- —
- Eligible?
- —
Short-term bridge; refi at stabilization.
Rent comps 40 comps
| Address | Beds | Baths | Sqft | Rent | $/sqft | DOM | Units | Dist |
|---|---|---|---|---|---|---|---|---|
| 1920 Saint Louis Ave Fort Worth, TX | 4.0 | 3.0 | 1484 | $1,745 | $1.18 | 44d | 1 | 0.23mi |
| 1925 Saint Louis Ave Fort Worth, TX | 3.0 | 1.0 | 1219 | $1,695 | $1.39 | 44d | 1 | 0.23mi |
| 315 W Magnolia Ave Fort Worth, TX | 2.0 | 1.0–2.0 | 827 | $2,118 | $2.56 | 2d | 40 | 0.30mi |
| 1310 Crawford St Fort Worth, TX | 2.0 | 2.0 | 938 | $1,393 | $1.49 | 6d | 1 | 0.33mi |
| 501 W Rosedale St Fort Worth, TX | 1.0–2.0 | 1.0–2.0 | 795 | $1,990 | $2.50 | 3d | 19 | 0.46mi |
| 642 E Harvey Ave Fort Worth, TX | 4.0 | 2.0 | 1755 | $2,099 | $1.20 | 44d | 1 | 0.48mi |
| 1016 Bryan Ave Unit 102 Fort Worth, TX | 2.0 | 2.5 | 1400 | $2,500 | $1.79 | 24d | 1 | 0.54mi |
| 823 E Arlington Ave Fort Worth, TX | 4.0 | 2.5 | 1720 | $2,350 | $1.37 | 24d | 1 | 0.56mi |
| 1015 S Jennings Ave Unit 3121 Fort Worth, TX | 3.0 | 2.0 | 1238 | $1,656 | $1.34 | 20d | 1 | 0.60mi |
| 1015 S Jennings Ave Unit 612 Fort Worth, TX | 3.0 | 2.0 | 1238 | $1,656 | $1.34 | 3d | 1 | 0.60mi |
| 1015 S Jennings Ave Unit 1048 Fort Worth, TX | 3.0 | 2.0 | 1238 | $1,699 | $1.37 | 44d | 1 | 0.60mi |
| 1015 S Jennings Ave Unit 1072 Fort Worth, TX | 2.0 | 2.0 | 986 | $1,269 | $1.29 | 13d | 1 | 0.60mi |
| 1015 S Jennings Ave Unit 2121 Fort Worth, TX | 2.0 | 2.0 | 986 | $996 | $1.01 | 3d | 1 | 0.60mi |
| 1605 5th Ave Fort Worth, TX | 2.0 | 2.0 | 1050 | $1,495 | $1.42 | 19d | 1 | 0.62mi |
| 1001 W Rosedale St Fort Worth, TX | 1.0–2.0 | 1.0–2.5 | 1090 | $2,461 | $2.26 | 3d | 25 | 0.63mi |
| 958 E Allen Ave Fort Worth, TX | 3.0 | 3.0 | 1568 | $4,300 | $2.74 | 44d | 1 | 0.67mi |
| 1332 Driess St Fort Worth, TX | 3.0 | 2.0 | 1565 | $1,850 | $1.18 | 17d | 1 | 0.69mi |
| 650 S Main St Unit 707 Fort Worth, TX | 2.0 | 2.0 | 1068 | $1,619 | $1.52 | 15d | 1 | 0.79mi |
| 650 S Main St Unit 510 Fort Worth, TX | 2.0 | 2.0 | 1068 | $1,614 | $1.51 | 14d | 1 | 0.79mi |
| 1211 6th Ave Unit 201 Fort Worth, TX | 2.0 | 2.0 | 1000 | $5,000 | $5.00 | 20d | 1 | 0.80mi |
| 1511 Illinois Ave Fort Worth, TX | 4.0 | 2.0 | 1800 | $2,500 | $1.39 | 44d | 1 | 0.80mi |
| 1824 Fairmount Ave #1824 Fort Worth, TX | 2.0 | 1.0 | 890 | $1,595 | $1.79 | 17d | 1 | 0.80mi |
| 650 S Main St Fort Worth, TX | 2.0 | 2.0 | 1257 | $1,799 | $1.43 | 14d | 1 | 0.80mi |
| 650 S Main St Fort Worth, TX | 1.0–2.0 | 1.0–2.0 | 944 | $1,799 | $1.91 | 3d | 22 | 0.80mi |
| 1016 E Arlington Ave Unit C Fort Worth, TX | 2.0 | 1.0 | 918 | $995 | $1.08 | 17d | 1 | 0.81mi |
| 1000 S Henderson St Fort Worth, TX | 1.0–2.0 | 1.0–2.0 | 828 | $1,605 | $1.94 | 2d | 12 | 0.81mi |
| 2101 Fairmount Ave Fort Worth, TX | 3.0 | 2.5 | 1516 | $3,200 | $2.11 | 2d | 1 | 0.83mi |
| 2200 6th Ave Fort Worth, TX | 3.0 | 3.0 | 1552 | $2,650 | $1.71 | 44d | 1 | 0.83mi |
| 1057 E Oleander St Fort Worth, TX | 3.0 | 2.5 | 1501 | $2,435 | $1.62 | 21d | 1 | 0.90mi |
| 1108 7th Ave Unit 1145 Fort Worth, TX | 2.0 | 2.0 | 1373 | $2,447 | $1.78 | 3d | 1 | 0.95mi |
| 1108 7th Ave Fort Worth, TX | 2.0 | 2.0 | 1373 | $2,465 | $1.80 | 19d | 1 | 0.95mi |
| 1108 7th Ave Fort Worth, TX | 2.0 | 1.0–2.0 | 964 | $2,465 | $2.56 | 24d | 18 | 0.95mi |
| 1017 E Humbolt St Fort Worth, TX | 2.0 | 2.0 | 1400 | $1,550 | $1.11 | 44d | 1 | 0.97mi |
| 1011 Marion Ave Fort Worth, TX | 2.0 | 1.0 | 1000 | $1,400 | $1.40 | 44d | 1 | 0.99mi |
| 400 S Jennings St Unit 457 Fort Worth, TX | 2.0 | 2.0 | 1084 | $1,521 | $1.40 | 3d | 1 | 0.99mi |
| 401 Hemphill St Unit 438 Fort Worth, TX | 2.0 | 2.0 | 1085 | $1,997 | $1.84 | 3d | 1 | 1.00mi |
| 1519 W Rosedale St Fort Worth, TX | 2.0 | 2.0 | 1118 | $1,639 | $1.47 | 44d | 1 | 1.00mi |
| 429 College Ave Unit 466 Fort Worth, TX | 2.0 | 2.0 | 1030 | $1,761 | $1.71 | 3d | 1 | 1.03mi |
| 429 College Ave Fort Worth, TX | 2.0 | 2.0 | 1030 | $1,784 | $1.73 | 4d | 1 | 1.03mi |
| 1229 E Harvey Ave Fort Worth, TX | 3.0 | 2.0 | 1684 | $2,175 | $1.29 | 5d | 1 | 1.06mi |
Listing history 3 events
-
2026-05-10status Pending
-
2026-05-01historical Active Option Contract
-
2026-01-14$199,000 Active
ⓘ Source: listings_history table (triggers on properties + properties_extension) + one-shot
backfill from property_details.listing_events for pre-trigger history.
Tax reassessment forecast TX · Resets to sale price
- Current annual tax
- $766 · $64/mo
- Projected year-2 tax
- $3,642 · $303/mo
- Expected delta
- +$2,876/yr (+$240/mo · 375.3%)
ⓘ Screening estimate from a state-policy table — verify with the county assessor before closing.
Nearby sold comps map
Loading sold comps map…
Walkable amenities ~0.75 mi
Loading nearby amenities…
Taxation est. · year 1
- Rental income
- $24,183
- − Mortgage interest
- −$11,147
- − Property taxes
- −$766
- − Insurance
- −$995
- − Repairs & maintenance
- −$1,935
- − Management
- −$1,935
- − Depreciation
- −$5,789
- Taxable income
- $1,616
- Est. tax owed @ 24.0%
- −$388
- After-tax cash flow
- $4,432/yr
For passive investors: Depreciation is non-cash, so a rental often shows a tax loss while cash-flowing — sheltering income. Rental losses are passive: they offset passive income freely, and up to $25,000/yr can offset ordinary (W-2) income if you actively participate and your MAGI is under $100k (phasing out to $0 by $150k); unused losses carry forward. On sale, claimed depreciation is recaptured at up to 25%, and gains may owe capital-gains tax (a 1031 exchange can defer both). Figures are a year-1 estimate at your 24.0% rate — not tax advice; consult a CPA.
Schools (NCES district)
- District
- Fort Worth ISD
- NCES district ID
- 4819700
- Math proficiency
- 18% ▼ -16.00%
- Reading proficiency
- 28% ▼ -6.00%
- Median HH income
- $42,109
- Composite
- 19.61/100
- National rank
- #8753
- State rank
- #742 of 826 in TX
Livability — Fort Worth
- Score
- 80/100
- State rank
- #49
- US rank
- #1954
Category grades
Schools grade is shown separately in the Schools card above.
Census & demographics
- Census place
- Fort Worth, TX
- County
- Tarrant County · 2,033,669 people
- City population
- 911,619
- Metro
- Dallas-Fort Worth-Arlington, TX
- Population (ZIP)
- 33,441
- Household income
- $69,790
- Rent vs Own
- Severe rent burden
- 1471.0
Population outlook (Tarrant County) Hauer SSP2
- Today (2025)
- 2,380,417 people
- By 2030
- 2,578,900 · +8.3%
- By 2040
- 2,974,995 · +25.0%
- By 2050
- 3,350,489 · +40.8%
- By 2075
- 4,216,909 · +77.2%
- By 2100
- 4,741,527 · +99.2%
Race, ethnicity, and origin ACS 2023
- Neighborhood character
- Majority Hispanic (63%)
- Race & ethnicity
- Hispanic / Latino 63% White 30% Two or more races 24% Black 2% Asian 2%
- Hispanic origin (detail)
- Mexican 57%
- Common ancestry
- Slovak 1% Italian 1% Lithuanian 1%
- Foreign-born
- 26% · Canada, China
- Languages at home
- 45% English-only · Spanish 52% Other Asian/Pacific 1% Other Indo-European 1%
Political lean MEDSL · Tarrant
- 2024 margin
- Lean R (+5.1) · D 46.7% · R 51.9% · Other 1.4%
- 2008→2024 swing
- +6.6pp toward D · 2008: -11.7pp · 2024: -5.1pp
- All cycles
- 2024: R+5.1 2020: D+0.2 2016: R+8.7 2012: R+15.7 2008: R+11.7
Not yet ingested
- Civics
- —
Market trends
- HPI YoY
- ▼ -194.46%
- Current HPI
- 274.8888
- Rent YoY
- ▲ 0.70%
- Metro
- Dallas-Fort Worth-Arlington, TX
- State GDP YoY
- ▲ 3.95%
- F500 in state
- 110
Industry mix (Fortune 500 HQ in TX)
| Industry | F500 HQs | Revenue |
|---|---|---|
| Energy | 16 | $1,198B |
|
||
| Technology | 5 | $198B |
|
||
| Engineering / Construction | 4 | $72B |
|
||
| Energy Services | 3 | $60B |
|
||
| Utilities | 3 | $41B |
|
||
| Healthcare | 2 | $330B |
|
||
Price history
3 events — show timeline
- 2026-05-10 Pending — NTREIS
- 2026-05-01 Contingent — NTREIS
- 2026-01-14 Listed $199,000 NTREIS
Property tax history
-2.4%/yrLatest (2025): $766 · -2.4% YoY. Source: county tax records.
Cash-flow waterfall
monthlySold comps — $/sqft
last 12 mo · ≤1 miLoading sold comps…