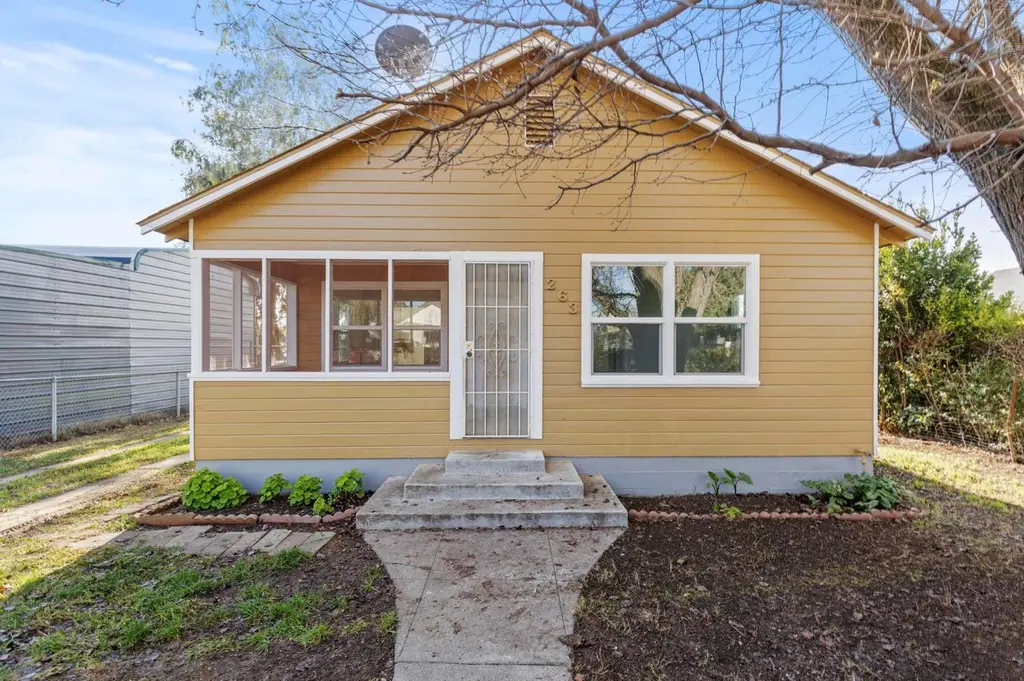
263 Olive St · Maxwell, CA
Flood risk 1/10 · Minimal
- FEMA flood zone
- X (unshaded)
- Chance of flooding over 30 yrs
- 0.0%
- Est. flood insurance / yr
- $507 – $1,088
Fire risk 2/10 · Minimal
- Est. fire insurance / yr
- $659 – $1,223
Heat risk 8/10 · Major
- Hot days now (above 105°F)
- 7 days/yr
- Hot days in 30 yrs
- 16 days/yr
Wind risk 1/10 · Minimal
- Chance of severe wind over 30 yrs
- —
Air-quality risk 10/10 · Severe
- Unhealthy air days now
- 32 days/yr
- Unhealthy air days in 30 yrs
- 33 days/yr
Risk factors via First Street. Map © Google.
Why this score? — see what drove the D grade
The composite is a weighted blend of 9 inputs, each scored 0–100. Each bar is that input's sub-score; the figure is the points it added to the 100-point composite (weight × sub-score).
- ARV discount +12.0/15.0
- Cash flow +10.2/30.0
- Appreciation +3.9/10.0
- Schools +3.3/10.0
- Livability +3.1/5.0
- DSCR +2.9/10.0
- Rent growth +2.5/5.0
- Condition / age +2.5/5.0
- 1% rule +1.8/10.0
$180,000
🖨 Deal sheet (PDF) 📄 Offer letter ✓ Due diligence
Listing remarks
So cute! 1 bedroom, 1 bath home featuring off-street parking. Sunroom, * NEW * dual pane windows, FRESH paint INSIDE & OUT, and all * NEW * flooring. Cozy layout with plenty of natural light and a functional floor plan. This is a great opportunity for a first-time buyer or investor.
Key facts
- Natural light
- Off-street parking
- 6,534 sq ft lot
Tags
Neighborhood map
What this means for you Summary
Snapshot
- This is a 1-bed/1.0-bath single-family listed at $180k.
Deal economics
- At list price, monthly cash flow is $-101 ($-1k/yr) — negative.
- To cash-flow at today's rent, offer at most $162k (10.0% below list).
- To meet the 1% rule (rent ≥ 1% of price), the offer needs to be $122k (32.2% below list).
- Recommended offer: $122k (32.2% below list) — sets the bar for 1% rule.
Location & tenants
- Location reads 62/100 on livability (#506 in CA) — a middle-class / working-renter tenant base. Strengths: housing A+, crime B+; Watch: employment D+, amenities F, commute F.
- Maxwell Unified (rural): math 35% / reading 35% proficiency, ranked #889 of 1,400 in CA (top 64%) — families likely to look elsewhere, expect single-tenant / working-renter base with shorter leases.
- Zoned schools: Maxwell Elementary (143 students, 63% FRL); Maxwell Middle (83 students, 57% FRL); Maxwell Sr High (114 students, 66% FRL) — zoned schools at 62% FRL track the district average.
- Market conditions: 7 active listings in the ZIP; 57 units permitted in Colusa County in 2024 (31 in 5+ unit buildings).
Forward outlook
- Local home prices are declining (-2.1%/yr); year-one equity from $1k of loan paydown is wiped out by about $4k of value loss. Plan a longer hold.
- Colusa County population projected to shrink 6% by 2050 — rents likely to lag national; underwrite the cash flow, not the appreciation.
Negotiation context
- It's been on market 80 days — a 6% lower offer ($169k) is reasonable based on typical stale-listing flexibility.
Risks & watch-outs
- Watch-outs: built in 1948 — expect roof / HVAC / electrical / plumbing capex.
- Climate carrying-cost: extreme-heat days projected 7→16/yr by 2055 (HVAC capex compounding) — expect insurance premiums to compound above CPI over the hold.
Questions for the listing agent
- What do current leases actually rent for vs. the listed asking? Can we see a recent rent roll and the last 12 months of T-12 income?
- It's been on market 80 days. Have you received any prior offers? Is the seller open to a 32% concession, seller financing, or rate buy-down credit?
- Built in 1948 — when were the roof, HVAC, electrical panel, plumbing, and water heater last replaced?
- Why hasn't it sold? Are there any deal-killer items the seller is aware of (foundation, flood, title, zoning, code violations)?
- Is there a deadline driving the sale (1031 exchange, divorce, estate, relocation)? That informs how much negotiation room exists.
- The area grade is low — what's the realistic commute time and amenity access for the typical tenant pool here? Any planned neighborhood developments (good or bad) we should know about?
- What's the average days-on-market for RENTAL listings here right now (not sales)? A rising rental-DOM trend means longer vacancies and softer asking-rent achievability than the comps imply.
- What's the recent tenant-quality profile in this submarket — average credit score on applications, eviction rate, late-payment / NSF rate, and stable-employment percentage? A property-management company in the area should have these aggregated.
- How much new for-sale + rental construction is in the pipeline within 1–3 miles? Heavy new supply typically softens prices + rents 12–24 months out; constrained supply supports both.
Investment metrics
- 1% rule
- 0.68% ✗
- Cap rate
- 5.62%
- Cash-on-cash
- -2.42%
- DSCR
- 0.89
- GRM
- 12.3
CMA / ARV
- ARV (median comp)
- $200,068
- List price
- $180,000
- Delta
- -10.03%
- Verdict
- UNDERPRICED
- Comps
- 4 within 1.0 mi
Show comp detail 2 sales within ~0.75 mi
| Address | Dist | Beds/Ba | Sqft | Sold | Price | $/sf | Match |
|---|---|---|---|---|---|---|---|
| 249 W Cedar St | 0.24mi | 2/2.0 (+1) | 630 (-12%) | 4mo | $195,000 | $310 | 56 |
| 40 Cosner Ave | 0.36mi | 2/1.0 (+1) | 788 (+9%) | 11mo | $250,000 | $317 | 54 |
Match score weights: distance 35% · size 25% · config 20% · recency 20%. Top-matched comps best support the ARV.
Projected returns pro-forma
-2.15% appreciation · 3.0% rent growth · sell at horizon
- IRR
- -15.1%
- Equity multiple
- 0.42×
- Total profit
- $-29,244
- Equity at exit
- $33,729
- IRR
- -7.6%
- Equity multiple
- 0.44×
- Total profit
- $-28,426
- Equity at exit
- $27,661
Cash invested: $50,400 (down + closing). Projections, not guarantees.
Landlord ↔ Tenant lean methodology
- Overall (STATE)
- 18 Strongly Tenant-Friendly
- State California
- 18 Strongly Tenant-Friendly · D+13
- County
- — inherits STATE
- City
- — inherits STATE
ZIP-level market 95955
- Home prices YoY
- -1.4%
- Active inventory
- 7
- Price-to-rent
- 12.3×
Monthly cashflow live
- Estimated rent
- $1,220 medium interval (Pro) →
- Mortgage (P&I)
- −$944
- Tax from tax record
- −$46 /mo · $556/yr
- Insurance
- −$75
- HOA
- −$0
- Vacancy / Maint / Mgmt
- −$256
- Net cashflow
- $-101
Break-even live
Sensitivity live
| Price | -10% $0 | -5% $-51 | +0% $-101 | +5% $-152 | +10% $-203 |
|---|---|---|---|---|---|
| Rent | -10% $-198 | -5% $-150 | +0% $-101 | +5% $-53 | +10% $-5 |
| Rate | -1.0pp $-11 | -0.5pp $-56 | base $-101 | +0.5pp $-148 | +1.0pp $-196 |
UW: 25.0% down · 7.5% · 30yr · 1.5% tax · 5.0% vac · 8.0% maint · 8.0% mgmt
Financing live
Cash to close
- Down payment
- $45,000
- Closing costs
- $5,400
- Reserves months
- —
- Total cash needed
- —
Loan-product check · same deal, 3 products live
Conventional
25% down · 7.5% · 30yr
- Down + closing
- —
- Monthly P&I
- —
- Monthly cashflow
- —
- DSCR
- —
- Eligible?
- —
Personal DTI + credit; lowest rate.
DSCR
20% down · 8.5% · 30yr
- Down + closing
- —
- Monthly P&I
- —
- Monthly cashflow
- —
- DSCR
- —
- Eligible?
- —
No personal income docs; deal must DSCR.
Hard money
10% down · 12.0% · 12mo
- Down + closing
- —
- Monthly P&I
- —
- Monthly cashflow
- —
- DSCR
- —
- Eligible?
- —
Short-term bridge; refi at stabilization.
Tax reassessment forecast CA · Resets to sale price
- Current annual tax
- $556 · $46/mo
- Projected year-2 tax
- $1,368 · $114/mo
- Expected delta
- +$812/yr (+$68/mo · 145.9%)
ⓘ Screening estimate from a state-policy table — verify with the county assessor before closing.
Climate risk First Street
- Flood 1/10 Low FEMA zone X (unshaded) · 0% chance over 30 yrs
- Wildfire 2/10 Low
- Heat 8/10 Severe 7 d/yr ≥105°F today · 16 d/yr by 30 yrs out
- Wind 1/10 Low
- Air quality 10/10 Extreme 32 unhealthy d/yr today · 33 by 30 yrs out
Nearby sold comps map
Loading sold comps map…
Walkable amenities ~0.75 mi
Loading nearby amenities…
Taxation est. · year 1
- Rental income
- $14,640
- − Mortgage interest
- −$10,083
- − Property taxes
- −$556
- − Insurance
- −$900
- − Repairs & maintenance
- −$1,171
- − Management
- −$1,171
- − Depreciation
- −$5,236
- Taxable loss
- −$4,477
- Est. tax savings @ 24.0%
- +$1,075
- After-tax cash flow
- $-143/yr
For passive investors: Depreciation is non-cash, so a rental often shows a tax loss while cash-flowing — sheltering income. Rental losses are passive: they offset passive income freely, and up to $25,000/yr can offset ordinary (W-2) income if you actively participate and your MAGI is under $100k (phasing out to $0 by $150k); unused losses carry forward. On sale, claimed depreciation is recaptured at up to 25%, and gains may owe capital-gains tax (a 1031 exchange can defer both). Figures are a year-1 estimate at your 24.0% rate — not tax advice; consult a CPA.
Schools (NCES district)
- District
- Maxwell Unified
- NCES district ID
- 0624150
- Math proficiency
- 35% ▬ 0.00%
- Reading proficiency
- 35% ▲ 5.00%
- Median HH income
- $48,540
- Composite
- 32.84/100
- National rank
- #10733
- State rank
- #889 of 1400 in CA
Livability — Maxwell
- Score
- 62/100
- State rank
- #506
- US rank
- #17120
Category grades
Schools grade is shown separately in the Schools card above.
Census & demographics
- Census place
- Maxwell, CA
- Population (ZIP)
- 1,311
Population outlook (Colusa County) Hauer SSP2
- Today (2025)
- 21,153 people
- By 2030
- 20,974 · -0.8%
- By 2040
- 20,559 · -2.8%
- By 2050
- 19,830 · -6.3%
- By 2075
- 17,194 · -18.7%
- By 2100
- 13,264 · -37.3%
Race, ethnicity, and origin ACS 2023
- Neighborhood character
- Predominantly Hispanic (68%)
- Race & ethnicity
- Hispanic / Latino 68% Two or more races 34% White 31%
- Hispanic origin (detail)
- Mexican 67%
- Common ancestry
- Russian 10% Italian 3% Lithuanian 2%
- Foreign-born
- 28% · Canada
- Languages at home
- 42% English-only · Spanish 56% Other Indo-European 1%
Political lean MEDSL · Colusa
- 2024 margin
- Strong R (+28.2) · D 34.6% · R 62.9% · Other 2.5%
- 2008→2024 swing
- -10.1pp toward R · 2008: -18.1pp · 2024: -28.2pp
- All cycles
- 2024: R+28.2 2020: R+16.6 2016: R+13.5 2012: R+21.7 2008: R+18.1
Not yet ingested
- Civics
- —
Market trends
- HPI YoY
- ▼ -2.15%
- Current HPI
- 148.1914
- Rent YoY
- —
- Metro
- —
- State GDP YoY
- ▲ 3.21%
- F500 in state
- 116
Industry mix (Fortune 500 HQ in CA)
| Industry | F500 HQs | Revenue |
|---|---|---|
| Technology | 27 | $1,492B |
|
||
| Financial Services | 3 | $174B |
|
||
| Retail | 3 | $44B |
|
||
| Insurance | 3 | $26B |
|
||
| Media / Entertainment | 2 | $115B |
|
||
| Pharmaceuticals / Biotech | 2 | $62B |
|
||
Property tax history
+0.7%/yrLatest (2025): $556 · +2.3% YoY. Source: county tax records.
Cash-flow waterfall
monthlySold comps — $/sqft
last 12 mo · ≤1 miLoading sold comps…