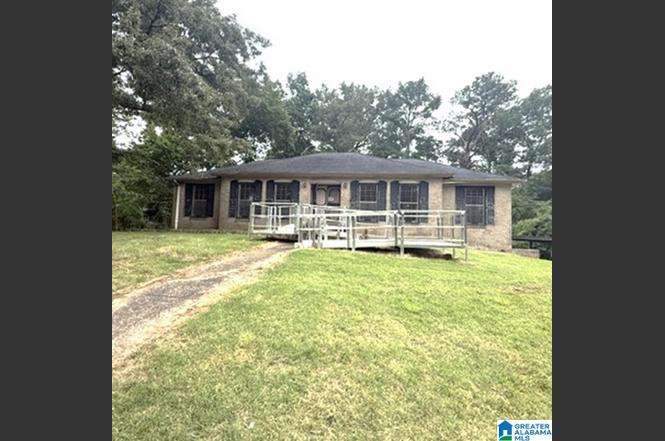
749 Forestwood Rd · Forestdale, AL
Flood risk 1/10 · Minimal
- FEMA flood zone
- X (unshaded)
- Chance of flooding over 30 yrs
- 0.0%
- Est. flood insurance / yr
- $473 – $860
Fire risk 3/10 · Minor
- Est. fire insurance / yr
- $916 – $1,700
Heat risk 6/10 · Moderate
- Hot days now (above 107°F)
- 7 days/yr
- Hot days in 30 yrs
- 19 days/yr
Wind risk 6/10 · Moderate
- Chance of severe wind over 30 yrs
- 27.0%
Air-quality risk 4/10 · Minor
- Unhealthy air days now
- 4 days/yr
- Unhealthy air days in 30 yrs
- 8 days/yr
Risk factors via First Street. Map © Google.
Why this score? — see what drove the B- grade
The composite is a weighted blend of 9 inputs, each scored 0–100. Each bar is that input's sub-score; the figure is the points it added to the 100-point composite (weight × sub-score).
- Cash flow +30.0/30.0
- 1% rule +10.0/10.0
- DSCR +10.0/10.0
- ARV discount +7.5/15.0
- Livability +2.9/5.0
- Rent growth +2.7/5.0
- Condition / age +2.5/5.0
- Schools +1.8/10.0
- Appreciation +0.0/10.0
$64,000
🖨 Deal sheet 📄 Offer letter ✓ Due diligence
Listing remarks
Take a look at this treasure! You won’t believe the space in this 3-bedroom, 2-bath all-brick home. Brick gas fireplace, generously sized bedrooms, it has so much to offer. Don’t miss your chance to own this spacious and welcoming home act fast before it’s gone!
Key facts
- 2 garage spots
- Built 1967
- Listed 6 days
Property features AI
Finance
- Other: Property in Holiday Hills subdivision; Not in a flood plain
- HOA & community: No association/HOA fee
Exterior
- Parking: Attached garage with side entry; Total of 2 garage spaces; Driveway parking; Basement-level garage spaces listed (2)
- Utilities: Public water; Septic system; Electric water heater; Internet service availability unknown
- Home design: 4-side brick construction; Basement foundation; Daylight basement with both finished and unfinished areas; Existing (previously built) property; Public road access
- Construction: 4-sided brick exterior; Basement foundation; Daylight basement; portions finished and unfinished
- Exterior features: Fenced yard; Covered patio; Some trees on the lot; Ramps noted for special needs access
Interior
- Kitchen: Electric cooktop; Built-in dishwasher; Double oven; Laminate countertops
- Bedrooms: Multiple bedrooms on main level including a master bedroom; Additional den/family room in the daylight basement
- Flooring: Tile flooring; Vinyl flooring; Subflooring
- Bathrooms: Two full bathrooms; Bathroom features include separate shower and tub/shower combination
- Heating & cooling: Central heating; Central air conditioning; Ceiling fans noted as an energy/green feature
- Interior features: One gas fireplace with brick surround located in the den; Ceilings listed as other (see remarks); No additional interior features specified
- Laundry & utility: Laundry area in the basement with washer hookup; Dryer hookup (electric); Utility sink; Laundry/washer hook up located in garage area
Neighborhood map
What this means for you Summary
Snapshot
- This is a 3-bed/2.0-bath single-family listed at $64k.
Deal economics
- At list price, monthly cash flow is $731 ($9k/yr) — positive.
- The deal already cash-flows at list — no discount required.
- Meets the 1% rule at list price ($1k rent vs $64k).
- Cap rate 20.0% vs local median 6.5% in Forestdale — top-decile yield for the area; either an underpriced asset or a hidden risk that comps aren't pricing in. Stress-test before assuming the spread holds.
Location & tenants
- Location reads 58/100 on livability (#367 in AL) — a working-class tenant base; expect higher turnover. Strengths: cost of living A+, housing A+; Watch: employment D+, amenities F, commute F.
- Jefferson County (suburban): math 9% / reading 32% proficiency, ranked #104 of 129 in AL (top 81%) — low school quality limits family demand, transient renter base, plan for 1-2y turnover.
- Zoned schools: Minor High School (math 4% / reading 8%, grade F, #275 of 305 statewide, top 90%, 915 students, 84% FRL) — zoned schools average 84% FRL vs 49% district-wide (35 pts higher); higher-poverty schools than district average — tighter screening recommended.
- Zoned-school proficiency averages 6% at this address vs 20% district-wide (-15 pts) — the specific schools serving this property underperform the Jefferson County average; the district grade overstates school quality for this exact location.
- Market conditions: Rents flat; 116 active listings in the ZIP; 4 comparable units currently listed for rent nearby; rentals at typical pace (median 19d on market — plan ~3-4 weeks tenant-placement turnaround); 2,114 units permitted in Jefferson County in 2024 (556 in 5+ unit buildings).
- This rent runs 32% of the median local income ($56k/yr) — at the standard rent-burdened threshold; future hikes will face affordability resistance.
Forward outlook
- Local home prices are declining (-3.0%/yr); year-one equity from $442 of loan paydown is wiped out by about $2k of value loss. Plan a longer hold.
- Jefferson County population projected to shrink 4% by 2050 — rents likely to lag national; underwrite the cash flow, not the appreciation.
- At projected returns (-3.0% appreciation + 0.7% rent growth), your $18k cash investment doubles in ~3 years — after that, you're playing with house money.
Negotiation context
- Only 6 days on market — expect competitive offers; lowballing is unlikely to land.
- 2 sale attempts with the ask held roughly flat each time — persistent listings suggest the price (not the market) is what's stuck; bring a comps-based counter.
Risks & watch-outs
- Climate carrying-cost: major wind risk, 27% chance of damaging wind over 30y; extreme-heat days projected 7→19/yr by 2055 (HVAC capex compounding) — expect insurance premiums to compound above CPI over the hold.
Questions for the listing agent
- Built in 1967 — when were the roof, HVAC, electrical panel, plumbing, and water heater last replaced?
- Is there a deadline driving the sale (1031 exchange, divorce, estate, relocation)? That informs how much negotiation room exists.
- Schools are D-rated, which usually means shorter tenancies and higher turnover. Who's the typical renter profile here, and what's been the actual vacancy rate?
- What's the average days-on-market for RENTAL listings here right now (not sales)? A rising rental-DOM trend means longer vacancies and softer asking-rent achievability than the comps imply.
- What's the recent tenant-quality profile in this submarket — average credit score on applications, eviction rate, late-payment / NSF rate, and stable-employment percentage? A property-management company in the area should have these aggregated.
- How much new for-sale + rental construction is in the pipeline within 1–3 miles? Heavy new supply typically softens prices + rents 12–24 months out; constrained supply supports both.
Investment metrics
- 1% rule
- 2.32% ✓
- Cap rate
- 20.01%
- Cash-on-cash
- 48.98%
- DSCR
- 3.18
- GRM
- 3.6
CMA / ARV
- ARV (on-the-fly)
- $195,605
- Comps found
- 12
Show comp detail 12 sales within ~0.75 mi
| Address | Dist | Beds/Ba | Sqft | Sold | Price | $/sf | Match |
|---|---|---|---|---|---|---|---|
| 1454 Heron Dr | 0.19mi | 3/2.0 | 2,028 (-2%) | 10mo | $199,900 | $99 | 80 |
| 1501 Mohican Dr | 0.19mi | 4/3.0 (+1) | 2,061 (+0%) | 6mo | $265,000 | $129 | 78 |
| 1518 Hialeah Dr | 0.12mi | 4/2.0 (+1) | 2,164 (+5%) | 13mo | $110,000 | $51 | 70 |
| 1005 Inzer Dr | 0.53mi | 3/2.0 | 2,196 (+7%) | 1mo | $200,500 | $91 | 63 |
| 723 Comanche Ln | 0.51mi | 3/2.0 | 2,160 (+5%) | 9mo | $185,000 | $86 | 60 |
| 778 Heflin Ave E | 0.32mi | 3/2.0 | 1,796 (-13%) | 7mo | $125,000 | $70 | 58 |
| 732 Madeline Dr | 0.37mi | 3/2.0 | 1,868 (-9%) | 12mo | $177,000 | $95 | 57 |
| 1382 Tomahawk Rd | 0.50mi | 3/3.0 | 1,815 (-12%) | 8mo | $245,000 | $135 | 46 |
| 249 Lapala Dr | 0.71mi | 3/2.0 | 2,287 (+11%) | 4mo | $189,000 | $83 | 45 |
| 733 Heflin Ave E | 0.44mi | 4/2.5 (+1) | 1,770 (-14%) | 12mo | $218,500 | $123 | 39 |
| 506 Forestwood Dr | 0.65mi | 4/3.0 (+1) | 1,782 (-14%) | 7mo | $235,000 | $132 | 33 |
| 628 Heflin Ave E | 0.61mi | 4/3.0 (+1) | 1,753 (-15%) | 8mo | $76,000 | $43 | 32 |
Match score weights: distance 35% · size 25% · config 20% · recency 20%. Top-matched comps best support the ARV.
Projected returns pro-forma
-3.0% appreciation · 0.74% rent growth · sell at horizon
- IRR
- 44.0%
- Equity multiple
- 2.84×
- Total profit
- $32,932
- Equity at exit
- $9,543
- IRR
- 48.9%
- Equity multiple
- 5.23×
- Total profit
- $75,795
- Equity at exit
- $5,534
Cash invested: $17,920 (down + closing). Projections, not guarantees.
Landlord ↔ Tenant lean methodology
- Overall (STATE)
- 90 Strongly Landlord-Friendly
- State Alabama
- 90 Strongly Landlord-Friendly · R+15
- County
- — inherits STATE
- City
- — inherits STATE
ZIP-level market 35214
- Home prices YoY
- -20.0%
- Rents YoY
- 0.7%
- Active inventory
- 116
- Price-to-rent
- 3.6×
Monthly cashflow live
- Estimated rent
- $1,486 medium interval (Pro) →
- Mortgage (P&I)
- −$336
- Tax est. 1.5%
- −$80 /mo · $960/yr
- Insurance
- −$27
- HOA
- −$0
- Vacancy / Maint / Mgmt
- −$312
- Net cashflow
- $731
Break-even live
UW: 25.0% down · 7.5% · 30yr · 1.5% tax · 5.0% vac · 8.0% maint · 8.0% mgmt
Financing live
Cash to close
- Down payment
- $16,000
- Closing costs
- $1,920
- Reserves months
- —
- Total cash needed
- —
Loan-product check · same deal, 3 products live
Conventional
25% down · 7.5% · 30yr
- Down + closing
- —
- Monthly P&I
- —
- Monthly cashflow
- —
- DSCR
- —
- Eligible?
- —
Personal DTI + credit; lowest rate.
DSCR
20% down · 8.5% · 30yr
- Down + closing
- —
- Monthly P&I
- —
- Monthly cashflow
- —
- DSCR
- —
- Eligible?
- —
No personal income docs; deal must DSCR.
Hard money
10% down · 12.0% · 12mo
- Down + closing
- —
- Monthly P&I
- —
- Monthly cashflow
- —
- DSCR
- —
- Eligible?
- —
Short-term bridge; refi at stabilization.
Rent comps 4 comps
| Address | Beds | Baths | Sqft | Rent | $/sqft | DOM | Units | Dist |
|---|---|---|---|---|---|---|---|---|
| 634 Broken Bow Cir Birmingham, AL | 3.0 | 2.0 | 1890 | $1,625 | $0.86 | 19d | 1 | 0.35mi |
| 939 Brandy Ln Birmingham, AL | 3.0 | 1.0 | 1652 | $1,180 | $0.71 | 43d | 1 | 0.72mi |
| 1712 Riderwood Trl Birmingham, AL | 3.0 | 1.0 | 1456 | $1,150 | $0.79 | 15d | 1 | 0.87mi |
| 120 Dewberry Ln Birmingham, AL | 3.0 | 2.0 | 1485 | $1,510 | $1.02 | 19d | 1 | 1.08mi |
Listing history 5 events
-
2026-06-15status $64,000 Pending 6 DOM
-
2026-06-15days on market $64,000 Contingent 6 DOM
-
2026-06-13days on market $64,000 Contingent 4 DOM
-
2026-06-10remarks 262-char remark
-
2026-06-10$64,000 Contingent 1 DOM
ⓘ Source: listings_history table (triggers on properties + properties_extension) + one-shot
backfill from property_details.listing_events for pre-trigger history.
Climate risk First Street
- Flood 1/10 Low FEMA zone X (unshaded) · 0% chance over 30 yrs
- Wildfire 3/10 Moderate
- Heat 6/10 Major 7 d/yr ≥107°F today · 19 d/yr by 30 yrs out
- Wind 6/10 Major 27% chance of damaging wind over 30 yrs
- Air quality 4/10 Moderate 4 unhealthy d/yr today · 8 by 30 yrs out
Nearby sold comps map
Loading sold comps map…
Walkable amenities ~0.75 mi
Loading nearby amenities…
Taxation est. · year 1
- Rental income
- $17,828
- − Mortgage interest
- −$3,585
- − Property taxes
- −$960
- − Insurance
- −$320
- − Repairs & maintenance
- −$1,426
- − Management
- −$1,426
- − Depreciation
- −$1,862
- Taxable income
- $8,249
- Est. tax owed @ 24.0%
- −$1,980
- After-tax cash flow
- $6,797/yr
For passive investors: Depreciation is non-cash, so a rental often shows a tax loss while cash-flowing — sheltering income. Rental losses are passive: they offset passive income freely, and up to $25,000/yr can offset ordinary (W-2) income if you actively participate and your MAGI is under $100k (phasing out to $0 by $150k); unused losses carry forward. On sale, claimed depreciation is recaptured at up to 25%, and gains may owe capital-gains tax (a 1031 exchange can defer both). Figures are a year-1 estimate at your 24.0% rate — not tax advice; consult a CPA.
Schools (NCES district)
- District
- Jefferson County
- NCES district ID
- 0101920
- Math proficiency
- 9% ▼ -24.00%
- Reading proficiency
- 32% ▼ -5.00%
- Median HH income
- $51,712
- Composite
- 18.4/100
- National rank
- #8937
- State rank
- #104 of 129 in AL
Livability — Forestdale
- Score
- 58/100
- State rank
- #367
- US rank
- #21236
Category grades
Schools grade is shown separately in the Schools card above.
Census & demographics
- Census place
- Forestdale, AL
- County
- Jefferson County · 527,445 people
- City population
- 17,027
- Metro
- Birmingham-Hoover, AL
- Population (ZIP)
- 17,027
- Household income
- $56,383
- Rent vs Own
- Severe rent burden
- 578.0
Population outlook (Jefferson County) Hauer SSP2
- Today (2025)
- 669,185 people
- By 2030
- 669,694 · +0.1%
- By 2040
- 661,388 · -1.2%
- By 2050
- 643,086 · -3.9%
- By 2075
- 577,267 · -13.7%
- By 2100
- 474,758 · -29.1%
Race, ethnicity, and origin ACS 2023
- Neighborhood character
- Predominantly Black (77%)
- Race & ethnicity
- Black 77% White 18% Two or more races 2%
- Foreign-born
- 1% · Canada
- Languages at home
- 98% English-only · Spanish 2%
Political lean MEDSL · Jefferson
- 2024 margin
- D (+10.4) · D 54.6% · R 44.2% · Other 1.2%
- 2008→2024 swing
- +5.4pp toward D · 2008: 5.1pp · 2024: 10.4pp
- All cycles
- 2024: D+10.4 2020: D+13.2 2016: D+7.2 2012: D+6.0 2008: D+5.1
Not yet ingested
- Civics
- —
Market trends
- HPI YoY
- ▼ -54.48%
- Current HPI
- 218.5233
- Rent YoY
- ▲ 0.74%
- Metro
- Birmingham-Hoover, AL
- State GDP YoY
- ▲ 2.94%
- F500 in state
- 4
Industry mix (Fortune 500 HQ in AL)
| Industry | F500 HQs | Revenue |
|---|---|---|
| Financial Services | 1 | $8B |
|
||
| Healthcare | 1 | $5B |
|
||
Price history
-57.3% since first listed3 events — show timeline
- 2026-06-09 Listed — Greater Alabama MLS
- 2026-05-29 Listed $64,000 Greater Alabama MLS
- 2005-09-09 Sold (Public Records) $149,900 Public Records
Cash-flow waterfall
monthlySold comps — $/sqft
last 12 mo · ≤1 miLoading sold comps…