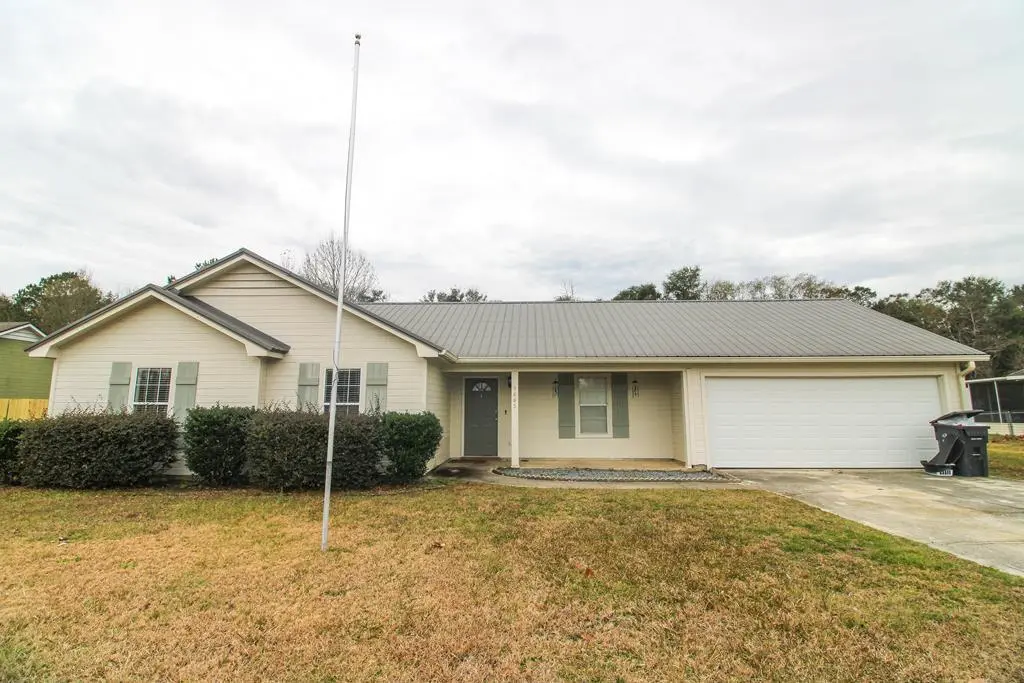
3885 Brookfield Dr · Bemiss, GA
Flood risk 1/10 · Minimal
- FEMA flood zone
- X (unshaded)
- Chance of flooding over 30 yrs
- 0.0%
- Est. flood insurance / yr
- $507 – $1,088
Fire risk 6/10 · Moderate
- Est. fire insurance / yr
- $963 – $1,789
Heat risk 7/10 · Major
- Hot days now (above 108°F)
- 7 days/yr
- Hot days in 30 yrs
- 19 days/yr
Wind risk 8/10 · Major
- Chance of severe wind over 30 yrs
- 99.0%
Air-quality risk 6/10 · Moderate
- Unhealthy air days now
- 12 days/yr
- Unhealthy air days in 30 yrs
- 14 days/yr
Risk factors via First Street. Map © Google.
Why this score? — see what drove the D grade
The composite is a weighted blend of 9 inputs, each scored 0–100. Each bar is that input's sub-score; the figure is the points it added to the 100-point composite (weight × sub-score).
- Cash flow +12.9/30.0
- ARV discount +9.4/15.0
- Schools +4.7/10.0
- DSCR +3.9/10.0
- Rent growth +3.8/5.0
- 1% rule +3.1/10.0
- Livability +2.5/5.0
- Condition / age +2.5/5.0
- Appreciation +0.0/10.0
$229,900
🖨 Deal sheet (PDF) 📄 Offer letter ✓ Due diligence
Listing remarks MLS
Welcome to this charming 3-bedroom, 2-bath home featuring vaulted ceilings and beautiful updates throughout. The kitchen showcases gorgeous granite countertops and modern finishes, while shiplap accents and LVP flooring in the common areas add a warm, stylish touch. A spacious 11x13 bonus room offers endless possibilities — perfect for an office, playroom, or guest space. Enjoy outdoor living in the large fenced backyard with an extended poured patio, ideal for entertaining. With a newer metal roof and a convenient location close to Moody AFB, SGMC, and local amenities, this home has so much to offer!
Key facts
- Bonus room
- Lvp flooring
- Vaulted ceilings
Tags
Neighborhood map
What this means for you Summary
Snapshot
- This is a 3-bed/2.0-bath single-family listed at $230k.
Deal economics
- At list price, monthly cash flow is $-15 ($-178/yr) — negative.
- To cash-flow at today's rent, offer at most $227k (1.1% below list).
- To meet the 1% rule (rent ≥ 1% of price), the offer needs to be $186k (19.3% below list).
- Recommended offer: $186k (19.3% below list) — sets the bar for 1% rule.
- Cap rate 6.2% vs local median 4.7% in Bemiss — top-decile yield for the area; either an underpriced asset or a hidden risk that comps aren't pricing in. Stress-test before assuming the spread holds.
Location & tenants
- Location reads: area grade D — affects rentability + tenant quality, not the cash-flow math above.
- Lowndes County (rural): math 59% / reading 52% proficiency, ranked #8 of 174 in GA (top 5%) — acceptable for families but not a draw, mixed tenant base, ~2y average lease.
- Zoned schools: Dewar Elementary (math 61% / reading 47%, grade C, #204 of 1,228 statewide, top 17%, 859 students, 50% FRL); Pine Grove Middle School (math 56% / reading 57%, grade B, #48 of 470 statewide, top 10%, 742 students, 50% FRL); Lowndes High School (math 69% / reading 51%, grade C+, #14 of 424 statewide, top 3%, 3,201 students, 39% FRL) — zoned schools at 46% FRL track the district average.
- Market conditions: Rents rising fast (+5.1%/yr); 233 active listings in the ZIP; 26 comparable units currently listed for rent nearby; rentals at typical pace (median 23d on market — plan ~3-4 weeks tenant-placement turnaround); solid renter incomes; 896 units permitted in Lowndes County in 2024 (0 in 5+ unit buildings).
Forward outlook
- Local home prices are declining (-3.0%/yr); year-one equity from $2k of loan paydown is wiped out by about $7k of value loss. Plan a longer hold.
- Lowndes County population projected at +10% by 2050 — modest demand growth; plan on rents tracking national, not racing it.
Negotiation context
- It's been on market 249 days — a 12% lower offer ($202k) is reasonable based on typical stale-listing flexibility.
- 5 sale attempts since 8y ago with the ask held roughly flat each time — persistent listings suggest the price (not the market) is what's stuck; bring a comps-based counter.
Risks & watch-outs
- Climate carrying-cost: severe wind risk, 99% chance of damaging wind over 30y; major wildfire risk; extreme-heat days projected 7→19/yr by 2055 (HVAC capex compounding) — expect insurance premiums to compound above CPI over the hold.
Questions for the listing agent
- What do current leases actually rent for vs. the listed asking? Can we see a recent rent roll and the last 12 months of T-12 income?
- It's been on market 249 days. Have you received any prior offers? Is the seller open to a 19% concession, seller financing, or rate buy-down credit?
- Why hasn't it sold? Are there any deal-killer items the seller is aware of (foundation, flood, title, zoning, code violations)?
- Is there a deadline driving the sale (1031 exchange, divorce, estate, relocation)? That informs how much negotiation room exists.
- The area grade is low — what's the realistic commute time and amenity access for the typical tenant pool here? Any planned neighborhood developments (good or bad) we should know about?
- What's the average days-on-market for RENTAL listings here right now (not sales)? A rising rental-DOM trend means longer vacancies and softer asking-rent achievability than the comps imply.
- What's the recent tenant-quality profile in this submarket — average credit score on applications, eviction rate, late-payment / NSF rate, and stable-employment percentage? A property-management company in the area should have these aggregated.
- How much new for-sale + rental construction is in the pipeline within 1–3 miles? Heavy new supply typically softens prices + rents 12–24 months out; constrained supply supports both.
Investment metrics
- 1% rule
- 0.81% ✗
- Cap rate
- 6.22%
- Cash-on-cash
- -0.28%
- DSCR
- 0.99
- GRM
- 10.3
CMA / ARV
- ARV (median comp)
- $240,079
- List price
- $229,900
- Delta
- -4.24%
- Verdict
- FAIR
- Comps
- 20 within 1.0 mi
Show comp detail 12 sales within ~0.75 mi
| Address | Dist | Beds/Ba | Sqft | Sold | Price | $/sf | Match |
|---|---|---|---|---|---|---|---|
| 3859 Stratford Cir | 0.22mi | 3/2.0 | 1,519 (-2%) | 2mo | $239,900 | $158 | 85 |
| 3859 Studstill Rd | 0.19mi | 3/2.0 | 1,482 (-5%) | 1mo | $240,000 | $162 | 82 |
| 3823 Merriman Ct | 0.28mi | 3/2.0 | 1,509 (-3%) | 2mo | $225,000 | $149 | 80 |
| 4052 Glen Laurel Dr E | 0.52mi | 3/2.0 | 1,530 (-2%) | 2mo | $269,000 | $176 | 71 |
| 3679 Newbury Dr | 0.57mi | 3/2.0 | 1,454 (-6%) | 0mo | $232,500 | $160 | 62 |
| 6206 Bemiss Springs Dr | 0.59mi | 3/2.5 | 1,459 (-6%) | 0mo | $235,900 | $162 | 60 |
| 6194 Bemiss Springs Dr | 0.60mi | 3/2.5 | 1,459 (-6%) | 0mo | $239,900 | $164 | 60 |
| 6154 Bemiss Springs Dr | 0.63mi | 3/2.5 | 1,470 (-5%) | 0mo | $243,900 | $166 | 60 |
| 3772 Robin Ln | 0.72mi | 3/2.0 | 1,426 (-8%) | 2mo | $225,000 | $158 | 51 |
| 4513 Windward Ct | 0.69mi | 3/2.0 | 1,397 (-10%) | 0mo | $230,000 | $165 | 51 |
| 3705 Cross Creek Cir | 0.65mi | 3/2.0 | 1,726 (+11%) | 2mo | $256,900 | $149 | 50 |
| 3826 Coventry Dr | 0.62mi | 4/2.0 (+1) | 1,758 (+13%) | 2mo | $295,000 | $168 | 43 |
Match score weights: distance 35% · size 25% · config 20% · recency 20%. Top-matched comps best support the ARV.
Projected returns pro-forma
-3.0% appreciation · 5.07% rent growth · sell at horizon
- IRR
- -14.6%
- Equity multiple
- 0.47×
- Total profit
- $-34,293
- Equity at exit
- $34,279
- IRR
- -3.1%
- Equity multiple
- 0.78×
- Total profit
- $-14,352
- Equity at exit
- $19,878
Cash invested: $64,372 (down + closing). Projections, not guarantees.
Landlord ↔ Tenant lean methodology
- Overall (STATE)
- 90 Strongly Landlord-Friendly
- State Georgia
- 90 Strongly Landlord-Friendly · R+3
- County
- — inherits STATE
- City
- — inherits STATE
ZIP-level market 31605
- Home prices YoY
- -11.5%
- Rents YoY
- 5.1%
- Active inventory
- 233
- Price-to-rent
- 10.3×
Monthly cashflow live
- Estimated rent
- $1,855 high interval (Pro) →
- Mortgage (P&I)
- −$1,206
- Tax from tax record
- −$179 /mo · $2,147/yr
- Insurance
- −$96
- HOA
- −$0
- Vacancy / Maint / Mgmt
- −$390
- Net cashflow
- $-15
Break-even live
Sensitivity live
| Price | -10% $115 | -5% $50 | +0% $-15 | +5% $-80 | +10% $-145 |
|---|---|---|---|---|---|
| Rent | -10% $-161 | -5% $-88 | +0% $-15 | +5% $58 | +10% $132 |
| Rate | -1.0pp $101 | -0.5pp $44 | base $-15 | +0.5pp $-74 | +1.0pp $-135 |
UW: 25.0% down · 7.5% · 30yr · 1.5% tax · 5.0% vac · 8.0% maint · 8.0% mgmt
Financing live
Cash to close
- Down payment
- $57,475
- Closing costs
- $6,897
- Reserves months
- —
- Total cash needed
- —
Loan-product check · same deal, 3 products live
Conventional
25% down · 7.5% · 30yr
- Down + closing
- —
- Monthly P&I
- —
- Monthly cashflow
- —
- DSCR
- —
- Eligible?
- —
Personal DTI + credit; lowest rate.
DSCR
20% down · 8.5% · 30yr
- Down + closing
- —
- Monthly P&I
- —
- Monthly cashflow
- —
- DSCR
- —
- Eligible?
- —
No personal income docs; deal must DSCR.
Hard money
10% down · 12.0% · 12mo
- Down + closing
- —
- Monthly P&I
- —
- Monthly cashflow
- —
- DSCR
- —
- Eligible?
- —
Short-term bridge; refi at stabilization.
Rent comps 26 comps
| Address | Beds | Baths | Sqft | Rent | $/sqft | DOM | Units | Dist |
|---|---|---|---|---|---|---|---|---|
| 3824 Brookfield Dr Valdosta, GA | 3.0 | 2.0 | 1517 | $2,000 | $1.32 | 23d | 1 | 0.20mi |
| 3919 Stratford Cir Valdosta, GA | 4.0 | 2.0 | 2024 | $1,900 | $0.94 | 45d | 1 | 0.27mi |
| 4125 Barrington Dr Valdosta, GA | 3.0 | 2.0 | 1212 | $1,500 | $1.24 | 45d | 1 | 0.51mi |
| 4032 Case Pt Valdosta, GA | 4.0 | 2.0 | 1664 | $2,050 | $1.23 | 23d | 1 | 0.58mi |
| 3905 Greenridge Rd Valdosta, GA | 3.0 | 2.0 | 1398 | $1,400 | $1.00 | 45d | 1 | 0.60mi |
| 3925 Glen Laurel Dr S Valdosta, GA | 3.0 | 2.0 | 1510 | $1,850 | $1.23 | 23d | 1 | 0.61mi |
| 3908 Countess Ct Valdosta, GA | 4.0 | 2.0 | 1917 | $2,250 | $1.17 | 45d | 1 | 0.62mi |
| 6412 Abney Ct Valdosta, GA | 3.0 | 2.5 | 1459 | $1,500 | $1.03 | 23d | 1 | 0.63mi |
| 6416 Abney Ct Valdosta, GA | 3.0 | 2.5 | 1459 | $1,500 | $1.03 | 45d | 1 | 0.63mi |
| 3875 Trotters Ridge Cir Valdosta, GA | 3.0 | 2.0 | 1292 | $1,700 | $1.32 | 23d | 1 | 0.68mi |
| 3964 Crusader Ct Valdosta, GA | 4.0 | 2.0 | 1851 | $2,400 | $1.30 | 23d | 1 | 0.68mi |
| 3912 Duke Ct Valdosta, GA | 4.0 | 2.0 | 1850 | $2,000 | $1.08 | 23d | 1 | 0.71mi |
| 3844 Coventry Dr Valdosta, GA | 4.0 | 2.0 | 1765 | $1,950 | $1.10 | 23d | 1 | 0.71mi |
| 3911 Nicole Ln Valdosta, GA | 3.0 | 2.0 | 1294 | $1,700 | $1.31 | 23d | 1 | 0.73mi |
| 6043 Bemiss Towns Dr Bemiss, GA | 3.0 | 2.5 | 1498 | $1,675 | $1.12 | 23d | 1 | 0.75mi |
| 4001 Conway Cir Valdosta, GA | 3.0 | 2.0 | 1797 | $2,000 | $1.11 | 23d | 1 | 0.89mi |
| 4051 Gramercy Dr Valdosta, GA | 4.0 | 2.5 | 1771 | $2,300 | $1.30 | 23d | 1 | 0.91mi |
| 3905 Heatherwoods Dr Valdosta, GA | 3.0 | 2.0 | 1250 | $1,350 | $1.08 | 23d | 1 | 0.93mi |
| 6042 Bemiss Towns Dr Valdosta, GA | 3.0 | 2.0 | 1537 | $1,700 | $1.11 | 23d | 1 | 0.96mi |
| 6023 Bemiss Towns Dr Valdosta, GA | 3.0 | 2.5 | 1498 | $1,550 | $1.03 | 23d | 1 | 0.96mi |
| 4184 Hamilton Cir Valdosta, GA | 3.0 | 2.0 | 1213 | $1,300 | $1.07 | 23d | 1 | 1.04mi |
| 5026 Pearl Davis Rd Valdosta, GA | 3.0 | 2.0 | 1207 | $1,200 | $0.99 | 23d | 1 | 1.12mi |
| 4007 Foxridge Ln Valdosta, GA | 4.0 | 2.0 | 1450 | $1,750 | $1.21 | 23d | 1 | 1.19mi |
| 4141 Pebble Creek Dr Valdosta, GA | 3.0 | 2.0 | 1189 | $1,295 | $1.09 | 23d | 1 | 1.41mi |
| 4120 Clay Dr Valdosta, GA | 4.0 | 2.0 | 1806 | $2,000 | $1.11 | 23d | 1 | 1.43mi |
| 5124 Northridge Rd S Valdosta, GA | 3.0 | 2.0 | 1454 | $1,700 | $1.17 | 23d | 1 | 1.46mi |
Listing history 35 events
-
2026-06-21days on market $229,900 Active 249 DOM
-
2026-06-19days on market $229,900 Active 247 DOM
-
2026-06-18days on market $229,900 Active 246 DOM
-
2026-06-17days on market $229,900 Active 245 DOM
-
2026-06-16days on market $229,900 Active 244 DOM
-
2026-06-15days on market $229,900 Active 243 DOM
-
2026-06-14days on market $229,900 Active 241 DOM
-
2026-06-13days on market $229,900 Active 240 DOM
-
2026-06-10days on market $229,900 Active 238 DOM
-
2026-06-09days on market $229,900 Active 237 DOM
-
2026-06-08days on market $229,900 Active 236 DOM
-
2026-06-07days on market $229,900 Active 235 DOM
-
2026-06-05days on market $229,900 Active 232 DOM
-
2026-06-03days on market $229,900 Active 231 DOM
-
2026-06-02days on market $229,900 Active 230 DOM
-
2026-06-01days on market $229,900 Active 229 DOM
-
2026-05-31days on market $229,900 Active 228 DOM
-
2026-05-30days on market $229,900 Active 227 DOM
-
2026-04-16status Active 614-char remark
Show marketing remark (614 chars)
Welcome to this charming 3-bedroom, 2-bath home featuring vaulted ceilings and beautiful updates throughout. The kitchen showcases gorgeous granite countertops and modern finishes, while shiplap accents and LVP flooring in the common areas add a warm, stylish touch. A spacious 11x13 bonus room offers endless possibilities — perfect for an office, playroom, or guest space. Enjoy outdoor living in the large fenced backyard with an extended poured patio, ideal for entertaining. With a newer metal roof and a convenient location close to Moody AFB, SGMC, and local amenities, this home has so much to offer!
-
2026-04-16historical 614-char remark
Show marketing remark (614 chars)
Welcome to this charming 3-bedroom, 2-bath home featuring vaulted ceilings and beautiful updates throughout. The kitchen showcases gorgeous granite countertops and modern finishes, while shiplap accents and LVP flooring in the common areas add a warm, stylish touch. A spacious 11x13 bonus room offers endless possibilities — perfect for an office, playroom, or guest space. Enjoy outdoor living in the large fenced backyard with an extended poured patio, ideal for entertaining. With a newer metal roof and a convenient location close to Moody AFB, SGMC, and local amenities, this home has so much to offer!
-
2025-11-18historical
-
2025-10-15$239,900 Active 614-char remark
Show marketing remark (614 chars)
Welcome to this charming 3-bedroom, 2-bath home featuring vaulted ceilings and beautiful updates throughout. The kitchen showcases gorgeous granite countertops and modern finishes, while shiplap accents and LVP flooring in the common areas add a warm, stylish touch. A spacious 11x13 bonus room offers endless possibilities — perfect for an office, playroom, or guest space. Enjoy outdoor living in the large fenced backyard with an extended poured patio, ideal for entertaining. With a newer metal roof and a convenient location close to Moody AFB, SGMC, and local amenities, this home has so much to offer!
-
2025-08-04price $249,900
-
2025-08-04price $249,900
-
2025-07-03$265,000 New
-
2023-01-30soldstatus $209,000
-
2022-12-02$209,900
-
2019-02-19soldstatus $139,900
-
2019-02-11soldstatus $139,900
-
2018-12-17$139,900
-
2004-10-18soldstatus $114,900
-
2004-07-14soldstatus $87,300
-
1997-05-30soldstatus $89,000
-
1994-03-25soldstatus $79,000
-
1994-03-25soldstatus $79,000
ⓘ Source: listings_history table (triggers on properties + properties_extension) + one-shot
backfill from property_details.listing_events for pre-trigger history.
Tax reassessment forecast GA · Resets to sale price
- Current annual tax
- $2,147 · $179/mo
- Projected year-2 tax
- $2,147 · $179/mo
- Expected delta
- $0/yr ($0/mo · 0.0%)
ⓘ Screening estimate from a state-policy table — verify with the county assessor before closing.
Climate risk First Street
- Flood 1/10 Low FEMA zone X (unshaded) · 0% chance over 30 yrs
- Wildfire 6/10 Major
- Heat 7/10 Severe 7 d/yr ≥108°F today · 19 d/yr by 30 yrs out
- Wind 8/10 Severe 99% chance of damaging wind over 30 yrs
- Air quality 6/10 Major 12 unhealthy d/yr today · 14 by 30 yrs out
Nearby sold comps map
Loading sold comps map…
Walkable amenities ~0.75 mi
Loading nearby amenities…
Taxation est. · year 1
- Rental income
- $22,261
- − Mortgage interest
- −$12,878
- − Property taxes
- −$2,147
- − Insurance
- −$1,150
- − Repairs & maintenance
- −$1,781
- − Management
- −$1,781
- − Depreciation
- −$6,688
- Taxable loss
- −$4,163
- Est. tax savings @ 24.0%
- +$999
- After-tax cash flow
- $821/yr
For passive investors: Depreciation is non-cash, so a rental often shows a tax loss while cash-flowing — sheltering income. Rental losses are passive: they offset passive income freely, and up to $25,000/yr can offset ordinary (W-2) income if you actively participate and your MAGI is under $100k (phasing out to $0 by $150k); unused losses carry forward. On sale, claimed depreciation is recaptured at up to 25%, and gains may owe capital-gains tax (a 1031 exchange can defer both). Figures are a year-1 estimate at your 24.0% rate — not tax advice; consult a CPA.
Schools (NCES district)
- District
- Lowndes County
- NCES district ID
- 1303390
- Math proficiency
- 59% ▼ -1.00%
- Reading proficiency
- 52% ▼ -2.00%
- Median HH income
- $48,221
- Composite
- 47.21/100
- National rank
- #2317
- State rank
- #8 of 174 in GA
Livability — Bemiss
No livability data for this city. (Only ~50 U.S. cities are tracked.)
Census & demographics
- Census place
- Bemiss, GA
- County
- Lowndes County · 107,801 people
- City population
- 24,280
- Metro
- Valdosta, GA
- Population (ZIP)
- 24,829
- Household income
- $79,156
- Rent vs Own
- Severe rent burden
- 642.0
Population outlook (Lowndes County) Hauer SSP2
- Today (2025)
- 120,348 people
- By 2030
- 123,469 · +2.6%
- By 2040
- 128,482 · +6.8%
- By 2050
- 131,907 · +9.6%
- By 2075
- 139,080 · +15.6%
- By 2100
- 133,649 · +11.1%
Race, ethnicity, and origin ACS 2023
- Neighborhood character
- Diverse neighborhood (Simpson 0.58)
- Race & ethnicity
- White 58% Black 27% Two or more races 7% Hispanic / Latino 7% Asian 2%
- Hispanic origin (detail)
- Mexican 3% Puerto Rican 3%
- Common ancestry
- Italian 2% Slovak 2% Lithuanian 2%
- Foreign-born
- 4% · Canada, South Korea, Vietnam
- Languages at home
- 93% English-only · Spanish 3% German/W. Germanic 1%
Political lean MEDSL · Lowndes
- 2024 margin
- R (+18.0) · D 40.8% · R 58.8%
- 2008→2024 swing
- -8.6pp toward R · 2008: -9.4pp · 2024: -18.0pp
- All cycles
- 2024: R+18.0 2020: R+12.0 2016: R+18.2 2012: R+10.5 2008: R+9.4
Not yet ingested
- Civics
- —
Market trends
- HPI YoY
- ▼ -24.74%
- Current HPI
- 189.8471
- Rent YoY
- ▲ 5.07%
- Metro
- Valdosta, GA
- State GDP YoY
- ▲ 2.66%
- F500 in state
- 28
Industry mix (Fortune 500 HQ in GA)
| Industry | F500 HQs | Revenue |
|---|---|---|
| Paper / Packaging | 2 | $29B |
|
||
| Retail | 1 | $160B |
|
||
| Transportation / Logistics | 1 | $91B |
|
||
| Airlines | 1 | $62B |
|
||
| Consumer Goods | 1 | $47B |
|
||
| Utilities | 1 | $25B |
|
||
Price history
+203.7% since first listed17 events — show timeline
- 2026-04-16 Relisted — SGMLS
- 2026-04-16 Delisted — SGMLS
- 2025-11-18 Listing Removed — GAMLS
- 2025-10-15 Listed $239,900 SGMLS
- 2025-08-04 Price Changed $249,900 SGMLS
- 2025-08-04 Price Changed $249,900 GAMLS
- 2025-07-03 Listed $265,000 GAMLS
- 2023-01-30 Sold (MLS) $209,000 SGMLS
- 2022-12-02 Listed $209,900 SGMLS
- 2019-02-19 Sold (Public Records) $139,900 Public Records
- 2019-02-11 Sold (MLS) $139,900 SGMLS
- 2018-12-17 Listed $139,900 SGMLS
- 2004-10-18 Sold (Public Records) $114,900 Public Records
- 2004-07-14 Sold (Public Records) $87,300 Public Records
- 1997-05-30 Sold (Public Records) $89,000 Public Records
- 1994-03-25 Sold (Public Records) $79,000 Public Records
- 1994-03-25 Sold (Public Records) $79,000 Public Records
Property tax history
+4.5%/yrLatest (2025): $2,147 · +8.0% YoY. Source: county tax records.
Cash-flow waterfall
monthlySold comps — $/sqft
last 12 mo · ≤1 miLoading sold comps…