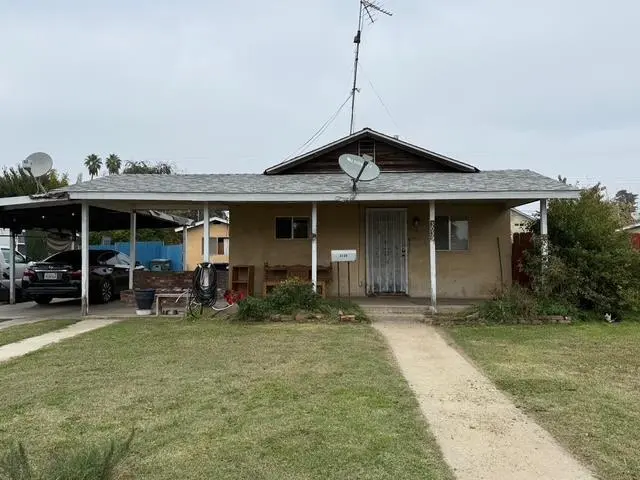
3039 E Hedges Ave · Fresno, CA
Flood risk 6/10 · Moderate
- FEMA flood zone
- X (unshaded)
- Chance of flooding over 30 yrs
- 0.52%
- Est. flood insurance / yr
- $507 – $1,088
Fire risk 1/10 · Minimal
- Est. fire insurance / yr
- $659 – $1,223
Heat risk 8/10 · Major
- Hot days now (above 105°F)
- 7 days/yr
- Hot days in 30 yrs
- 17 days/yr
Wind risk 1/10 · Minimal
- Chance of severe wind over 30 yrs
- —
Air-quality risk 10/10 · Severe
- Unhealthy air days now
- 48 days/yr
- Unhealthy air days in 30 yrs
- 50 days/yr
Risk factors via First Street. Map © Google.
Why this score? — see what drove the D grade
The composite is a weighted blend of 9 inputs, each scored 0–100. Each bar is that input's sub-score; the figure is the points it added to the 100-point composite (weight × sub-score).
- ARV discount +14.9/15.0
- Cash flow +9.7/30.0
- Rent growth +4.5/5.0
- Livability +3.1/5.0
- DSCR +2.7/10.0
- Schools +2.7/10.0
- Condition / age +2.5/5.0
- 1% rule +1.6/10.0
- Appreciation +0.0/10.0
$250,000
🖨 Deal sheet 📄 Offer letter ✓ Due diligence
Listing remarks MLS
Charming vintage home on a Double-Sized Lot! This versatile home sits on rare lot with room to add an ADU, tiny home, shop or pool. An isolated master bedroom/bathroom offers flexibility for multigenerational living or rental potential. Recent upgrades include new carpet, fresh interior paint, completed drywall, and a newly installed industrial-size water heater. A great opportunity to build equity and maximize potential.
Key facts
- Rental potential
- Double-sized lot
- New carpet
Tags
Neighborhood map
What this means for you Summary
Snapshot
- This is a 3-bed/1.0-bath single-family listed at $250k.
Deal economics
- At list price, monthly cash flow is $-166 ($-2k/yr) — negative.
- To cash-flow at today's rent, offer at most $221k (11.7% below list).
- To meet the 1% rule (rent ≥ 1% of price), the offer needs to be $164k (34.4% below list).
- Recommended offer: $164k (34.4% below list) — sets the bar for 1% rule.
- Cap rate 5.5% vs local median 3.7% in Fresno — top-decile yield for the area; either an underpriced asset or a hidden risk that comps aren't pricing in. Stress-test before assuming the spread holds.
Location & tenants
- Location reads 62/100 on livability (#469 in CA) — a middle-class / working-renter tenant base. Strengths: commute A+, housing A+; Watch: amenities D+, employment D+, schools D.
- Fresno Unified (urban): math 18% / reading 47% proficiency, ranked #327 of 517 in CA (top 63%) — families likely to look elsewhere, expect single-tenant / working-renter base with shorter leases; 77% free/reduced lunch — lower-income household profile, screen leases tightly.
- Market conditions: Rents rising fast (+7.8%/yr); 69 active listings in the ZIP; 17 comparable units currently listed for rent nearby; rentals lingering (median 44d on market — plan ~5-8 weeks vacancy on turnover, expect pricing pressure); 59% of comp listings sitting > 30 days — soft ceiling on asking rent; 2,426 units permitted in Fresno County in 2024 (296 in 5+ unit buildings).
- This rent runs 40% of the median local income ($49k/yr) — at the standard rent-burdened threshold; future hikes will face affordability resistance.
Forward outlook
- Local home prices are declining (-3.0%/yr); year-one equity from $2k of loan paydown is wiped out by about $8k of value loss. Plan a longer hold.
- Fresno County population projected at +11% by 2050 — modest demand growth; plan on rents tracking national, not racing it.
Negotiation context
- It's been on market 70 days — a 6% lower offer ($235k) is reasonable based on typical stale-listing flexibility.
Risks & watch-outs
- Watch-outs: built in 1933 — expect roof / HVAC / electrical / plumbing capex.
- Climate carrying-cost: major flood risk; extreme-heat days projected 7→17/yr by 2055 (HVAC capex compounding) — expect insurance premiums to compound above CPI over the hold.
Questions for the listing agent
- What do current leases actually rent for vs. the listed asking? Can we see a recent rent roll and the last 12 months of T-12 income?
- It's been on market 70 days. Have you received any prior offers? Is the seller open to a 34% concession, seller financing, or rate buy-down credit?
- Built in 1933 — when were the roof, HVAC, electrical panel, plumbing, and water heater last replaced?
- Why hasn't it sold? Are there any deal-killer items the seller is aware of (foundation, flood, title, zoning, code violations)?
- Is there a deadline driving the sale (1031 exchange, divorce, estate, relocation)? That informs how much negotiation room exists.
- Schools are D-rated, which usually means shorter tenancies and higher turnover. Who's the typical renter profile here, and what's been the actual vacancy rate?
- Crime grade is F in this area — have there been break-ins, vandalism, or insurance claims at this property in the last 3 years? What carrier currently insures it and at what premium?
- The area grade is low — what's the realistic commute time and amenity access for the typical tenant pool here? Any planned neighborhood developments (good or bad) we should know about?
- What's the average days-on-market for RENTAL listings here right now (not sales)? A rising rental-DOM trend means longer vacancies and softer asking-rent achievability than the comps imply.
- What's the recent tenant-quality profile in this submarket — average credit score on applications, eviction rate, late-payment / NSF rate, and stable-employment percentage? A property-management company in the area should have these aggregated.
- How much new for-sale + rental construction is in the pipeline within 1–3 miles? Heavy new supply typically softens prices + rents 12–24 months out; constrained supply supports both.
Investment metrics
- 1% rule
- 0.66% ✗
- Cap rate
- 5.49%
- Cash-on-cash
- -2.85%
- DSCR
- 0.87
- GRM
- 12.7
CMA / ARV
- ARV (median comp)
- $299,003
- List price
- $250,000
- Delta
- -16.39%
- Verdict
- UNDERPRICED
- Comps
- 20 within 1.0 mi
Show comp detail 12 sales within ~0.75 mi
| Address | Dist | Beds/Ba | Sqft | Sold | Price | $/sf | Match |
|---|---|---|---|---|---|---|---|
| 3284 E Pine Ave | 0.30mi | 3/1.0 | 1,328 (+8%) | 0mo | $249,900 | $188 | 72 |
| 3023 E White Ave | 0.56mi | 3/1.0 | 1,251 (+2%) | 7mo | $255,000 | $204 | 65 |
| 3404 E Home Ave | 0.40mi | 2/1.0 (-1) | 1,276 (+4%) | 8mo | $290,000 | $227 | 63 |
| 2845 Madison | 0.72mi | 3/2.0 | 1,246 (+2%) | 2mo | $291,500 | $234 | 59 |
| 2401 E Thomas Ave | 0.68mi | 3/2.0 | 1,248 (+2%) | 6mo | $280,000 | $224 | 56 |
| 3623 E Lamona | 0.54mi | 3/3.0 | 1,160 (-6%) | 3mo | $335,000 | $289 | 55 |
| 1517 N Millbrook | 0.62mi | 3/1.0 | 1,098 (-11%) | 1mo | $220,000 | $200 | 53 |
| 2340 E Clay Ave | 0.54mi | 3/1.0 | 1,068 (-13%) | 4mo | $244,000 | $228 | 50 |
| 1206 N 8th St | 0.73mi | 3/1.0 | 1,375 (+12%) | 2mo | $299,000 | $217 | 45 |
| 2112 E Hedges | 0.65mi | 3/2.0 | 1,056 (-14%) | 6mo | $319,500 | $303 | 37 |
| 2405 E White Ave | 0.73mi | 4/1.5 (+1) | 1,400 (+14%) | 5mo | $290,000 | $207 | 31 |
| 1879 Mayfair Dr E | 0.75mi | 2/2.0 (-1) | 1,066 (-13%) | 6mo | $299,000 | $280 | 29 |
Match score weights: distance 35% · size 25% · config 20% · recency 20%. Top-matched comps best support the ARV.
Projected returns pro-forma
-3.0% appreciation · 7.8% rent growth · sell at horizon
- IRR
- -16.7%
- Equity multiple
- 0.39×
- Total profit
- $-42,937
- Equity at exit
- $37,276
- IRR
- -2.5%
- Equity multiple
- 0.80×
- Total profit
- $-13,965
- Equity at exit
- $21,615
Cash invested: $70,000 (down + closing). Projections, not guarantees.
Landlord ↔ Tenant lean methodology
- Overall (STATE)
- 18 Strongly Tenant-Friendly
- State California
- 18 Strongly Tenant-Friendly · D+13
- County
- — inherits STATE
- City
- — inherits STATE
ZIP-level market 93703
- Rents YoY
- 7.8%
- Active inventory
- 69
- Price-to-rent
- 12.7×
Monthly cashflow live
- Estimated rent
- $1,639 high interval (Pro) →
- Mortgage (P&I)
- −$1,311
- Tax from tax record
- −$46 /mo · $555/yr
- Insurance
- −$104
- HOA
- −$0
- Vacancy / Maint / Mgmt
- −$344
- Net cashflow
- $-166
Break-even live
UW: 25.0% down · 7.5% · 30yr · 1.5% tax · 5.0% vac · 8.0% maint · 8.0% mgmt
Financing live
Cash to close
- Down payment
- $62,500
- Closing costs
- $7,500
- Reserves months
- —
- Total cash needed
- —
Loan-product check · same deal, 3 products live
Conventional
25% down · 7.5% · 30yr
- Down + closing
- —
- Monthly P&I
- —
- Monthly cashflow
- —
- DSCR
- —
- Eligible?
- —
Personal DTI + credit; lowest rate.
DSCR
20% down · 8.5% · 30yr
- Down + closing
- —
- Monthly P&I
- —
- Monthly cashflow
- —
- DSCR
- —
- Eligible?
- —
No personal income docs; deal must DSCR.
Hard money
10% down · 12.0% · 12mo
- Down + closing
- —
- Monthly P&I
- —
- Monthly cashflow
- —
- DSCR
- —
- Eligible?
- —
Short-term bridge; refi at stabilization.
Rent comps 17 comps
| Address | Beds | Baths | Sqft | Rent | $/sqft | DOM | Units | Dist |
|---|---|---|---|---|---|---|---|---|
| 3254 E Olive Ave Apt D Fresno, CA | 2.0 | 1.0 | 750 | $1,300 | $1.73 | 21d | 1 | 0.28mi |
| 3049 E McKinley Ave Fresno, CA | 3.0 | 2.0 | 1276 | $2,100 | $1.65 | 14d | 1 | 0.36mi |
| 2355 E Olive Ave Fresno, CA | 3.0 | 2.0 | 1265 | $2,250 | $1.78 | 23d | 1 | 0.49mi |
| 1619 N 6th St Unit **21 6th-880 Fresno, CA | 2.0 | 1.0 | 950 | $1,325 | $1.39 | 43d | 1 | 0.64mi |
| 2044 Mayfair Dr W Unit Advertising Fresno, CA | 2.0 | 1.0 | 872 | $1,495 | $1.71 | 43d | 1 | 0.68mi |
| 2103 N Angus St Unit 2139-C Fresno, CA | 2.0 | 1.0 | 875 | $1,300 | $1.49 | 43d | 1 | 0.68mi |
| 2132 N First St Fresno, CA | 2.0 | 1.0 | 877 | $1,200 | $1.37 | 43d | 1 | 0.70mi |
| 2674 E Clinton Ave Fresno, CA | 1.0–4.0 | 1.0–3.0 | 943 | $1,018 | $1.08 | 43d | 1 | 0.87mi |
| 2056 E White Ave Apt B Fresno, CA | 2.0 | 1.0 | 1050 | $1,250 | $1.19 | 43d | 1 | 0.89mi |
| 2995 E Nevada Ave Apt D Fresno, CA | 2.0 | 1.0 | 850 | $1,150 | $1.35 | 43d | 1 | 0.95mi |
| 1321 N Calaveras St Fresno, CA | 3.0 | 2.0 | 1300 | $2,200 | $1.69 | 3d | 1 | 1.03mi |
| 1532 N Calaveras St Fresno, CA | 2.0 | 2.0 | 848 | $1,800 | $2.12 | 21d | 1 | 1.03mi |
| 1620 E Yale Ave Apt 202 Fresno, CA | 2.0 | 1.0 | 825 | $1,495 | $1.81 | 43d | 1 | 1.19mi |
| 3033 E Platt Ave Fresno, CA | 2.0 | 1.0 | 975 | $1,016 | $1.04 | 1d | 1 | 1.24mi |
| 1230 N College Ave Unit 1232 Fresno, CA | 2.0 | 1.0 | 950 | $1,500 | $1.58 | 11d | 1 | 1.31mi |
| 960 N Van Ness Ave Fresno, CA | 3.0 | 1.0 | 900 | $1,350 | $1.50 | 43d | 1 | 1.41mi |
| 4530 E Thomas Ave Apt 202 Fresno, CA | 2.0 | 1.0 | 950 | $1,250 | $1.32 | 43d | 1 | 1.50mi |
Listing history 16 events
-
2026-06-13statusdays on market $250,000 Pending 70 DOM
-
2026-06-10days on market $250,000 Active 68 DOM
-
2026-06-09days on market $250,000 Active 67 DOM
-
2026-06-08days on market $250,000 Active 66 DOM
-
2026-06-07days on market $250,000 Active 65 DOM
-
2026-06-05days on market $250,000 Active 62 DOM
-
2026-06-03days on market $250,000 Active 61 DOM
-
2026-06-02days on market $250,000 Active 60 DOM
-
2026-06-02status $250,000 Active 59 DOM
-
2026-06-01days on market $250,000 Pending Accepting Backups 59 DOM
-
2026-05-31days on market $250,000 Pending Accepting Backups 58 DOM
-
2026-05-06historical Pending Accepting Backups 425-char remark
Show marketing remark (425 chars)
Charming vintage home on a Double-Sized Lot! This versatile home sits on rare lot with room to add an ADU, tiny home, shop or pool. An isolated master bedroom/bathroom offers flexibility for multigenerational living or rental potential. Recent upgrades include new carpet, fresh interior paint, completed drywall, and a newly installed industrial-size water heater. A great opportunity to build equity and maximize potential.
-
2026-04-15price $250,000 425-char remark
Show marketing remark (425 chars)
Charming vintage home on a Double-Sized Lot! This versatile home sits on rare lot with room to add an ADU, tiny home, shop or pool. An isolated master bedroom/bathroom offers flexibility for multigenerational living or rental potential. Recent upgrades include new carpet, fresh interior paint, completed drywall, and a newly installed industrial-size water heater. A great opportunity to build equity and maximize potential.
-
2026-04-03$254,000 Active 425-char remark
Show marketing remark (425 chars)
Charming vintage home on a Double-Sized Lot! This versatile home sits on rare lot with room to add an ADU, tiny home, shop or pool. An isolated master bedroom/bathroom offers flexibility for multigenerational living or rental potential. Recent upgrades include new carpet, fresh interior paint, completed drywall, and a newly installed industrial-size water heater. A great opportunity to build equity and maximize potential.
-
2026-03-19price $254,000
-
2026-01-08price $255,000
ⓘ Source: listings_history table (triggers on properties + properties_extension) + one-shot
backfill from property_details.listing_events for pre-trigger history.
Tax reassessment forecast CA · Resets to sale price
- Current annual tax
- $555 · $46/mo
- Projected year-2 tax
- $1,900 · $158/mo
- Expected delta
- +$1,345/yr (+$112/mo · 242.3%)
ⓘ Screening estimate from a state-policy table — verify with the county assessor before closing.
Climate risk First Street
- Flood 6/10 Major FEMA zone X (unshaded) · 52% chance over 30 yrs
- Wildfire 1/10 Low
- Heat 8/10 Severe 7 d/yr ≥105°F today · 17 d/yr by 30 yrs out
- Wind 1/10 Low
- Air quality 10/10 Extreme 48 unhealthy d/yr today · 50 by 30 yrs out
Nearby sold comps map
Loading sold comps map…
Walkable amenities ~0.75 mi
Loading nearby amenities…
Taxation est. · year 1
- Rental income
- $19,674
- − Mortgage interest
- −$14,004
- − Property taxes
- −$555
- − Insurance
- −$1,250
- − Repairs & maintenance
- −$1,574
- − Management
- −$1,574
- − Depreciation
- −$7,273
- Taxable loss
- −$6,556
- Est. tax savings @ 24.0%
- +$1,573
- After-tax cash flow
- $-422/yr
For passive investors: Depreciation is non-cash, so a rental often shows a tax loss while cash-flowing — sheltering income. Rental losses are passive: they offset passive income freely, and up to $25,000/yr can offset ordinary (W-2) income if you actively participate and your MAGI is under $100k (phasing out to $0 by $150k); unused losses carry forward. On sale, claimed depreciation is recaptured at up to 25%, and gains may owe capital-gains tax (a 1031 exchange can defer both). Figures are a year-1 estimate at your 24.0% rate — not tax advice; consult a CPA.
Schools (NCES district)
- District
- Fresno Unified
- NCES district ID
- 0614550
- Math proficiency
- 18% ▼ -12.00%
- Reading proficiency
- 47% ▲ 9.00%
- Median HH income
- $36,095
- Composite
- 26.83/100
- National rank
- #7111
- State rank
- #327 of 517 in CA
Livability — Fresno
- Score
- 62/100
- State rank
- #469
- US rank
- #15907
Category grades
Schools grade is shown separately in the Schools card above.
Census & demographics
- Census place
- Fresno, CA
- County
- Fresno County · 834,801 people
- City population
- 593,114
- Metro
- Fresno, CA
- Population (ZIP)
- 33,420
- Household income
- $48,737
- Rent vs Own
- Severe rent burden
- 2076.0
Population outlook (Fresno County) Hauer SSP2
- Today (2025)
- 1,042,971 people
- By 2030
- 1,072,198 · +2.8%
- By 2040
- 1,122,408 · +7.6%
- By 2050
- 1,157,251 · +11.0%
- By 2075
- 1,182,575 · +13.4%
- By 2100
- 1,105,899 · +6.0%
Race, ethnicity, and origin ACS 2023
- Neighborhood character
- Diverse neighborhood (Simpson 0.56)
- Race & ethnicity
- Hispanic / Latino 63% Two or more races 26% Asian 14% White 12% Black 8% Native American 1%
- Hispanic origin (detail)
- Mexican 60%
- Foreign-born
- 21% · Canada, Vietnam
- Languages at home
- 47% English-only · Spanish 41% Other Asian/Pacific 9% Other Indo-European 1%
Political lean MEDSL · Fresno
- 2024 margin
- Toss-up / Even · D 46.5% · R 50.9% · Other 2.6%
- 2008→2024 swing
- -6.5pp toward R · 2008: 2.1pp · 2024: -4.4pp
- All cycles
- 2024: R+4.4 2020: D+7.8 2016: D+3.9 2012: R+2.9 2008: D+2.1
Not yet ingested
- Civics
- —
Market trends
- HPI YoY
- ▼ -274.09%
- Current HPI
- 413.4753
- Rent YoY
- ▲ 7.80%
- Metro
- Fresno, CA
- State GDP YoY
- ▲ 3.21%
- F500 in state
- 116
Industry mix (Fortune 500 HQ in CA)
| Industry | F500 HQs | Revenue |
|---|---|---|
| Technology | 27 | $1,492B |
|
||
| Financial Services | 3 | $174B |
|
||
| Retail | 3 | $44B |
|
||
| Insurance | 3 | $26B |
|
||
| Media / Entertainment | 2 | $115B |
|
||
| Pharmaceuticals / Biotech | 2 | $62B |
|
||
Price history
-2.0% since first listed5 events — show timeline
- 2026-05-06 Contingent — FRESNOMLS
- 2026-04-15 Price Changed $250,000 FRESNOMLS
- 2026-04-03 Listed $254,000 FRESNOMLS
- 2026-03-19 Price Changed $254,000 FRESNOMLS
- 2026-01-08 Price Changed $255,000 FRESNOMLS
Property tax history
+2.6%/yrLatest (2025): $555 · +4.1% YoY. Source: county tax records.
Cash-flow waterfall
monthlySold comps — $/sqft
last 12 mo · ≤1 miLoading sold comps…