275 S Worthington St #105 · La Presa, CA
Flood risk 1/10 · Minimal
- FEMA flood zone
- X (unshaded)
- Chance of flooding over 30 yrs
- 0.0%
- Est. flood insurance / yr
- $507 – $1,088
Fire risk 3/10 · Minor
- Est. fire insurance / yr
- $659 – $1,223
Heat risk 5/10 · Moderate
- Hot days now (above 89°F)
- 5 days/yr
- Hot days in 30 yrs
- 13 days/yr
Wind risk 1/10 · Minimal
- Chance of severe wind over 30 yrs
- —
Air-quality risk 3/10 · Minor
- Unhealthy air days now
- 3 days/yr
- Unhealthy air days in 30 yrs
- 3 days/yr
Risk factors via First Street. Map © Google.
Why this score? — see what drove the B grade
The composite is a weighted blend of 9 inputs, each scored 0–100. Each bar is that input's sub-score; the figure is the points it added to the 100-point composite (weight × sub-score).
- Cash flow +30.0/30.0
- ARV discount +13.7/15.0
- 1% rule +10.0/10.0
- DSCR +10.0/10.0
- Livability +3.0/5.0
- Rent growth +2.7/5.0
- Condition / age +2.5/5.0
- Schools +2.2/10.0
- Appreciation +0.0/10.0
$169,900
🖨 Deal sheet 📄 Offer letter ✓ Due diligence
Listing remarks MLS
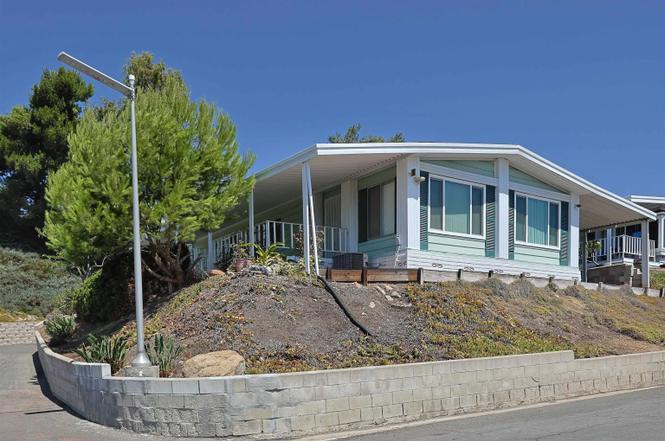
In the most desirable Mobile Home Park in Spring Valley-Bonita area. Price to sell, this 1440 sqft located on top of the Hill, Corner lot, with unobstructed ocean views, offers 2 bedrooms 2 full bath, extended porch, living and dining area, family room. New sliding Dual pane door. New carpet in bedrooms. it is a must see. The park offers community pool, spa, club house.
Key facts
- Distant ocean views
- Prime corner lot
- 2 parking spots
Tags
Property features AI
Finance
- HOA & community: Senior community; Community pool
Exterior
- Parking: 2 parking spaces
- Utilities: Public water; Sewer connected
- Home design: Mobile home; Single-story
- Construction: Aluminum siding
- Exterior features: Lot in Spring Valley subdivision; Zoned residential
Interior
- Bedrooms: Up to 2 bedrooms possible
- Bathrooms: 2 full bathrooms
- Heating & cooling: Central air conditioning
- Interior features: Community pool; Has a view; Breed restrictions for pets; Located in a senior community; Building named Bonita Hills Estates
Neighborhood map
What this means for you Summary
Snapshot
- This is a 2-bed/2.0-bath manufactured listed at $170k.
Deal economics
- At list price, monthly cash flow is $1k ($16k/yr) — positive.
- The deal already cash-flows at list — no discount required.
- Meets the 1% rule at list price ($3k rent vs $170k).
- Recommended offer: $150k (12.0% below list) — sets the bar for market timing.
- Cap rate 15.5% vs local median 3.0% in La Presa — top-decile yield for the area; either an underpriced asset or a hidden risk that comps aren't pricing in. Stress-test before assuming the spread holds.
Location & tenants
- Location reads 60/100 on livability (#571 in CA) — a middle-class / working-renter tenant base. Strengths: commute A+, employment B, housing B; Watch: schools D+, health & safety D, crime F.
- San Diego Unified (urban): math 19% / reading 29% proficiency, ranked #393 of 517 in CA (top 76%) — low school quality limits family demand, transient renter base, plan for 1-2y turnover.
- Market conditions: Rents flat; 158 active listings in the ZIP; 15 comparable units currently listed for rent nearby; rentals leasing fast (median 8d on market — plan ~1-2 weeks tenant-placement turnaround); solid renter incomes; 11,759 units permitted in San Diego County in 2024 (7,244 in 5+ unit buildings).
- This rent runs 38% of the median local income ($100k/yr) — at the standard rent-burdened threshold; future hikes will face affordability resistance.
Forward outlook
- Local home prices are declining (-3.0%/yr); year-one equity from $1k of loan paydown is wiped out by about $5k of value loss. Plan a longer hold.
- San Diego County population projected at +20% by 2050 — long-run rental-demand tailwind backs the buy-and-hold thesis.
- At projected returns (-3.0% appreciation + 0.9% rent growth), your $48k cash investment doubles in ~4 years — after that, you're playing with house money.
Negotiation context
- It's been on market 278 days — a 12% lower offer ($150k) is reasonable based on typical stale-listing flexibility.
- 4 sale attempts since 3y ago; this cycle's ask has dropped $25k (13%) from the opening price — seller is motivated, your offer sets the floor, not the list.
Risks & watch-outs
- Climate carrying-cost: extreme-heat days projected 5→13/yr by 2055 (HVAC capex compounding) — expect insurance premiums to compound above CPI over the hold.
Questions for the listing agent
- It's been on market 278 days. Have you received any prior offers? Is the seller open to a 12% concession, seller financing, or rate buy-down credit?
- Built in 1977 — when were the roof, HVAC, electrical panel, plumbing, and water heater last replaced?
- Why hasn't it sold? Are there any deal-killer items the seller is aware of (foundation, flood, title, zoning, code violations)?
- Is there a deadline driving the sale (1031 exchange, divorce, estate, relocation)? That informs how much negotiation room exists.
- Schools are D-rated, which usually means shorter tenancies and higher turnover. Who's the typical renter profile here, and what's been the actual vacancy rate?
- Crime grade is F in this area — have there been break-ins, vandalism, or insurance claims at this property in the last 3 years? What carrier currently insures it and at what premium?
- What's the average days-on-market for RENTAL listings here right now (not sales)? A rising rental-DOM trend means longer vacancies and softer asking-rent achievability than the comps imply.
- What's the recent tenant-quality profile in this submarket — average credit score on applications, eviction rate, late-payment / NSF rate, and stable-employment percentage? A property-management company in the area should have these aggregated.
- How much new for-sale + rental construction is in the pipeline within 1–3 miles? Heavy new supply typically softens prices + rents 12–24 months out; constrained supply supports both.
Investment metrics
- 1% rule
- 1.84% ✓
- Cap rate
- 15.47%
- Cash-on-cash
- 32.77%
- DSCR
- 2.46
- GRM
- 4.5
CMA / ARV
- ARV (on-the-fly)
- $197,280
- Comps found
- 4
Show comp detail 4 sales within ~0.75 mi
| Address | Dist | Beds/Ba | Sqft | Sold | Price | $/sf | Match |
|---|---|---|---|---|---|---|---|
| 275 S Worthington St #46 | 0.13mi | 2/2.0 | 1,440 (0%) | 7mo | $260,000 | $181 | 88 |
| 275 S Worthington St #125 | 0.00mi | 2/2.0 | 1,488 (+3%) | 17mo | $169,999 | $114 | 81 |
| 275 S Worthington St #107 | 0.00mi | 2/2.0 | 1,584 (+10%) | 11mo | $204,900 | $129 | 74 |
| 275 S WORTHINGTON St #60 | 0.00mi | 2/2.0 | 1,536 (+7%) | 20mo | $210,000 | $137 | 72 |
Match score weights: distance 35% · size 25% · config 20% · recency 20%. Top-matched comps best support the ARV.
Projected returns pro-forma
-3.0% appreciation · 0.88% rent growth · sell at horizon
- IRR
- 25.5%
- Equity multiple
- 2.02×
- Total profit
- $48,717
- Equity at exit
- $25,333
- IRR
- 31.9%
- Equity multiple
- 3.59×
- Total profit
- $123,438
- Equity at exit
- $14,690
Cash invested: $47,572 (down + closing). Projections, not guarantees.
Landlord ↔ Tenant lean methodology
- Overall (STATE)
- 18 Strongly Tenant-Friendly
- State California
- 18 Strongly Tenant-Friendly · D+13
- County
- — inherits STATE
- City
- — inherits STATE
ZIP-level market 91977
- Rents YoY
- 0.9%
- Active inventory
- 158
- Price-to-rent
- 4.5×
Monthly cashflow live
- Estimated rent
- $3,131 high interval (Pro) →
- Mortgage (P&I)
- −$891
- Tax est. 1.5%
- −$212 /mo · $2,548/yr
- Insurance
- −$71
- HOA
- −$0
- Vacancy / Maint / Mgmt
- −$657
- Net cashflow
- $1,299
Break-even live
UW: 25.0% down · 7.5% · 30yr · 1.5% tax · 5.0% vac · 8.0% maint · 8.0% mgmt
Financing live
Cash to close
- Down payment
- $42,475
- Closing costs
- $5,097
- Reserves months
- —
- Total cash needed
- —
Loan-product check · same deal, 3 products live
Conventional
25% down · 7.5% · 30yr
- Down + closing
- —
- Monthly P&I
- —
- Monthly cashflow
- —
- DSCR
- —
- Eligible?
- —
Personal DTI + credit; lowest rate.
DSCR
20% down · 8.5% · 30yr
- Down + closing
- —
- Monthly P&I
- —
- Monthly cashflow
- —
- DSCR
- —
- Eligible?
- —
No personal income docs; deal must DSCR.
Hard money
10% down · 12.0% · 12mo
- Down + closing
- —
- Monthly P&I
- —
- Monthly cashflow
- —
- DSCR
- —
- Eligible?
- —
Short-term bridge; refi at stabilization.
Rent comps 15 comps
| Address | Beds | Baths | Sqft | Rent | $/sqft | DOM | Units | Dist |
|---|---|---|---|---|---|---|---|---|
| 8119 Paradise Valley Ct Spring Valley, CA | 3.0 | 2.0 | 975 | $3,195 | $3.28 | 4d | 1 | 0.40mi |
| 425 S Meadowbrook Dr #133 San Diego, CA | 2.0 | 2.0 | 1228 | $3,000 | $2.44 | 16d | 1 | 0.63mi |
| 8513 Paradise Valley Rd Spring Valley, CA | 1.0–3.0 | 1.0–2.0 | 819 | $2,430 | $2.97 | 1d | 8 | 0.67mi |
| 5155 Cedarwood Rd Bonita, CA | 2.0 | 2.0 | 1024 | $2,583 | $2.52 | 1d | 4 | 0.90mi |
| 2957 Plaza Miguel Bonita, CA | 3.0 | 2.5 | 1658 | $3,595 | $2.17 | 1d | 1 | 0.98mi |
| 7291 Gatewood Ln Unit A San Diego, CA | 3.0 | 2.0 | 1470 | $3,750 | $2.55 | 24d | 1 | 1.02mi |
| 7853 Gribble St San Diego, CA | 3.0 | 2.0 | 1247 | $4,100 | $3.29 | 18d | 1 | 1.03mi |
| 752 Osage St Spring Valley, CA | 3.0 | 2.0 | 1643 | $4,200 | $2.56 | 1d | 1 | 1.06mi |
| 2368 Fulham Way San Diego, CA | 3.0 | 3.0 | 1540 | $4,100 | $2.66 | 18d | 1 | 1.11mi |
| 2165 Honey Dr San Diego, CA | 1.0–2.0 | 1.0 | 800 | $2,225 | $2.78 | 5d | 1 | 1.34mi |
| 2147 Honey Dr San Diego, CA | 1.0–2.0 | 1.0 | 800 | $4,150 | $5.19 | 13d | 1 | 1.36mi |
| 6935 Paradise Valley Rd San Diego, CA | 1.0–2.0 | 1.0–2.0 | 752 | $2,395 | $3.18 | 7d | 3 | 1.41mi |
| 7055 Appian Dr Unit B San Diego, CA | 3.0 | 2.0 | 1224 | $2,999 | $2.45 | 7d | 1 | 1.42mi |
| 6909 Alcona St San Diego, CA | 1.0–2.0 | 1.0 | 800 | $2,225 | $2.78 | 15d | 1 | 1.43mi |
| 6932 Alcona St San Diego, CA | 1.0–2.0 | 1.0 | 800 | $4,150 | $5.19 | 13d | 1 | 1.46mi |
Listing history 27 events
-
2026-06-18days on market $169,900 Active 278 DOM
-
2026-06-17days on market $169,900 Active 277 DOM
-
2026-06-16days on market $169,900 Active 276 DOM
-
2026-06-15days on market $169,900 Active 275 DOM
-
2026-06-13days on market $169,900 Active 273 DOM
-
2026-06-09days on market $169,900 Active 269 DOM
-
2026-06-08days on market $169,900 Active 268 DOM
-
2026-06-07days on market $169,900 Active 267 DOM
-
2026-06-04days on market $169,900 Active 264 DOM
-
2026-06-03days on market $169,900 Active 263 DOM
-
2026-06-01days on market $169,900 Active 261 DOM
-
2026-05-31days on market $169,900 Active 260 DOM
-
2026-05-21status Active
-
2026-05-21historical
-
2026-03-30price $169,900
-
2026-02-28price $169,900
-
2026-02-13price $185,000
-
2026-02-06status Active
-
2026-02-06price $180,000
-
2026-02-01historical
-
2025-10-17price $189,900
-
2025-09-08$195,000 Active
-
2023-06-29soldstatus $185,000 Closed Sale 372-char remark
Show marketing remark (372 chars)
In the most desirable Mobile Home Park in Spring Valley-Bonita area. Price to sell, this 1440 sqft located on top of the Hill, Corner lot, with unobstructed ocean views, offers 2 bedrooms 2 full bath, extended porch, living and dining area, family room. New sliding Dual pane door. New carpet in bedrooms. it is a must see. The park offers community pool, spa, club house.
-
2023-06-22price $185,000 372-char remark
Show marketing remark (372 chars)
In the most desirable Mobile Home Park in Spring Valley-Bonita area. Price to sell, this 1440 sqft located on top of the Hill, Corner lot, with unobstructed ocean views, offers 2 bedrooms 2 full bath, extended porch, living and dining area, family room. New sliding Dual pane door. New carpet in bedrooms. it is a must see. The park offers community pool, spa, club house.
-
2023-06-19status Pending Sale 372-char remark
Show marketing remark (372 chars)
In the most desirable Mobile Home Park in Spring Valley-Bonita area. Price to sell, this 1440 sqft located on top of the Hill, Corner lot, with unobstructed ocean views, offers 2 bedrooms 2 full bath, extended porch, living and dining area, family room. New sliding Dual pane door. New carpet in bedrooms. it is a must see. The park offers community pool, spa, club house.
-
2023-05-02price $189,900 372-char remark
Show marketing remark (372 chars)
In the most desirable Mobile Home Park in Spring Valley-Bonita area. Price to sell, this 1440 sqft located on top of the Hill, Corner lot, with unobstructed ocean views, offers 2 bedrooms 2 full bath, extended porch, living and dining area, family room. New sliding Dual pane door. New carpet in bedrooms. it is a must see. The park offers community pool, spa, club house.
-
2023-02-23$199,900 Active 372-char remark
Show marketing remark (372 chars)
In the most desirable Mobile Home Park in Spring Valley-Bonita area. Price to sell, this 1440 sqft located on top of the Hill, Corner lot, with unobstructed ocean views, offers 2 bedrooms 2 full bath, extended porch, living and dining area, family room. New sliding Dual pane door. New carpet in bedrooms. it is a must see. The park offers community pool, spa, club house.
ⓘ Source: listings_history table (triggers on properties + properties_extension) + one-shot
backfill from property_details.listing_events for pre-trigger history.
Climate risk First Street
- Flood 1/10 Low FEMA zone X (unshaded) · 0% chance over 30 yrs
- Wildfire 3/10 Moderate
- Heat 5/10 Major 5 d/yr ≥89°F today · 13 d/yr by 30 yrs out
- Wind 1/10 Low
- Air quality 3/10 Moderate 3 unhealthy d/yr today · 3 by 30 yrs out
Nearby sold comps map
Loading sold comps map…
Walkable amenities ~0.75 mi
Loading nearby amenities…
Taxation est. · year 1
- Rental income
- $37,568
- − Mortgage interest
- −$9,517
- − Property taxes
- −$2,548
- − Insurance
- −$850
- − Repairs & maintenance
- −$3,005
- − Management
- −$3,005
- − Depreciation
- −$4,943
- Taxable income
- $13,700
- Est. tax owed @ 24.0%
- −$3,288
- After-tax cash flow
- $12,301/yr
For passive investors: Depreciation is non-cash, so a rental often shows a tax loss while cash-flowing — sheltering income. Rental losses are passive: they offset passive income freely, and up to $25,000/yr can offset ordinary (W-2) income if you actively participate and your MAGI is under $100k (phasing out to $0 by $150k); unused losses carry forward. On sale, claimed depreciation is recaptured at up to 25%, and gains may owe capital-gains tax (a 1031 exchange can defer both). Figures are a year-1 estimate at your 24.0% rate — not tax advice; consult a CPA.
Schools (NCES district)
- District
- San Diego Unified
- NCES district ID
- 0634320
- Math proficiency
- 19% ▼ -29.00%
- Reading proficiency
- 29% ▼ -28.00%
- Median HH income
- $61,673
- Composite
- 22.31/100
- National rank
- #8135
- State rank
- #393 of 517 in CA
Livability — La Presa
- Score
- 60/100
- State rank
- #571
- US rank
- #18714
Category grades
Schools grade is shown separately in the Schools card above.
Census & demographics
- Census place
- La Presa, CA
- County
- San Diego County · 3,178,799 people
- City population
- 62,957
- Metro
- San Diego-Chula Vista-Carlsbad, CA
- Population (ZIP)
- 61,064
- Household income
- $99,657
- Rent vs Own
- Severe rent burden
- 2007.0
Population outlook (San Diego County) Hauer SSP2
- Today (2025)
- 3,678,185 people
- By 2030
- 3,856,546 · +4.8%
- By 2040
- 4,171,407 · +13.4%
- By 2050
- 4,421,607 · +20.2%
- By 2075
- 4,831,599 · +31.4%
- By 2100
- 4,832,502 · +31.4%
Race, ethnicity, and origin ACS 2023
- Neighborhood character
- Diverse neighborhood (Simpson 0.68)
- Race & ethnicity
- Hispanic / Latino 46% White 29% Two or more races 19% Black 12% Asian 7% Native American 1%
- Hispanic origin (detail)
- Mexican 43%
- Common ancestry
- Portuguese 2% Lithuanian 1% Italian 1%
- Foreign-born
- 19% · Canada, China, Vietnam
- Languages at home
- 59% English-only · Spanish 32% Tagalog/Filipino 3% Arabic 1%
Political lean MEDSL · San Diego
- 2024 margin
- D (+16.8) · D 56.9% · R 40.1% · Other 2.9%
- 2008→2024 swing
- +6.6pp toward D · 2008: 10.2pp · 2024: 16.8pp
- All cycles
- 2024: D+16.8 2020: D+22.8 2016: D+17.8 2012: D+5.1 2008: D+10.2
Not yet ingested
- Civics
- —
Market trends
- HPI YoY
- ▼ -697.99%
- Current HPI
- 381.66
- Rent YoY
- ▲ 0.88%
- Metro
- San Diego-Chula Vista-Carlsbad, CA
- State GDP YoY
- ▲ 3.21%
- F500 in state
- 116
Industry mix (Fortune 500 HQ in CA)
| Industry | F500 HQs | Revenue |
|---|---|---|
| Technology | 27 | $1,492B |
|
||
| Financial Services | 3 | $174B |
|
||
| Retail | 3 | $44B |
|
||
| Insurance | 3 | $26B |
|
||
| Media / Entertainment | 2 | $115B |
|
||
| Pharmaceuticals / Biotech | 2 | $62B |
|
||
Price history
-15.0% since first listed15 events — show timeline
- 2026-05-21 Relisted — SDMLS
- 2026-05-21 Listing Removed — SDMLS
- 2026-03-30 Price Changed $169,900 AVMLS
- 2026-02-28 Price Changed $169,900 SDMLS
- 2026-02-13 Price Changed $185,000 AVMLS
- 2026-02-06 Relisted — SDMLS
- 2026-02-06 Price Changed $180,000 SDMLS
- 2026-02-01 Listing Removed — SDMLS
- 2025-10-17 Price Changed $189,900 SDMLS
- 2025-09-08 Listed $195,000 SDMLS
- 2023-06-29 Sold (MLS) $185,000 CRMLS
- 2023-06-22 Price Changed $185,000 CRMLS
- 2023-06-19 Pending — CRMLS
- 2023-05-02 Price Changed $189,900 CRMLS
- 2023-02-23 Listed $199,900 CRMLS
Cash-flow waterfall
monthlySold comps — $/sqft
last 12 mo · ≤1 miLoading sold comps…