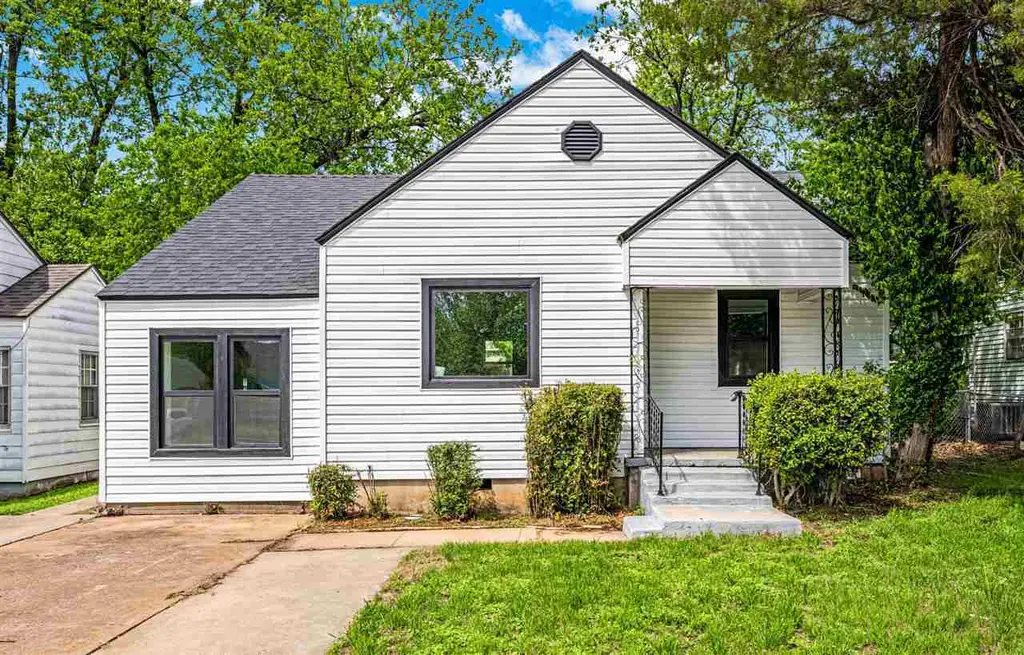
1149 NW Oak Ave · Lawton, OK
Flood risk 1/10 · Minimal
- FEMA flood zone
- X (unshaded)
- Chance of flooding over 30 yrs
- 0.0%
- Est. flood insurance / yr
- $507 – $1,088
Fire risk 3/10 · Minor
- Est. fire insurance / yr
- $2,463 – $4,575
Heat risk 7/10 · Major
- Hot days now (above 108°F)
- 7 days/yr
- Hot days in 30 yrs
- 19 days/yr
Wind risk 3/10 · Minor
- Chance of severe wind over 30 yrs
- 5.0%
Air-quality risk 1/10 · Minimal
- Unhealthy air days now
- 0 days/yr
- Unhealthy air days in 30 yrs
- 0 days/yr
Risk factors via First Street. Map © Google.
Why this score? — see what drove the F grade
The composite is a weighted blend of 9 inputs, each scored 0–100. Each bar is that input's sub-score; the figure is the points it added to the 100-point composite (weight × sub-score).
- Cash flow +11.5/30.0
- ARV discount +7.5/15.0
- DSCR +3.4/10.0
- Livability +3.2/5.0
- Rent growth +2.6/5.0
- Condition / age +2.5/5.0
- 1% rule +2.3/10.0
- Schools +2.0/10.0
- Appreciation +0.0/10.0
$139,000
🖨 Deal sheet 📄 Offer letter ✓ Due diligence
Listing remarks
Great remodel. New kitchen and bath. Refinished original hard wood floor in living and two bedrooms. Updated tile in dining, kitchen, utility and bath. Stainless appliances including refrigerator. HVAC and roof replaced 2025. Updated windows. No carpet. This is a great redo with Whittier elementary just 2 blocks away. Call John Naberhaus with Parks Jones Realty direct at 580-585-2315 for the most up to date information on this home.
Key facts
- 7,405 sq ft lot
- Built 1938
- Listed 67 days
Property features AI
Exterior
- Parking: No garage
- Utilities: Public water; Public sewer; Natural gas available
- Home design: Single-family residence; One story; Updated/remodeled
- Construction: Vinyl siding
- Exterior features: Covered patio and porch; Porch; Chain link fencing; Composition roof; Paved concrete road access; City street frontage; R-1 single family zoning
Interior
- Kitchen: Cooktop; Range hood; Dishwasher; Refrigerator
- Flooring: Ceramic tile; Hardwood; Vinyl
- Bathrooms: 1 full bathroom
- Heating & cooling: Central heating (natural gas); Central electric air conditioning
- Interior features: Double-pane windows; Crawl space basement
- Laundry & utility: Washer hookup; Gas water heater
Neighborhood map
What this means for you Summary
Snapshot
- This is a 2-bed/1.0-bath single-family listed at $139k.
Deal economics
- At list price, monthly cash flow is $-47 ($-564/yr) — negative.
- To cash-flow at today's rent, offer at most $131k (6.0% below list).
- To meet the 1% rule (rent ≥ 1% of price), the offer needs to be $102k (26.6% below list).
- Recommended offer: $102k (26.6% below list) — sets the bar for 1% rule.
Location & tenants
- Location reads 63/100 on livability (#206 in OK) — a middle-class / working-renter tenant base. Strengths: cost of living A+, housing A+; Watch: employment D, crime F, commute F.
- Lawton (urban): math 20% / reading 26% proficiency, ranked #137 of 270 in OK (top 51%) — low school quality limits family demand, transient renter base, plan for 1-2y turnover.
- Zoned schools: Whittier Es (math 22% / reading 17%, grade F, #479 of 845 statewide, top 63%, 351 students, 0% FRL); Central Ms (math 17% / reading 24%, grade F, #153 of 345 statewide, top 45%, 994 students, 0% FRL); Lawton Hs (math 16% / reading 21%, grade F, #302 of 447 statewide, top 68%, 1,417 students, 0% FRL) — zoned schools average 0% FRL vs 54% district-wide (54 pts lower); this property's tenant base skews higher-income than the district average.
- Market conditions: Rents flat; 208 active listings in the ZIP; 133 units permitted in Comanche County in 2024 (0 in 5+ unit buildings).
Forward outlook
- Local home prices are declining (-3.0%/yr); year-one equity from $961 of loan paydown is wiped out by about $4k of value loss. Plan a longer hold.
- Comanche County population projected to shrink 3% by 2050 — rents likely to lag national; underwrite the cash flow, not the appreciation.
Negotiation context
- It's been on market 67 days — a 6% lower offer ($131k) is reasonable based on typical stale-listing flexibility.
- Current owner paid $85k; list at $139k implies a 64% gain — meaningful room to come down on a strong offer.
Risks & watch-outs
- Watch-outs: built in 1938 — expect roof / HVAC / electrical / plumbing capex.
- Climate carrying-cost: extreme-heat days projected 7→19/yr by 2055 (HVAC capex compounding) — expect insurance premiums to compound above CPI over the hold.
Questions for the listing agent
- What do current leases actually rent for vs. the listed asking? Can we see a recent rent roll and the last 12 months of T-12 income?
- It's been on market 67 days. Have you received any prior offers? Is the seller open to a 27% concession, seller financing, or rate buy-down credit?
- Built in 1938 — when were the roof, HVAC, electrical panel, plumbing, and water heater last replaced?
- Why hasn't it sold? Are there any deal-killer items the seller is aware of (foundation, flood, title, zoning, code violations)?
- Is there a deadline driving the sale (1031 exchange, divorce, estate, relocation)? That informs how much negotiation room exists.
- Schools are D-rated, which usually means shorter tenancies and higher turnover. Who's the typical renter profile here, and what's been the actual vacancy rate?
- Crime grade is F in this area — have there been break-ins, vandalism, or insurance claims at this property in the last 3 years? What carrier currently insures it and at what premium?
- The area grade is low — what's the realistic commute time and amenity access for the typical tenant pool here? Any planned neighborhood developments (good or bad) we should know about?
- What's the average days-on-market for RENTAL listings here right now (not sales)? A rising rental-DOM trend means longer vacancies and softer asking-rent achievability than the comps imply.
- What's the recent tenant-quality profile in this submarket — average credit score on applications, eviction rate, late-payment / NSF rate, and stable-employment percentage? A property-management company in the area should have these aggregated.
- How much new for-sale + rental construction is in the pipeline within 1–3 miles? Heavy new supply typically softens prices + rents 12–24 months out; constrained supply supports both.
Investment metrics
- 1% rule
- 0.73% ✗
- Cap rate
- 5.89%
- Cash-on-cash
- -1.45%
- DSCR
- 0.94
- GRM
- 11.3
CMA / ARV
- ARV (on-the-fly)
- $78,128
- Comps found
- 12
Show comp detail 12 sales within ~0.75 mi
| Address | Dist | Beds/Ba | Sqft | Sold | Price | $/sf | Match |
|---|---|---|---|---|---|---|---|
| 1202 NW Oak Ave | 0.06mi | 2/1.0 | 1,056 (+3%) | 7mo | $117,700 | $111 | 87 |
| 1206 NW Oak Ave | 0.08mi | 2/1.0 | 1,000 (-3%) | 7mo | $77,000 | $77 | 86 |
| 1122 NW Oak Ave | 0.14mi | 2/1.0 | 1,000 (-3%) | 6mo | $79,000 | $79 | 84 |
| 1506 NW 13th St | 0.17mi | 3/1.0 (+1) | 1,036 (+1%) | 8mo | $30,000 | $29 | 80 |
| 703 NW 13th St | 0.43mi | 2/1.0 | 1,000 (-3%) | 9mo | $96,900 | $97 | 68 |
| 1339 NW Ferris | 0.46mi | 3/2.0 (+1) | 1,000 (-3%) | 4mo | $75,900 | $76 | 62 |
| 1410 NW Euclid Ave | 0.53mi | 3/1.0 (+1) | 1,048 (+2%) | 8mo | $67,000 | $64 | 60 |
| 1204 NW Taft | 0.50mi | 2/1.0 | 950 (-8%) | 5mo | $35,000 | $37 | 60 |
| 1605 NW Columbia Ave | 0.68mi | 2/1.0 | 1,100 (+7%) | 1mo | $73,800 | $67 | 56 |
| 1809 NW Kingsbury | 0.57mi | 2/1.0 | 1,146 (+12%) | 3mo | $35,000 | $31 | 51 |
| 1712 NW Euclid Ave | 0.62mi | 2/2.0 | 900 (-12%) | 1mo | $61,200 | $68 | 46 |
| 1808 NW Andrews Ave | 0.61mi | 3/2.0 (+1) | 1,100 (+7%) | 10mo | $129,500 | $118 | 42 |
Match score weights: distance 35% · size 25% · config 20% · recency 20%. Top-matched comps best support the ARV.
Projected returns pro-forma
-3.0% appreciation · 0.25% rent growth · sell at horizon
- IRR
- -21.5%
- Equity multiple
- 0.27×
- Total profit
- $-28,316
- Equity at exit
- $20,725
- IRR
- -22.3%
- Equity multiple
- -0.01×
- Total profit
- $-39,391
- Equity at exit
- $12,018
Cash invested: $38,920 (down + closing). Projections, not guarantees.
Landlord ↔ Tenant lean methodology
- Overall (STATE)
- 83 Strongly Landlord-Friendly
- State Oklahoma
- 83 Strongly Landlord-Friendly · R+20
- County
- — inherits STATE
- City
- — inherits STATE
ZIP-level market 73507
- Home prices YoY
- -23.2%
- Rents YoY
- 0.2%
- Active inventory
- 208
- Price-to-rent
- 11.3×
Monthly cashflow live
- Estimated rent
- $1,021 medium interval (Pro) →
- Mortgage (P&I)
- −$729
- Tax from tax record
- −$66 /mo · $798/yr
- Insurance
- −$58
- HOA
- −$0
- Vacancy / Maint / Mgmt
- −$214
- Net cashflow
- $-47
Break-even live
UW: 25.0% down · 7.5% · 30yr · 1.5% tax · 5.0% vac · 8.0% maint · 8.0% mgmt
Financing live
Cash to close
- Down payment
- $34,750
- Closing costs
- $4,170
- Reserves months
- —
- Total cash needed
- —
Loan-product check · same deal, 3 products live
Conventional
25% down · 7.5% · 30yr
- Down + closing
- —
- Monthly P&I
- —
- Monthly cashflow
- —
- DSCR
- —
- Eligible?
- —
Personal DTI + credit; lowest rate.
DSCR
20% down · 8.5% · 30yr
- Down + closing
- —
- Monthly P&I
- —
- Monthly cashflow
- —
- DSCR
- —
- Eligible?
- —
No personal income docs; deal must DSCR.
Hard money
10% down · 12.0% · 12mo
- Down + closing
- —
- Monthly P&I
- —
- Monthly cashflow
- —
- DSCR
- —
- Eligible?
- —
Short-term bridge; refi at stabilization.
Listing history 9 events
-
2026-06-02status $139,000 Pending 67 DOM
-
2026-06-01days on market $139,000 Active 67 DOM
-
2026-05-31days on market $139,000 Active 66 DOM
-
2026-05-30days on market $139,000 Active 65 DOM
-
2026-03-25$139,000 Active
-
2007-08-10soldstatus $85,000
-
2006-11-09soldstatus $58,000
-
2005-08-09soldstatus $62,500
-
2002-04-11soldstatus $50,000
ⓘ Source: listings_history table (triggers on properties + properties_extension) + one-shot
backfill from property_details.listing_events for pre-trigger history.
Tax reassessment forecast OK · Resets to sale price
- Current annual tax
- $798 · $66/mo
- Projected year-2 tax
- $1,251 · $104/mo
- Expected delta
- +$453/yr (+$38/mo · 56.8%)
ⓘ Screening estimate from a state-policy table — verify with the county assessor before closing.
Climate risk First Street
- Flood 1/10 Low FEMA zone X (unshaded) · 0% chance over 30 yrs
- Wildfire 3/10 Moderate
- Heat 7/10 Severe 7 d/yr ≥108°F today · 19 d/yr by 30 yrs out
- Wind 3/10 Moderate 5% chance of damaging wind over 30 yrs
- Air quality 1/10 Low 0 unhealthy d/yr today · 0 by 30 yrs out
Nearby sold comps map
Loading sold comps map…
Walkable amenities ~0.75 mi
Loading nearby amenities…
Taxation est. · year 1
- Rental income
- $12,249
- − Mortgage interest
- −$7,786
- − Property taxes
- −$798
- − Insurance
- −$695
- − Repairs & maintenance
- −$980
- − Management
- −$980
- − Depreciation
- −$4,044
- Taxable loss
- −$3,034
- Est. tax savings @ 24.0%
- +$728
- After-tax cash flow
- $164/yr
For passive investors: Depreciation is non-cash, so a rental often shows a tax loss while cash-flowing — sheltering income. Rental losses are passive: they offset passive income freely, and up to $25,000/yr can offset ordinary (W-2) income if you actively participate and your MAGI is under $100k (phasing out to $0 by $150k); unused losses carry forward. On sale, claimed depreciation is recaptured at up to 25%, and gains may owe capital-gains tax (a 1031 exchange can defer both). Figures are a year-1 estimate at your 24.0% rate — not tax advice; consult a CPA.
Schools (NCES district)
- District
- Lawton
- NCES district ID
- 4017250
- Math proficiency
- 20% ▼ -12.00%
- Reading proficiency
- 26% ▼ -9.00%
- Median HH income
- $42,618
- Composite
- 19.68/100
- National rank
- #8732
- State rank
- #137 of 270 in OK
Livability — Lawton
- Score
- 63/100
- State rank
- #206
- US rank
- #15131
Category grades
Schools grade is shown separately in the Schools card above.
Census & demographics
- Census place
- Lawton, OK
- County
- Comanche County · 96,361 people
- City population
- 89,233
- Metro
- Lawton, OK
- Population (ZIP)
- 21,046
- Household income
- $62,132
- Rent vs Own
- Severe rent burden
- 979.0
Population outlook (Comanche County) Hauer SSP2
- Today (2025)
- 124,518 people
- By 2030
- 124,231 · -0.2%
- By 2040
- 122,193 · -1.9%
- By 2050
- 120,368 · -3.3%
- By 2075
- 120,492 · -3.2%
- By 2100
- 123,113 · -1.1%
Race, ethnicity, and origin ACS 2023
- Neighborhood character
- Diverse neighborhood (Simpson 0.65)
- Race & ethnicity
- White 56% Hispanic / Latino 14% Two or more races 13% Black 13% Native American 7% Asian 2%
- Hispanic origin (detail)
- Mexican 7% Puerto Rican 4%
- Common ancestry
- Lithuanian 2% Slovak 2% Italian 1%
- Foreign-born
- 5% · Canada, South Korea
- Languages at home
- 89% English-only · Spanish 6% German/W. Germanic 1% Other Asian/Pacific 1%
Political lean MEDSL · Comanche
- 2024 margin
- Strong R (+23.3) · D 37.4% · R 60.7% · Other 1.9%
- 2008→2024 swing
- -5.8pp toward R · 2008: -17.5pp · 2024: -23.3pp
- All cycles
- 2024: R+23.3 2020: R+20.1 2016: R+23.7 2012: R+17.0 2008: R+17.5
Not yet ingested
- Civics
- —
Market trends
- HPI YoY
- ▼ -38.48%
- Current HPI
- 127.057
- Rent YoY
- ▲ 0.25%
- Metro
- Lawton, OK
- State GDP YoY
- ▲ 1.55%
- F500 in state
- 6
Industry mix (Fortune 500 HQ in OK)
| Industry | F500 HQs | Revenue |
|---|---|---|
| Energy | 3 | $48B |
|
||
Price history
+178.0% since first listed5 events — show timeline
- 2026-03-25 Listed $139,000 LBRMLS
- 2007-08-10 Sold (Public Records) $85,000 Public Records
- 2006-11-09 Sold (Public Records) $58,000 Public Records
- 2005-08-09 Sold (Public Records) $62,500 Public Records
- 2002-04-11 Sold (Public Records) $50,000 Public Records
Property tax history
+1.9%/yrLatest (2025): $798 · +15.8% YoY. Source: county tax records.
Cash-flow waterfall
monthlySold comps — $/sqft
last 12 mo · ≤1 miLoading sold comps…