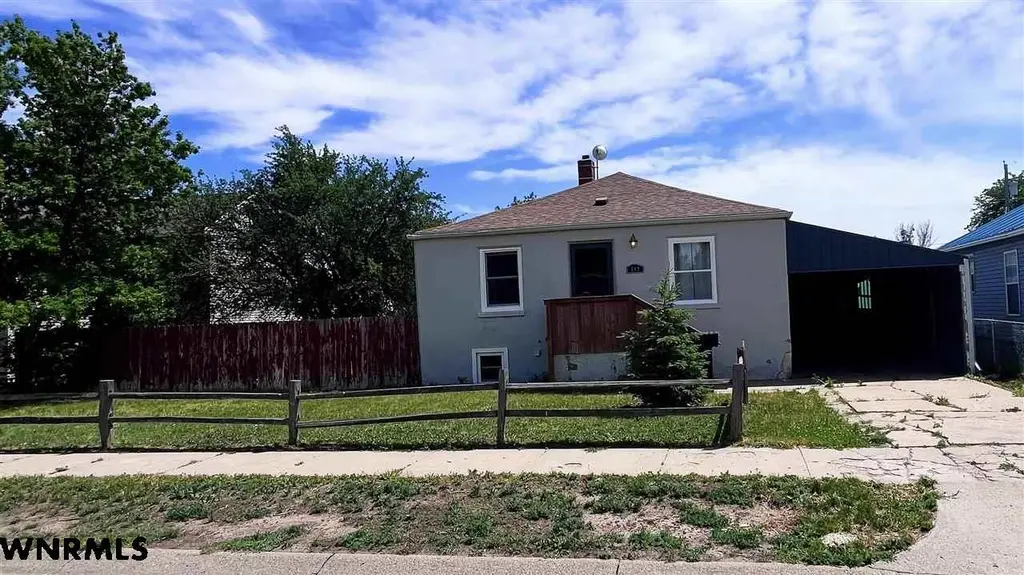
719 E 8th St · Alliance, NE
Flood risk 1/10 · Minimal
- FEMA flood zone
- X
- Chance of flooding over 30 yrs
- 0.0%
- Est. flood insurance / yr
- $473 – $860
Fire risk 3/10 · Minor
- Est. fire insurance / yr
- $1,161 – $2,155
Heat risk 3/10 · Minor
- Hot days now (above 95°F)
- 7 days/yr
- Hot days in 30 yrs
- 18 days/yr
Wind risk 2/10 · Minimal
- Chance of severe wind over 30 yrs
- —
Air-quality risk 2/10 · Minimal
- Unhealthy air days now
- 1 days/yr
- Unhealthy air days in 30 yrs
- 1 days/yr
Risk factors via First Street. Map © Google.
Why this score? — see what drove the C grade
The composite is a weighted blend of 9 inputs, each scored 0–100. Each bar is that input's sub-score; the figure is the points it added to the 100-point composite (weight × sub-score).
- Cash flow +24.9/30.0
- DSCR +8.1/10.0
- ARV discount +7.5/15.0
- 1% rule +6.1/10.0
- Livability +4.0/5.0
- Schools +2.8/10.0
- Rent growth +2.5/5.0
- Condition / age +2.5/5.0
- Appreciation +0.0/10.0
$88,000
🖨 Deal sheet 📄 Offer letter ✓ Due diligence
Key facts
- Garage
- Built 1949
- Listed 7 days
Property features AI
Exterior
- Parking: Detached 1-car garage
- Utilities: Public water; Public sewer; Natural gas available
- Home design: Single-family residential home
- Construction: Frame and stucco construction
- Exterior features: Wood fencing; Composition roof
Interior
- Kitchen: Electric range; Microwave; Refrigerator
- Bedrooms: 1 bedroom on the main level
- Bathrooms: 1 bathroom on the main level
- Heating & cooling: Forced air heating
- Interior features: Pantry; Full, partially finished basement
- Laundry & utility: Laundry located in the basement; Gas water heater
Neighborhood map
What this means for you Summary
Snapshot
- This is a 1-bed/1.0-bath single-family listed at $88k.
Deal economics
- At list price, monthly cash flow is $188 ($2k/yr) — positive.
- The deal already cash-flows at list — no discount required.
- Meets the 1% rule at list price ($978 rent vs $88k).
Location & tenants
- Location reads 80/100 on livability (#34 in NE, #1,869 nationally) — a professional / high-income tenant draw. Strengths: cost of living A+, housing A+, health & safety A+; Watch: schools C-, amenities C-, commute F.
- Alliance Public Schools (town): math 28% / reading 38% proficiency, ranked #105 of 111 in NE (top 95%) — families likely to look elsewhere, expect single-tenant / working-renter base with shorter leases.
- Market conditions: 18 active listings in the ZIP; 5 units permitted in Box Butte County in 2024 (0 in 5+ unit buildings).
Forward outlook
- Local home prices are declining (-3.0%/yr); year-one equity from $608 of loan paydown is wiped out by about $3k of value loss. Plan a longer hold.
- Box Butte County population projected at +8% by 2050 — modest demand growth; plan on rents tracking national, not racing it.
Negotiation context
- Only 7 days on market — expect competitive offers; lowballing is unlikely to land.
- 2 sale attempts with the ask held roughly flat each time — persistent listings suggest the price (not the market) is what's stuck; bring a comps-based counter.
- Current owner paid $55k; list at $88k implies a 60% gain — meaningful room to come down on a strong offer.
Risks & watch-outs
- Watch-outs: built in 1949 — expect roof / HVAC / electrical / plumbing capex.
Questions for the listing agent
- Built in 1949 — when were the roof, HVAC, electrical panel, plumbing, and water heater last replaced?
- Is there a deadline driving the sale (1031 exchange, divorce, estate, relocation)? That informs how much negotiation room exists.
- What's the average days-on-market for RENTAL listings here right now (not sales)? A rising rental-DOM trend means longer vacancies and softer asking-rent achievability than the comps imply.
- What's the recent tenant-quality profile in this submarket — average credit score on applications, eviction rate, late-payment / NSF rate, and stable-employment percentage? A property-management company in the area should have these aggregated.
- How much new for-sale + rental construction is in the pipeline within 1–3 miles? Heavy new supply typically softens prices + rents 12–24 months out; constrained supply supports both.
Investment metrics
- 1% rule
- 1.11% ✓
- Cap rate
- 8.86%
- Cash-on-cash
- 9.18%
- DSCR
- 1.41
- GRM
- 7.5
CMA / ARV
No comps found within radius.
Projected returns pro-forma
-3.0% appreciation · 3.0% rent growth · sell at horizon
- IRR
- -2.4%
- Equity multiple
- 0.91×
- Total profit
- $-2,257
- Equity at exit
- $13,121
- IRR
- 7.3%
- Equity multiple
- 1.55×
- Total profit
- $13,490
- Equity at exit
- $7,609
Cash invested: $24,640 (down + closing). Projections, not guarantees.
Landlord ↔ Tenant lean methodology
- Overall (STATE)
- 83 Strongly Landlord-Friendly
- State Nebraska
- 83 Strongly Landlord-Friendly · R+13
- County
- — inherits STATE
- City
- — inherits STATE
ZIP-level market 69301
- Home prices YoY
- -31.5%
- Active inventory
- 18
- Price-to-rent
- 7.5×
Monthly cashflow live
- Estimated rent
- $978 medium interval (Pro) →
- Mortgage (P&I)
- −$461
- Tax from tax record
- −$86 /mo · $1,032/yr
- Insurance
- −$37
- HOA
- −$0
- Vacancy / Maint / Mgmt
- −$205
- Net cashflow
- $188
Break-even live
UW: 25.0% down · 7.5% · 30yr · 1.5% tax · 5.0% vac · 8.0% maint · 8.0% mgmt
Financing live
Cash to close
- Down payment
- $22,000
- Closing costs
- $2,640
- Reserves months
- —
- Total cash needed
- —
Loan-product check · same deal, 3 products live
Conventional
25% down · 7.5% · 30yr
- Down + closing
- —
- Monthly P&I
- —
- Monthly cashflow
- —
- DSCR
- —
- Eligible?
- —
Personal DTI + credit; lowest rate.
DSCR
20% down · 8.5% · 30yr
- Down + closing
- —
- Monthly P&I
- —
- Monthly cashflow
- —
- DSCR
- —
- Eligible?
- —
No personal income docs; deal must DSCR.
Hard money
10% down · 12.0% · 12mo
- Down + closing
- —
- Monthly P&I
- —
- Monthly cashflow
- —
- DSCR
- —
- Eligible?
- —
Short-term bridge; refi at stabilization.
Listing history 6 events
-
2026-06-18days on market $88,000 Active 7 DOM
-
2026-06-17days on market $88,000 Active 6 DOM
-
2026-06-16days on market $88,000 Active 5 DOM
-
2026-06-15days on market $88,000 Active 4 DOM
-
2026-06-13days on market $88,000 Active 2 DOM
-
2026-06-12$88,000 Active 1 DOM
ⓘ Source: listings_history table (triggers on properties + properties_extension) + one-shot
backfill from property_details.listing_events for pre-trigger history.
Tax reassessment forecast NE · Resets to sale price
- Current annual tax
- $1,032 · $86/mo
- Projected year-2 tax
- $1,522 · $127/mo
- Expected delta
- +$490/yr (+$41/mo · 47.5%)
ⓘ Screening estimate from a state-policy table — verify with the county assessor before closing.
Climate risk First Street
- Flood 1/10 Low FEMA zone X · 0% chance over 30 yrs
- Wildfire 3/10 Moderate
- Heat 3/10 Moderate 7 d/yr ≥95°F today · 18 d/yr by 30 yrs out
- Wind 2/10 Low
- Air quality 2/10 Low 1 unhealthy d/yr today · 1 by 30 yrs out
Nearby sold comps map
Loading sold comps map…
Walkable amenities ~0.75 mi
Loading nearby amenities…
Taxation est. · year 1
- Rental income
- $11,736
- − Mortgage interest
- −$4,929
- − Property taxes
- −$1,032
- − Insurance
- −$440
- − Repairs & maintenance
- −$939
- − Management
- −$939
- − Depreciation
- −$2,560
- Taxable income
- $897
- Est. tax owed @ 24.0%
- −$215
- After-tax cash flow
- $2,046/yr
For passive investors: Depreciation is non-cash, so a rental often shows a tax loss while cash-flowing — sheltering income. Rental losses are passive: they offset passive income freely, and up to $25,000/yr can offset ordinary (W-2) income if you actively participate and your MAGI is under $100k (phasing out to $0 by $150k); unused losses carry forward. On sale, claimed depreciation is recaptured at up to 25%, and gains may owe capital-gains tax (a 1031 exchange can defer both). Figures are a year-1 estimate at your 24.0% rate — not tax advice; consult a CPA.
Schools (NCES district)
- District
- Alliance Public Schools
- NCES district ID
- 3102910
- Math proficiency
- 28% ▼ -2.00%
- Reading proficiency
- 38% ▼ -1.00%
- Median HH income
- $47,392
- Composite
- 28.41/100
- National rank
- #6762
- State rank
- #105 of 111 in NE
Livability — Alliance
- Score
- 80/100
- State rank
- #34
- US rank
- #1869
Category grades
Schools grade is shown separately in the Schools card above.
Census & demographics
- Census place
- Alliance, NE
- Population (ZIP)
- 9,525
Population outlook (Box Butte County) Hauer SSP2
- Today (2025)
- 11,534 people
- By 2030
- 11,654 · +1.0%
- By 2040
- 11,978 · +3.8%
- By 2050
- 12,394 · +7.5%
- By 2075
- 13,519 · +17.2%
- By 2100
- 13,733 · +19.1%
Race, ethnicity, and origin ACS 2023
- Neighborhood character
- Predominantly White (80%)
- Race & ethnicity
- White 80% Hispanic / Latino 13% Two or more races 7% Black 4% Native American 1%
- Hispanic origin (detail)
- Mexican 11%
- Common ancestry
- Portuguese 3% Slovak 3% Lithuanian 3%
- Foreign-born
- 7% · Canada
- Languages at home
- 94% English-only · Spanish 4% Tagalog/Filipino 1%
Political lean MEDSL · Box Butte
- 2024 margin
- Solid R (+56.5) · D 21.1% · R 77.6% · Other 1.2%
- 2008→2024 swing
- -35.5pp toward R · 2008: -21.0pp · 2024: -56.5pp
- All cycles
- 2024: R+56.5 2020: R+56.8 2016: R+54.5 2012: R+25.6 2008: R+21.0
Not yet ingested
- Civics
- —
Market trends
- HPI YoY
- ▼ -79.93%
- Current HPI
- 173.5928
- Rent YoY
- —
- Metro
- —
- State GDP YoY
- ▲ 0.68%
- F500 in state
- 2
Industry mix (Fortune 500 HQ in NE)
| Industry | F500 HQs | Revenue |
|---|---|---|
| Conglomerate | 1 | $371B |
|
||
Price history
+83.3% since first listed5 events — show timeline
- 2026-06-11 Listed $88,000 WNBOR
- 2025-12-18 Price Changed $94,000 WNBOR
- 2025-09-16 Listed $99,000 WNBOR
- 2008-10-06 Sold (Public Records) $55,000 Public Records
- 2007-08-22 Sold (Public Records) $48,000 Public Records
Property tax history
+0.0%/yrLatest (2025): $1,032 · +4.3% YoY. Source: county tax records.
Cash-flow waterfall
monthlySold comps — $/sqft
last 12 mo · ≤1 miLoading sold comps…