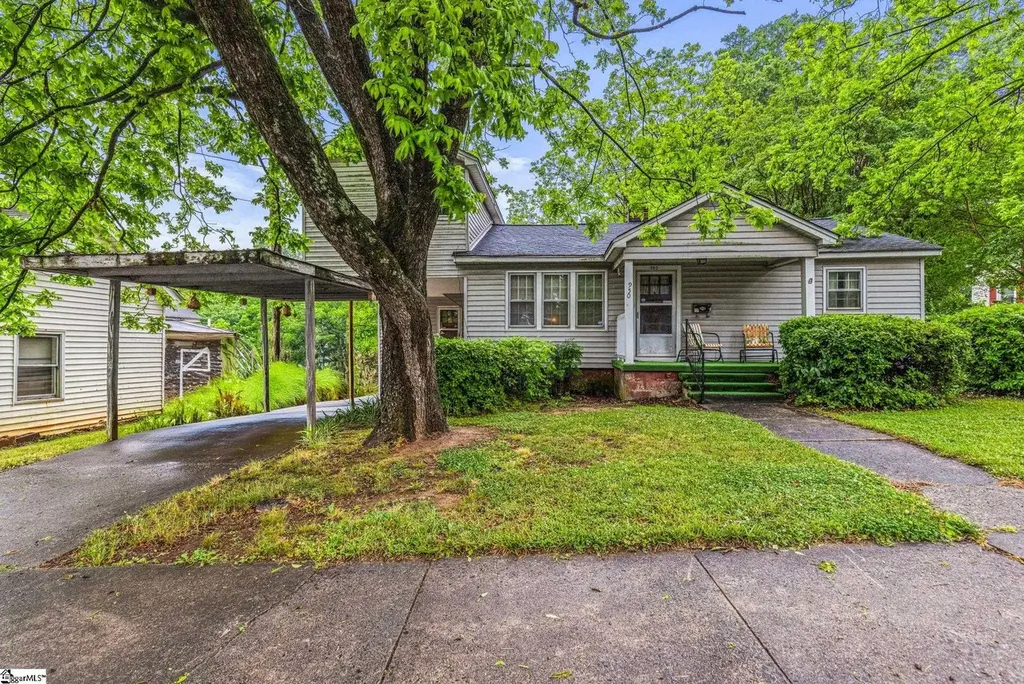
950 N Logan St · Gaffney, SC
Flood risk 1/10 · Minimal
- FEMA flood zone
- X (unshaded)
- Chance of flooding over 30 yrs
- 0.0%
- Est. flood insurance / yr
- $507 – $1,088
Fire risk 3/10 · Minor
- Est. fire insurance / yr
- $783 – $1,453
Heat risk 6/10 · Moderate
- Hot days now (above 103°F)
- 7 days/yr
- Hot days in 30 yrs
- 16 days/yr
Wind risk 3/10 · Minor
- Chance of severe wind over 30 yrs
- 4.0%
Air-quality risk 3/10 · Minor
- Unhealthy air days now
- 3 days/yr
- Unhealthy air days in 30 yrs
- 4 days/yr
Risk factors via First Street. Map © Google.
Why this score? — see what drove the D+ grade
The composite is a weighted blend of 9 inputs, each scored 0–100. Each bar is that input's sub-score; the figure is the points it added to the 100-point composite (weight × sub-score).
- ARV discount +15.0/15.0
- Cash flow +14.5/30.0
- DSCR +4.4/10.0
- 1% rule +3.4/10.0
- Livability +3.3/5.0
- Schools +2.8/10.0
- Rent growth +2.5/5.0
- Condition / age +2.5/5.0
- Appreciation +0.0/10.0
$150,000
🖨 Deal sheet 📄 Offer letter ✓ Due diligence
Listing remarks
Nestled in the heart of Gaffney, this 4-bedroom, 1-bathroom home sits on a generous lot and carries the kind of character and charm that only comes with age. Original details and timeless bones give this property a foundation that newer construction simply can't replicate; all it needs is the right vision and a little love to bring it back to its full potential. Whether you're a hands-on homeowner ready to make it your own or a savvy investor looking for your next project, the opportunity here is hard to ignore. With four bedrooms at this price point in an established Gaffney neighborhood, the value and upside are immediately apparent for those willing to roll up their sleeves. The room cou
Key facts
- Generous lot
- Close to local shops
- Easy access to i-85
Tags
Property features AI
Finance
- Other: Lead-based paint disclosure required; Residential property disclosure required
- HOA & community: No HOA fees (HOA fee includes: none); No community amenities
Exterior
- Parking: Detached carport (1 car); Paved concrete driveway
- Utilities: Public water; Public sewer; Water heater — other (see remarks)
- Home design: Single-story home; Approximate age 50+ years; Crawl space foundation
- Construction: Vinyl siding exterior; Architectural roof
- Exterior features: Level lot; Approximate lot dimensions 80 x 193; Approximately 1/2 acre
Interior
- Kitchen: Cooktop (gas); Dishwasher; Kitchen approx. size 17 x 13
- Bedrooms: Primary bedroom on main level (11 x 17); Second bedroom (14 x 12); Third bedroom (13 x 9); Fourth bedroom (12 x 13); Two bedrooms on the main level
- Flooring: Carpet; Hardwood
- Bathrooms: One full bathroom (on main level)
- Heating & cooling: Natural gas heating; Central forced cooling
- Interior features: Other — see remarks; No fireplace
- Laundry & utility: Laundry on first floor
Neighborhood map
What this means for you Summary
Snapshot
- This is a 4-bed/1.0-bath single-family listed at $150k.
Deal economics
- At list price, monthly cash flow is $34 ($403/yr) — positive.
- The deal already cash-flows at list — no discount required.
- To meet the 1% rule (rent ≥ 1% of price), the offer needs to be $125k (16.5% below list).
- Recommended offer: $125k (16.5% below list) — sets the bar for 1% rule.
- Cap rate 6.6% vs local median 2.6% in Gaffney — top-decile yield for the area; either an underpriced asset or a hidden risk that comps aren't pricing in. Stress-test before assuming the spread holds.
Location & tenants
- Location reads 66/100 on livability (#112 in SC) — a middle-class / working-renter tenant base. Strengths: cost of living A+, health & safety A+, housing A-; Watch: amenities D+, crime D, schools D-.
- Cherokee 01 (rural): math 29% / reading 40% proficiency, ranked #47 of 80 in SC (top 59%) — families likely to look elsewhere, expect single-tenant / working-renter base with shorter leases; 64% free/reduced lunch — lower-income household profile, screen leases tightly.
- Market conditions: 196 active listings in the ZIP; 200 units permitted in Cherokee County in 2024 (0 in 5+ unit buildings).
Forward outlook
- Local home prices are declining (-3.0%/yr); year-one equity from $1k of loan paydown is wiped out by about $4k of value loss. Plan a longer hold.
Negotiation context
- It's been on market 49 days — a 3% lower offer ($146k) is reasonable based on typical stale-listing flexibility.
Risks & watch-outs
- Watch-outs: built in 1950 — expect roof / HVAC / electrical / plumbing capex.
- Climate carrying-cost: extreme-heat days projected 7→16/yr by 2055 (HVAC capex compounding) — expect insurance premiums to compound above CPI over the hold.
Questions for the listing agent
- It's been on market 49 days. Have you received any prior offers? Is the seller open to a 16% concession, seller financing, or rate buy-down credit?
- Built in 1950 — when were the roof, HVAC, electrical panel, plumbing, and water heater last replaced?
- Is there a deadline driving the sale (1031 exchange, divorce, estate, relocation)? That informs how much negotiation room exists.
- Schools are D-rated, which usually means shorter tenancies and higher turnover. Who's the typical renter profile here, and what's been the actual vacancy rate?
- Crime grade is D in this area — have there been break-ins, vandalism, or insurance claims at this property in the last 3 years? What carrier currently insures it and at what premium?
- The area grade is low — what's the realistic commute time and amenity access for the typical tenant pool here? Any planned neighborhood developments (good or bad) we should know about?
- What's the average days-on-market for RENTAL listings here right now (not sales)? A rising rental-DOM trend means longer vacancies and softer asking-rent achievability than the comps imply.
- What's the recent tenant-quality profile in this submarket — average credit score on applications, eviction rate, late-payment / NSF rate, and stable-employment percentage? A property-management company in the area should have these aggregated.
- How much new for-sale + rental construction is in the pipeline within 1–3 miles? Heavy new supply typically softens prices + rents 12–24 months out; constrained supply supports both.
Investment metrics
- 1% rule
- 0.84% ✗
- Cap rate
- 6.56%
- Cash-on-cash
- 0.96%
- DSCR
- 1.04
- GRM
- 10.0
CMA / ARV
- ARV (on-the-fly)
- $184,210
- Comps found
- 8
Show comp detail 8 sales within ~0.75 mi
| Address | Dist | Beds/Ba | Sqft | Sold | Price | $/sf | Match |
|---|---|---|---|---|---|---|---|
| 933 N Granard St | 0.21mi | 4/2.5 | 1,622 (-4%) | 21mo | $205,000 | $126 | 60 |
| 207 Magnolia St | 0.53mi | 4/3.0 | 1,624 (-4%) | 2mo | $224,500 | $138 | 60 |
| 510 W Frederick St | 0.54mi | 4/2.0 | 1,656 (-2%) | 18mo | $85,000 | $51 | 52 |
| 102 Beech St St | 0.62mi | 4/2.0 | 1,624 (-4%) | 14mo | $174,900 | $108 | 49 |
| 126 Jolly Dr Dr | 0.68mi | 3/2.0 (-1) | 1,532 (-9%) | 0mo | $150,500 | $98 | 43 |
| 1355 N Limestone St | 0.39mi | 3/1.5 (-1) | 1,485 (-12%) | 15mo | $162,500 | $109 | 42 |
| 411 W Frederick St | 0.53mi | 4/2.0 | 1,821 (+8%) | 21mo | $195,000 | $107 | 40 |
| 205 E Robinson St | 0.51mi | 3/2.0 (-1) | 1,452 (-14%) | 7mo | $199,900 | $138 | 38 |
Match score weights: distance 35% · size 25% · config 20% · recency 20%. Top-matched comps best support the ARV.
Projected returns pro-forma
-3.0% appreciation · 3.0% rent growth · sell at horizon
- IRR
- -14.8%
- Equity multiple
- 0.47×
- Total profit
- $-22,200
- Equity at exit
- $22,365
- IRR
- -6.2%
- Equity multiple
- 0.60×
- Total profit
- $-16,704
- Equity at exit
- $12,969
Cash invested: $42,000 (down + closing). Projections, not guarantees.
Landlord ↔ Tenant lean methodology
- Overall (STATE)
- 90 Strongly Landlord-Friendly
- State South Carolina
- 90 Strongly Landlord-Friendly · R+6
- County
- — inherits STATE
- City
- — inherits STATE
ZIP-level market 29341
- Home prices YoY
- -24.1%
- Active inventory
- 196
- Price-to-rent
- 10.0×
Monthly cashflow live
- Estimated rent
- $1,253 medium interval (Pro) →
- Mortgage (P&I)
- −$787
- Tax from tax record
- −$107 /mo · $1,282/yr
- Insurance
- −$62
- HOA
- −$0
- Vacancy / Maint / Mgmt
- −$263
- Net cashflow
- $34
Break-even live
UW: 25.0% down · 7.5% · 30yr · 1.5% tax · 5.0% vac · 8.0% maint · 8.0% mgmt
Financing live
Cash to close
- Down payment
- $37,500
- Closing costs
- $4,500
- Reserves months
- —
- Total cash needed
- —
Loan-product check · same deal, 3 products live
Conventional
25% down · 7.5% · 30yr
- Down + closing
- —
- Monthly P&I
- —
- Monthly cashflow
- —
- DSCR
- —
- Eligible?
- —
Personal DTI + credit; lowest rate.
DSCR
20% down · 8.5% · 30yr
- Down + closing
- —
- Monthly P&I
- —
- Monthly cashflow
- —
- DSCR
- —
- Eligible?
- —
No personal income docs; deal must DSCR.
Hard money
10% down · 12.0% · 12mo
- Down + closing
- —
- Monthly P&I
- —
- Monthly cashflow
- —
- DSCR
- —
- Eligible?
- —
Short-term bridge; refi at stabilization.
Listing history 16 events
-
2026-06-19days on market $150,000 Active 49 DOM
-
2026-06-18days on market $150,000 Active 48 DOM
-
2026-06-17days on market $150,000 Active 47 DOM
-
2026-06-16days on market $150,000 Active 46 DOM
-
2026-06-15days on market $150,000 Active 45 DOM
-
2026-06-14days on market $150,000 Active 43 DOM
-
2026-06-13days on market $150,000 Active 42 DOM
-
2026-06-10days on market $150,000 Active 40 DOM
-
2026-06-09days on market $150,000 Active 39 DOM
-
2026-06-08days on market $150,000 Active 38 DOM
-
2026-06-07days on market $150,000 Active 37 DOM
-
2026-06-02days on market $150,000 Active 32 DOM
-
2026-06-01days on market $150,000 Active 31 DOM
-
2026-05-31days on market $150,000 Active 30 DOM
-
2026-05-30days on market $150,000 Active 29 DOM
-
2026-05-01$150,000 Active
ⓘ Source: listings_history table (triggers on properties + properties_extension) + one-shot
backfill from property_details.listing_events for pre-trigger history.
Tax reassessment forecast SC · Resets to sale price
- Current annual tax
- $1,282 · $107/mo
- Projected year-2 tax
- $1,282 · $107/mo
- Expected delta
- $0/yr ($0/mo · 0.0%)
ⓘ Screening estimate from a state-policy table — verify with the county assessor before closing.
Climate risk First Street
- Flood 1/10 Low FEMA zone X (unshaded) · 0% chance over 30 yrs
- Wildfire 3/10 Moderate
- Heat 6/10 Major 7 d/yr ≥103°F today · 16 d/yr by 30 yrs out
- Wind 3/10 Moderate 4% chance of damaging wind over 30 yrs
- Air quality 3/10 Moderate 3 unhealthy d/yr today · 4 by 30 yrs out
Nearby sold comps map
Loading sold comps map…
Walkable amenities ~0.75 mi
Loading nearby amenities…
Taxation est. · year 1
- Rental income
- $15,030
- − Mortgage interest
- −$8,402
- − Property taxes
- −$1,282
- − Insurance
- −$750
- − Repairs & maintenance
- −$1,202
- − Management
- −$1,202
- − Depreciation
- −$4,364
- Taxable loss
- −$2,172
- Est. tax savings @ 24.0%
- +$521
- After-tax cash flow
- $924/yr
For passive investors: Depreciation is non-cash, so a rental often shows a tax loss while cash-flowing — sheltering income. Rental losses are passive: they offset passive income freely, and up to $25,000/yr can offset ordinary (W-2) income if you actively participate and your MAGI is under $100k (phasing out to $0 by $150k); unused losses carry forward. On sale, claimed depreciation is recaptured at up to 25%, and gains may owe capital-gains tax (a 1031 exchange can defer both). Figures are a year-1 estimate at your 24.0% rate — not tax advice; consult a CPA.
Schools (NCES district)
- District
- Cherokee 01
- NCES district ID
- 4501500
- Math proficiency
- 29% ▼ -9.00%
- Reading proficiency
- 40% ▼ -2.00%
- Median HH income
- $34,262
- Composite
- 28.39/100
- National rank
- #6768
- State rank
- #47 of 80 in SC
Livability — Gaffney
- Score
- 66/100
- State rank
- #112
- US rank
- #11549
Category grades
Schools grade is shown separately in the Schools card above.
Census & demographics
- Census place
- Gaffney, SC
- County
- Cherokee County · 41,410 people
- City population
- 41,410
- Metro
- Gaffney, SC
- Population (ZIP)
- 20,647
- Household income
- $58,029
- Rent vs Own
- Severe rent burden
- 452.0
Population outlook (Cherokee County) Hauer SSP2
- Today (2025)
- 58,602 people
- By 2030
- 59,336 · +1.3%
- By 2040
- 60,266 · +2.8%
- By 2050
- 60,314 · +2.9%
- By 2075
- 59,276 · +1.2%
- By 2100
- 53,788 · -8.2%
Race, ethnicity, and origin ACS 2023
- Neighborhood character
- Diverse neighborhood (Simpson 0.58)
- Race & ethnicity
- White 59% Black 26% Two or more races 9% Hispanic / Latino 8%
- Hispanic origin (detail)
- Mexican 4% Puerto Rican 1%
- Common ancestry
- Italian 2% Serbian 2% Slovak 2%
- Foreign-born
- 4% · Canada
- Languages at home
- 93% English-only · Spanish 6% Other Indo-European 1%
Political lean MEDSL · Cherokee
- 2024 margin
- Solid R (+51.4) · D 23.9% · R 75.3%
- 2008→2024 swing
- -22.0pp toward R · 2008: -29.3pp · 2024: -51.4pp
- All cycles
- 2024: R+51.4 2020: R+43.8 2016: R+41.7 2012: R+29.3 2008: R+29.3
Not yet ingested
- Civics
- —
Market trends
- HPI YoY
- ▼ -64.62%
- Current HPI
- 203.8038
- Rent YoY
- —
- Metro
- Gaffney, SC
- State GDP YoY
- ▲ 4.51%
- F500 in state
- 2
Industry mix (Fortune 500 HQ in SC)
| Industry | F500 HQs | Revenue |
|---|---|---|
| Packaging | 1 | $7B |
|
||
Price history
1 event — show timeline
- 2026-05-01 Listed $150,000 Greater Greenville MLS
Property tax history
+7.1%/yrLatest (2025): $1,282 · +4.2% YoY. Source: county tax records.
Cash-flow waterfall
monthlySold comps — $/sqft
last 12 mo · ≤1 miLoading sold comps…