 Duplex
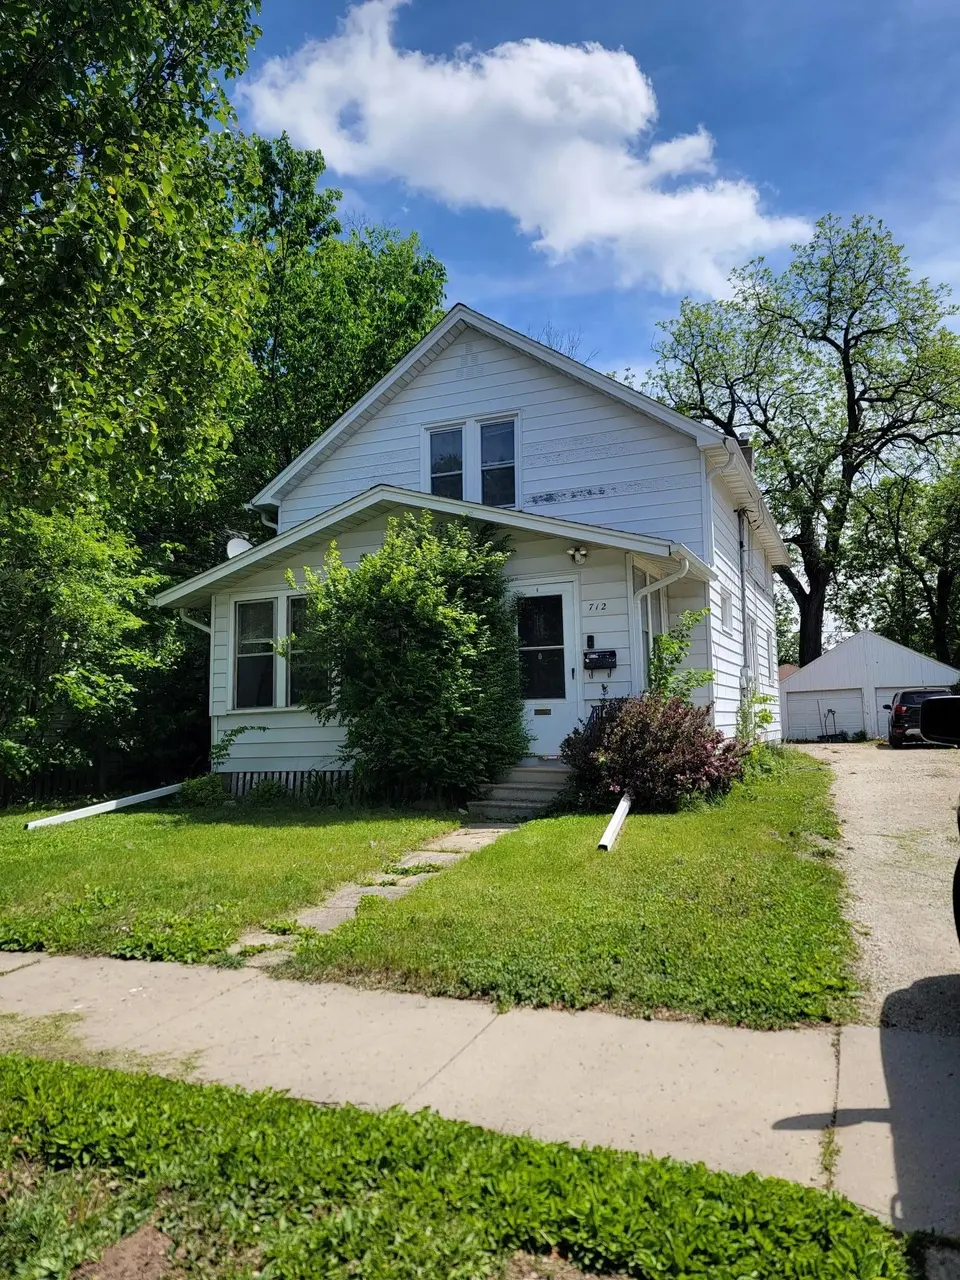
712 8th Ave SE · Rochester, MN
Flood risk 1/10 · Minimal
- FEMA flood zone
- X (unshaded)
- Chance of flooding over 30 yrs
- 0.0%
- Est. flood insurance / yr
- $473 – $860
Fire risk 1/10 · Minimal
- Est. fire insurance / yr
- $888 – $1,650
Heat risk 2/10 · Minimal
- Hot days now (above 98°F)
- 7 days/yr
- Hot days in 30 yrs
- 15 days/yr
Wind risk 2/10 · Minimal
- Chance of severe wind over 30 yrs
- —
Air-quality risk 2/10 · Minimal
- Unhealthy air days now
- 1 days/yr
- Unhealthy air days in 30 yrs
- 1 days/yr
Risk factors via First Street. Map © Google.
Why this score? — see what drove the B- grade
The composite is a weighted blend of 9 inputs, each scored 0–100. Each bar is that input's sub-score; the figure is the points it added to the 100-point composite (weight × sub-score).
- Cash flow +27.3/30.0
- DSCR +9.5/10.0
- 1% rule +7.6/10.0
- ARV discount +7.5/15.0
- Livability +4.6/5.0
- Schools +4.1/10.0
- Rent growth +3.0/5.0
- Condition / age +2.5/5.0
- Appreciation +0.0/10.0
$221,999
🖨 Deal sheet 📄 Offer letter ✓ Due diligence
Multi-family units
County records classify this as Multi-Family (2-4 Unit). Listing-text estimate: 2 units. confirmed
Listing remarks MLS
Duplex located in a quiet residential area. New windows, doors, vinyl siding, insulation, furnance, and water heater in 1989. New garage doors in 1998. Enclosed front porch. Roof is 1 yr old, windows are up to code. Renter pays electric.
Key facts
- Turnkey duplex
- Separate laundry
- Updated bathrooms
Tags
Property features AI
Finance
- Financial info: Property configured as 2 units; Gross income reported at $25,380; Owner pays water and sewer; Insurance expense listed at $1,400; Maintenance expense listed at $1,250; Other expense listed at $1,250; Water/sewer expense listed at $780; Tenants pay electricity, gas, lawn care, snow removal, and trash collection
Exterior
- Parking: Detached or attached 2-car garage
- Utilities: City water; City sewer; Electric and natural gas service
- Home design: Residential income property — duplex (up and down); Two-story
- Construction: Stone foundation; Foundation area about 612
- Exterior features: Lot approximately 0.151 acres (50 x 132); Above-grade finished living area about 1,428; Below-grade area about 612; Total building area about 2,040; Stone foundation
Interior
- Bedrooms: 4 total bedrooms; Each unit includes 2 bedrooms
- Bathrooms: 2 full bathrooms (one in each unit)
- Heating & cooling: Baseboard heating; Forced air heating
- Interior features: Unfinished basement; Two levels
Neighborhood map
What this means for you Summary
Snapshot
- This is a 2 × 2-bed/1.0-bath units multifamily listed at $222k.
Deal economics
- At list price, monthly cash flow is $642 ($8k/yr) — positive. Per door: $321/mo.
- The deal already cash-flows at list — no discount required.
- Meets the 1% rule at list price ($3k rent vs $222k).
- Recommended offer: $219k (1.5% below list) — sets the bar for market timing.
- Cap rate 9.8% vs local median 3.5% in Rochester — top-decile yield for the area; either an underpriced asset or a hidden risk that comps aren't pricing in. Stress-test before assuming the spread holds.
Location & tenants
- Location reads 92/100 on livability (#1 in MN, #27 nationally) — a professional / high-income tenant draw. Strengths: amenities A+, commute A+, employment A+.
- Rochester Public School District (urban): math 40% / reading 51% proficiency, ranked #152 of 301 in MN (top 50%) — families likely to look elsewhere, expect single-tenant / working-renter base with shorter leases.
- Zoned schools: Riverside Central Elementary (math 12% / reading 22%, grade F, #771 of 857 statewide, top 91%, 417 students, 79% FRL); Mayo Senior High (math 42% / reading 65%, grade C-, #104 of 471 statewide, top 22%, 1,862 students, 31% FRL) — zoned schools average 55% FRL vs 31% district-wide (25 pts higher); higher-poverty schools than district average — tighter screening recommended.
- Market conditions: Rents rising (+2.1%/yr); 149 active listings in the ZIP; 19 comparable units currently listed for rent nearby; rentals leasing fast (median 13d on market — plan ~1-2 weeks tenant-placement turnaround); solid renter incomes; 1,267 units permitted in Olmsted County in 2024 (915 in 5+ unit buildings).
- This rent runs 44% of the median local income ($77k/yr) — at the standard rent-burdened threshold; future hikes will face affordability resistance.
Forward outlook
- Local home prices are declining (-3.0%/yr); year-one equity from $2k of loan paydown is wiped out by about $7k of value loss. Plan a longer hold.
- Olmsted County population projected at +16% by 2050 — long-run rental-demand tailwind backs the buy-and-hold thesis.
Negotiation context
- It's been on market 27 days — a 2% lower offer ($219k) is reasonable based on typical stale-listing flexibility.
- 4 sale attempts since 25y ago with the ask held roughly flat each time — persistent listings suggest the price (not the market) is what's stuck; bring a comps-based counter.
- Current owner paid $37k; list at $222k implies a 502% gain — meaningful room to come down on a strong offer.
Risks & watch-outs
- Watch-outs: built in 1920 — expect roof / HVAC / electrical / plumbing capex.
Questions for the listing agent
- Can we see the unit-by-unit rent roll, current vacancy, and any below-market leases? What's the average tenancy length?
- What capital expenditures (roof, boiler, parking lot, exteriors) have been made in the last 5 years, and what's planned in the next 2?
- Built in 1920 — when were the roof, HVAC, electrical panel, plumbing, and water heater last replaced?
- Is there a deadline driving the sale (1031 exchange, divorce, estate, relocation)? That informs how much negotiation room exists.
- Schools are A-rated — typically a magnet for longer-tenancy family renters. What's the average tenant stay here, and is there a school-zone premium baked into asking?
- What's the average days-on-market for RENTAL listings here right now (not sales)? A rising rental-DOM trend means longer vacancies and softer asking-rent achievability than the comps imply.
- What's the recent tenant-quality profile in this submarket — average credit score on applications, eviction rate, late-payment / NSF rate, and stable-employment percentage? A property-management company in the area should have these aggregated.
- How much new apartment / multifamily construction is in the pipeline within 1–3 miles? Heavy new supply (>2% of stock underway) typically softens rents 12–24 months out; light construction supports rent growth.
Investment metrics
- 1% rule
- 1.26% ✓
- Cap rate
- 9.76%
- Cash-on-cash
- 12.39%
- DSCR
- 1.55
- GRM
- 6.6
CMA / ARV
No comps found within radius.
Projected returns pro-forma
-3.0% appreciation · 2.1% rent growth · sell at horizon
- IRR
- 1.0%
- Equity multiple
- 1.04×
- Total profit
- $2,468
- Equity at exit
- $33,101
- IRR
- 9.8%
- Equity multiple
- 1.72×
- Total profit
- $44,929
- Equity at exit
- $19,194
Cash invested: $62,160 (down + closing). Projections, not guarantees.
Landlord ↔ Tenant lean methodology
- Overall (STATE)
- 46 Balanced
- State Minnesota
- 46 Balanced · D+2
- County
- — inherits STATE
- City
- — inherits STATE
ZIP-level market 55904
- Rents YoY
- 2.1%
- Active inventory
- 149
- Price-to-rent
- 13.2×
Monthly cashflow live
- Estimated rent
- $2,806 medium interval (Pro) →
- Mortgage (P&I)
- −$1,164
- Tax from tax record
- −$318 /mo · $3,816/yr
- Insurance
- −$92
- HOA
- −$0
- Vacancy / Maint / Mgmt
- −$589
- Net cashflow
- $642
Break-even live
2-unit breakdown (identical units grouped — click to expand)
| Units | Beds | Baths | Est. rent |
|---|---|---|---|
| 2× units | 2 | 1 | $2,806 |
| #1 | 2 | 1 | $1,403 |
| #2 | 2 | 1 | $1,403 |
| Total (2 units) | $2,806 | ||
UW: 25.0% down · 7.5% · 30yr · 1.5% tax · 5.0% vac · 8.0% maint · 8.0% mgmt
Financing live
Cash to close
- Down payment
- $55,500
- Closing costs
- $6,660
- Reserves months
- —
- Total cash needed
- —
Loan-product check · same deal, 3 products live
Conventional
25% down · 7.5% · 30yr
- Down + closing
- —
- Monthly P&I
- —
- Monthly cashflow
- —
- DSCR
- —
- Eligible?
- —
Personal DTI + credit; lowest rate.
DSCR
20% down · 8.5% · 30yr
- Down + closing
- —
- Monthly P&I
- —
- Monthly cashflow
- —
- DSCR
- —
- Eligible?
- —
No personal income docs; deal must DSCR.
Hard money
10% down · 12.0% · 12mo
- Down + closing
- —
- Monthly P&I
- —
- Monthly cashflow
- —
- DSCR
- —
- Eligible?
- —
Short-term bridge; refi at stabilization.
Rent comps 19 comps
| Address | Beds | Baths | Sqft | Rent | $/sqft | DOM | Units | Dist |
|---|---|---|---|---|---|---|---|---|
| 513 13th Ave SE Rochester, MN | 2.0 | 1.0 | 850 | $1,550 | $1.82 | 43d | 1 | 0.28mi |
| 524 10th St SE Rochester, MN | 2.0 | 1.0 | 850 | $1,475 | $1.74 | 43d | 1 | 0.41mi |
| 449 E Center St Rochester, MN | 1.0–3.0 | 1.0–2.0 | 1165 | $3,795 | $3.26 | 13d | 40 | 0.59mi |
| 220 Broadway Ave S #911 Rochester, MN | 2.0 | 2.0 | 1078 | $1,750 | $1.62 | 43d | 1 | 0.62mi |
| 705 1st Ave SW Rochester, MN | 3.0 | 1.0–2.5 | 1135 | $3,875 | $3.41 | 13d | 91 | 0.65mi |
| 511 3rd Ave SW Rochester, MN | 2.0 | 1.0 | 647 | $1,795 | $2.77 | 13d | 26 | 0.79mi |
| 1902 8 1/2 St SE Unit Andover 1902-D Rochester, MN | 3.0 | 2.0 | 1100 | $1,250 | $1.14 | 43d | 1 | 0.84mi |
| 2016 8 1/2 St SE Unit Andover 2016-A Rochester, MN | 3.0 | 2.0 | 1100 | $1,250 | $1.14 | 43d | 1 | 0.88mi |
| 504 14th St SE #6 Rochester, MN | 2.0 | 1.0 | 725 | $995 | $1.37 | 43d | 1 | 0.90mi |
| 401 Broadway Ave N Rochester, MN | 2.0 | 1.0–2.0 | 799 | $1,977 | $2.47 | 13d | 22 | 0.96mi |
| 400 1st Ave NW Rochester, MN | 1.0–2.0 | 1.0–2.0 | 819 | $1,510 | $1.84 | 13d | 7 | 1.01mi |
| 1537 6th Ave SE Unit 1523-D Rochester, MN | 2.0 | 1.0 | 800 | $975 | $1.22 | 13d | 1 | 1.06mi |
| 603 1st St SW Rochester, MN | 2.0 | 1.0 | 512 | $1,295 | $2.53 | 13d | 3 | 1.07mi |
| 28 7th St NE Rochester, MN | 2.0 | 1.0–2.0 | 789 | $2,750 | $3.49 | 21d | 18 | 1.08mi |
| 625 3rd St SW Rochester, MN | 1.0–2.0 | 1.0 | 612 | $1,395 | $2.28 | 13d | 3 | 1.09mi |
| 718 5th St SW Rochester, MN | 2.0 | 1.0 | 722 | $1,400 | $1.94 | 13d | 4 | 1.10mi |
| 2041 14th St SE Rochester, MN | 2.0 | 1.0 | 1012 | $1,700 | $1.68 | 21d | 1 | 1.21mi |
| 1505 Marion Rd SE Rochester, MN | 1.0–3.0 | 1.0–2.0 | 864 | $1,630 | $1.89 | 13d | 1 | 1.25mi |
| 1732 2nd Ave SE Rochester, MN | 2.0 | 1.0 | 780 | $1,450 | $1.86 | 13d | 1 | 1.38mi |
Listing history 28 events
-
2026-06-19days on market $221,999 Active 27 DOM
-
2026-06-18days on market $221,999 Active 26 DOM
-
2026-06-17days on market $221,999 Active 25 DOM
-
2026-06-16days on market $221,999 Active 24 DOM
-
2026-06-15days on market $221,999 Active 23 DOM
-
2026-06-14days on market $221,999 Active 21 DOM
-
2026-06-13days on market $221,999 Active 20 DOM
-
2026-06-10days on market $221,999 Active 18 DOM
-
2026-06-09days on market $221,999 Active 17 DOM
-
2026-06-08days on market $221,999 Active 16 DOM
-
2026-06-07days on market $221,999 Active 15 DOM
-
2026-06-05days on market $221,999 Active 12 DOM
-
2026-06-03days on market $221,999 Active 11 DOM
-
2026-06-02days on market $221,999 Active 10 DOM
-
2026-06-01days on market $221,999 Active 9 DOM
-
2026-05-31days on market $221,999 Active 8 DOM
-
2026-05-30days on market $221,999 Active 7 DOM
-
2026-05-23$221,999 Active
-
2025-05-05historical
-
2025-04-28price $217,999
-
2025-04-03$237,450 Active
-
2020-07-29soldstatus $36,903
-
2002-12-03soldstatus $93,900 238-char remark
Show marketing remark (238 chars)
Duplex located in a quiet residential area. New windows, doors, vinyl siding, insulation, furnance, and water heater in 1989. New garage doors in 1998. Enclosed front porch. Roof is 1 yr old, windows are up to code. Renter pays electric.
-
2002-12-03soldstatus $93,900
Show marketing remark (238 chars)
Duplex located in a quiet residential area. New windows, doors, vinyl siding, insulation, furnance, and water heater in 1989. New garage doors in 1998. Enclosed front porch. Roof is 1 yr old, windows are up to code. Renter pays electric.
-
2002-11-07historical 238-char remark
Show marketing remark (238 chars)
Duplex located in a quiet residential area. New windows, doors, vinyl siding, insulation, furnance, and water heater in 1989. New garage doors in 1998. Enclosed front porch. Roof is 1 yr old, windows are up to code. Renter pays electric.
-
2002-09-25$93,900 238-char remark
Show marketing remark (238 chars)
Duplex located in a quiet residential area. New windows, doors, vinyl siding, insulation, furnance, and water heater in 1989. New garage doors in 1998. Enclosed front porch. Roof is 1 yr old, windows are up to code. Renter pays electric.
-
2001-07-27$83,500
-
2001-07-27historical
ⓘ Source: listings_history table (triggers on properties + properties_extension) + one-shot
backfill from property_details.listing_events for pre-trigger history.
Tax reassessment forecast MN · Partial reset (capped growth)
- Current annual tax
- $3,816 · $318/mo
- Projected year-2 tax
- $3,816 · $318/mo
- Expected delta
- $0/yr ($0/mo · 0.0%)
ⓘ Screening estimate from a state-policy table — verify with the county assessor before closing.
Climate risk First Street
- Flood 1/10 Low FEMA zone X (unshaded) · 0% chance over 30 yrs
- Wildfire 1/10 Low
- Heat 2/10 Low 7 d/yr ≥98°F today · 15 d/yr by 30 yrs out
- Wind 2/10 Low
- Air quality 2/10 Low 1 unhealthy d/yr today · 1 by 30 yrs out
Nearby sold comps map
Loading sold comps map…
Walkable amenities ~0.75 mi
Loading nearby amenities…
Taxation est. · year 1
- Rental income
- $33,672
- − Mortgage interest
- −$12,435
- − Property taxes
- −$3,816
- − Insurance
- −$1,110
- − Repairs & maintenance
- −$2,694
- − Management
- −$2,694
- − Depreciation
- −$6,458
- Taxable income
- $4,465
- Est. tax owed @ 24.0%
- −$1,072
- After-tax cash flow
- $6,633/yr
For passive investors: Depreciation is non-cash, so a rental often shows a tax loss while cash-flowing — sheltering income. Rental losses are passive: they offset passive income freely, and up to $25,000/yr can offset ordinary (W-2) income if you actively participate and your MAGI is under $100k (phasing out to $0 by $150k); unused losses carry forward. On sale, claimed depreciation is recaptured at up to 25%, and gains may owe capital-gains tax (a 1031 exchange can defer both). Figures are a year-1 estimate at your 24.0% rate — not tax advice; consult a CPA.
Schools (NCES district)
- District
- Rochester Public School District
- NCES district ID
- 2731800
- Math proficiency
- 40% ▼ -10.00%
- Reading proficiency
- 51% ▼ -4.00%
- Median HH income
- $66,540
- Composite
- 40.6/100
- National rank
- #3695
- State rank
- #152 of 301 in MN
Livability — Rochester
- Score
- 92/100
- State rank
- #1
- US rank
- #27
Category grades
Schools grade is shown separately in the Schools card above.
Census & demographics
- Census place
- Rochester, MN
- County
- Olmsted County · 135,035 people
- City population
- 135,035
- Metro
- Rochester, MN
- Population (ZIP)
- 29,639
- Household income
- $77,016
- Rent vs Own
- Severe rent burden
- 864.0
Population outlook (Olmsted County) Hauer SSP2
- Today (2025)
- 165,999 people
- By 2030
- 172,425 · +3.9%
- By 2040
- 183,785 · +10.7%
- By 2050
- 192,981 · +16.3%
- By 2075
- 215,284 · +29.7%
- By 2100
- 224,887 · +35.5%
Race, ethnicity, and origin ACS 2023
- Neighborhood character
- Predominantly White (74%)
- Race & ethnicity
- White 74% Black 10% Hispanic / Latino 8% Two or more races 5% Asian 3%
- Hispanic origin (detail)
- Mexican 6%
- Common ancestry
- Portuguese 11% Lithuanian 2% Italian 2%
- Foreign-born
- 11% · Canada, China, Vietnam
- Languages at home
- 84% English-only · Spanish 5% Other Asian/Pacific 3% Arabic 2%
Political lean MEDSL · Olmsted
- 2024 margin
- D (+10.7) · D 54.3% · R 43.6% · Other 2.1%
- 2008→2024 swing
- +7.4pp toward D · 2008: 3.3pp · 2024: 10.7pp
- All cycles
- 2024: D+10.7 2020: D+10.7 2016: D+0.8 2012: D+3.2 2008: D+3.3
Not yet ingested
- Civics
- —
Market trends
- HPI YoY
- ▼ -161.04%
- Current HPI
- 267.168
- Rent YoY
- ▲ 2.10%
- Metro
- Rochester, MN
- State GDP YoY
- ▲ 2.41%
- F500 in state
- 34
Industry mix (Fortune 500 HQ in MN)
| Industry | F500 HQs | Revenue |
|---|---|---|
| Healthcare | 2 | $407B |
|
||
| Retail | 2 | $150B |
|
||
| Consumer Goods | 2 | $32B |
|
||
| Industrial Machinery | 2 | $6B |
|
||
| Agriculture | 1 | $40B |
|
||
| Healthcare / Medical Devices | 1 | $32B |
|
||
Price history
+165.9% since first listed11 events — show timeline
- 2026-05-23 Listed $221,999 NORTHSTARMLS as Distributed by MLS Grid
- 2025-05-05 Listing Removed — NORTHSTARMLS as Distributed by MLS Grid
- 2025-04-28 Price Changed $217,999 NORTHSTARMLS as Distributed by MLS Grid
- 2025-04-03 Listed $237,450 NORTHSTARMLS as Distributed by MLS Grid
- 2020-07-29 Sold (Public Records) $36,903 Public Records
- 2002-12-03 Sold (Public Records) $93,900 Public Records
- 2002-12-03 Sold (MLS) $93,900 NORTHSTARMLS as Distributed by MLS Grid
- 2002-11-07 Listing Removed — NORTHSTARMLS as Distributed by MLS Grid
- 2002-09-25 Listed $93,900 NORTHSTARMLS as Distributed by MLS Grid
- 2001-07-27 Listing Removed — NORTHSTARMLS as Distributed by MLS Grid
- 2001-07-27 Listed $83,500 NORTHSTARMLS as Distributed by MLS Grid
Property tax history
+6.1%/yrLatest (2025): $3,816 · +4.9% YoY. Source: county tax records.
Cash-flow waterfall
monthlySold comps — $/sqft
last 12 mo · ≤1 miLoading sold comps…